. 2022 Sep 23;26(1):287.
doi: 10.1186/s13054-022-04156-0.

A novel capnogram analysis to guide ventilation during cardiopulmonary resuscitation: clinical and experimental observations

Affiliations

A novel capnogram analysis to guide ventilation during cardiopulmonary resuscitation: clinical and experimental observations

Arnaud Lesimple et al. Crit Care. .

Abstract

Background: Cardiopulmonary resuscitation (CPR) decreases lung volume below the functional residual capacity and can generate intrathoracic airway closure. Conversely, large insufflations can induce thoracic distension and jeopardize circulation. The capnogram (CO2 signal) obtained during continuous chest compressions can reflect intrathoracic airway closure, and we hypothesized here that it can also indicate thoracic distension.

Objectives: To test whether a specific capnogram may identify thoracic distension during CPR and to assess the impact of thoracic distension on gas exchange and hemodynamics.

Methods: (1) In out-of-hospital cardiac arrest patients, we identified on capnograms three patterns: intrathoracic airway closure, thoracic distension or regular pattern. An algorithm was designed to identify them automatically. (2) To link CO2 patterns with ventilation, we conducted three experiments: (i) reproducing the CO2 patterns in human cadavers, (ii) assessing the influence of tidal volume and respiratory mechanics on thoracic distension using a mechanical lung model and (iii) exploring the impact of thoracic distension patterns on different circulation parameters during CPR on a pig model.

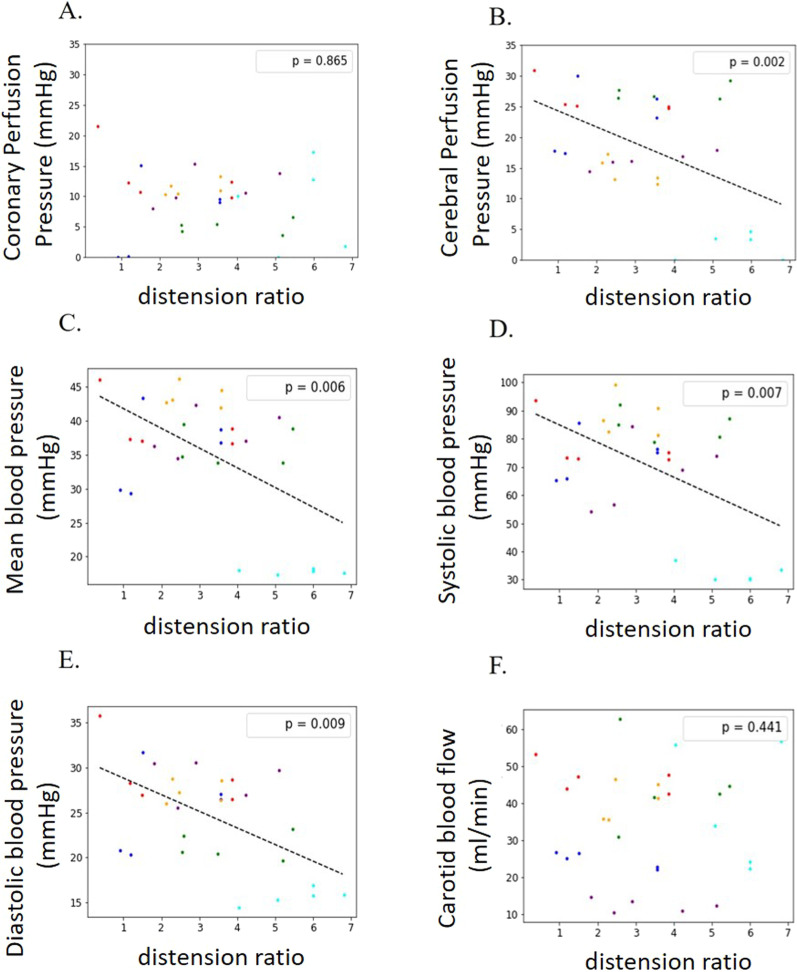
Measurements and main results: (1) Clinical data: 202 capnograms were collected. Intrathoracic airway closure was present in 35%, thoracic distension in 22% and regular pattern in 43%. (2) Experiments: (i) Higher insufflated volumes reproduced thoracic distension CO2 patterns in 5 cadavers. (ii) In the mechanical lung model, thoracic distension patterns were associated with higher volumes and longer time constants. (iii) In six pigs during CPR with various tidal volumes, a CO2 pattern of thoracic distension, but not tidal volume per se, was associated with a significant decrease in blood pressure and cerebral perfusion.

Conclusions: During CPR, capnograms reflecting intrathoracic airway closure, thoracic distension or regular pattern can be identified. In the animal experiment, a thoracic distension pattern on the capnogram is associated with a negative impact of ventilation on blood pressure and cerebral perfusion during CPR, not predicted by tidal volume per se.

Keywords: CO2 pattern; Cardiac arrest; Cardiopulmonary resuscitation; Intrathoracic airway closure; Thoracic distension.


Conflict of interest statement

AL is Ph.D. student in the Med2Lab partially funded by Air Liquide Medical Systems. DS reports grants from Fisher & Paykel and travel fees from Air Liquide Medical Systems. SD is consultant for Vitalaire Canada INC. FB reports personal fees from Löwenstein Medical, travel fees from Draeger and Air Liquide Medical systems and research support from Covidien, GE Healthcare and Getinge Group, outside this work. NP reports salary for research activities (Med2Lab) from Air Liquide Medical Systems. AB is master student from Telecom Physique Strasbourg University France. AM reports personal fees from Draeger, Faron Pharmaceuticals, Air Liquide Medical Systems, Pfizer, ResMed and Draeger and grants and personal fees from Fisher & Paykel and Covidien, outside this work. LB has received research grants for his research laboratory from Covidien (PAV), Draeger (EIT) and equipment from Fisher & Paykel (high flow), Air Liquide, Sentec (PtcCO2) and Philips (sleep) and received fees for lectures from Fisher & Paykel. RT reports grants from Air Liquide and grants, shares and personal fees from Orixha, all outside of this work. JCR reports part-time salary for research activities (Med2Lab) from Air Liquide Medical Systems and Vygon and grants from Creative Air Liquide. All other authors declare no competing interests.

Figures

Fig. 1
Fig. 1
Capnograms classification from clinical observations. The figure illustrates the distribution of capnograms according to the classification. Each panel shows a typical CO2 pattern obtained from clinical observations after numerical treatment from raw capnogram data (python, Python Software Foundation, Wilmington, Delaware, USA). X-axis represents inspiratory and expiratory time. A Intrathoracic airway closure: oscillations due to chest compressions and decompressions are small or absent. Lung volume reduction far below the FRC and complete or partial intrathoracic airway closure explain this specific capnogram. B Thoracic distension: oscillations due to chest compressions and decompressions are limited or absent at the beginning of the expiration phase and resume after a few chest compressions. Increase in lung volume due to large Vt insufflation before returning to FRC explains this specific capnogram. C Regular pattern: oscillations due to chest compressions and decompressions are clearly visible during the entire duration of the expiration phase. The regular pattern corresponds to the situation when neither thoracic distension nor intrathoracic airway closure is identified
Fig. 2
Fig. 2
Quantification of thoracic distension: the distension ratio. The figure shows examples of capnograms representing different distension ratios (used to quantify thoracic distension) calculated as a continuous variable. Typical capnograms from the animal experiment are displayed for three values of “distension ratio”: 1.5 on panel A, 3.5 on panel B and 5.5 on panel C. X-axis corresponds to inspiratory and expiratory time. AUC1 represents the area under the CO2 curve between the beginning of the expiratory CO2 signal and the first local minimum (The first local minima having an amplitude two times lower than the mean amplitude of all peaks are discarded). AUC2 represents the area under the CO2 curve of the first “normal” oscillation corresponding to an efficient compression decompression phase around FRC. The distension ratio corresponds to the ratio AUC1/AUC2. It is used as a surrogate marker of the level of thoracic distension
Fig. 3
Fig. 3
Reproduction of CO2 patterns on Thiel cadaver model: illustration in one cadaver. From top to bottom recordings of flow at airway opening (Flow), airway pressure (Paw), esophageal pressure (Peso) and expired CO2 (CO2). The tilted line on the Paw tracing represents the airway opening pressure (AOP). The recording is divided into three configurations: (1) Regular pattern: positive end-expiratory pressure (PEEP) was set above the AOP to simulate airway patency. (2) Intrathoracic airway closure: PEEP was set below the AOP to simulate airway closure. (3) Thoracic distension: PEEP was set above the AOP to simulate airway patency, and peak airway pressure set on the ventilator was increased to generate higher tidal volumes compared to step 1
Fig. 4
Fig. 4
Impact of a stepwise increase in tidal volume on airway pressure, circulation and capnograms in a pig during cardiopulmonary resuscitation. From top to bottom, recording tracings of airway pressure, aortic blood pressure, right atrial pressure, intracranial pressure, coronary perfusion pressure (aortic blood pressure minus right atrial pressure), cerebral perfusion pressure (mean arterial pressure minus intracranial pressure) and capnogram during tidal volume (Vt) trial. Vt was increased as follows: 6–10–15–20 ml/kg. Coronary perfusion pressure waveforms should be interpreted cautiously and read only at end of decompression
Fig. 5
Fig. 5
Relationship between CO2 pattern analyzed by the distension ratio and coronary perfusion, cerebral perfusion, mean, systolic, diastolic blood pressure and carotid blood flow in pigs during cardiopulmonary resuscitation. A Coronary perfusion pressure (measured at end decompression) depending on “distension ratio.” B Cerebral perfusion pressure (mean value throughout chest compression/decompression cycles) depending on “distension ratio.” C Mean blood pressure depending on “distension ratio.” D Systolic blood pressure depending on “distension ratio.” E Diastolic blood pressure depending on “distension ratio.” F Carotid blood flow depending on “distension ratio.” Correlations were assessed using a mixed linear model. The p values are displayed. Each pig is represented by a different color
Fig. 6
Fig. 6
Illustration of thoracic distension mechanism based on airway pressure, flow and CO2 analysis. This figure illustrates from top to bottom, airway pressure (Paw), flow at airway opening (Flow) and expired CO2 (CO2) tracings obtained in cadavers (panel A), bench (panel B) and animals (panel C). The left column illustrates thoracic distension, while the right column represents regular pattern. For each situation, the two gray vertical tilted lines define the time for the lung volume to return to FRC (time with thorax above FRC), while the two black vertical tilted lines define the expiration time (time between two insufflations). Positive flow indicates decompression or insufflation. Negative flow indicates compression or exhalation. Please note the exact time correspondence between flow and CO2 oscillations whatever the situation. During expiration, in case of thoracic distension (left column), the flow does not return to zero line during a couple of CC indicating that the thorax is still above FRC even during the decompression phase. CO2 oscillations resume only once the flow crosses the zero line, thus indicating the return of lung volume to FRC. On the contrary, the right column obtained with a smaller Vt illustrates that the flow induced by CC crosses the zero line immediately after insufflation generating CO2 full oscillations. This specific full oscillating CO2 pattern indicates that chest compressions operate close to FRC

References

    1. Soar J, Böttiger BW, Carli P, Couper K, Deakin CD, Djärv T, et al. European Resuscitation Council Guidelines 2021: adult advanced life support. Resuscitation. 2021;161:115–151. doi: 10.1016/j.resuscitation.2021.02.010. - DOI - PubMed
    1. Chang MP, Idris AH. The past, present, and future of ventilation during cardiopulmonary resuscitation. Curr Opin Crit Care. 2017;23:188–192. doi: 10.1097/MCC.0000000000000415. - DOI - PubMed
    1. Sutton RM, French B, Meaney PA, Topjian AA, Parshuram CS, Edelson DP, et al. Physiologic monitoring of CPR quality during adult cardiac arrest: a propensity-matched cohort study. Resuscitation. 2016;106:76–82. doi: 10.1016/j.resuscitation.2016.06.018. - DOI - PMC - PubMed
    1. Leturiondo M, Ruiz de Gauna S, Gutiérrez JJ, Alonso D, Corcuera C, Urtusagasti JF, et al. Chest compressions induce errors in end-tidal carbon dioxide measurement. Resuscitation. 2020;153:195–201. doi: 10.1016/j.resuscitation.2020.05.029. - DOI - PubMed
    1. Leturiondo M, Ruiz de Gauna S, Ruiz JM, Julio Gutiérrez J, Leturiondo LA, González-Otero DM, et al. Influence of chest compression artefact on capnogram-based ventilation detection during out-of-hospital cardiopulmonary resuscitation. Resuscitation. 2018;124:63–68. doi: 10.1016/j.resuscitation.2017.12.013. - DOI - PubMed

LinkOut - more resources