

Effects of climate on salmonid productivity: A global meta-analysis across freshwater ecosystems
- PMID: 36151941
- PMCID: PMC9827867
- DOI: 10.1111/gcb.16446
Effects of climate on salmonid productivity: A global meta-analysis across freshwater ecosystems
Abstract
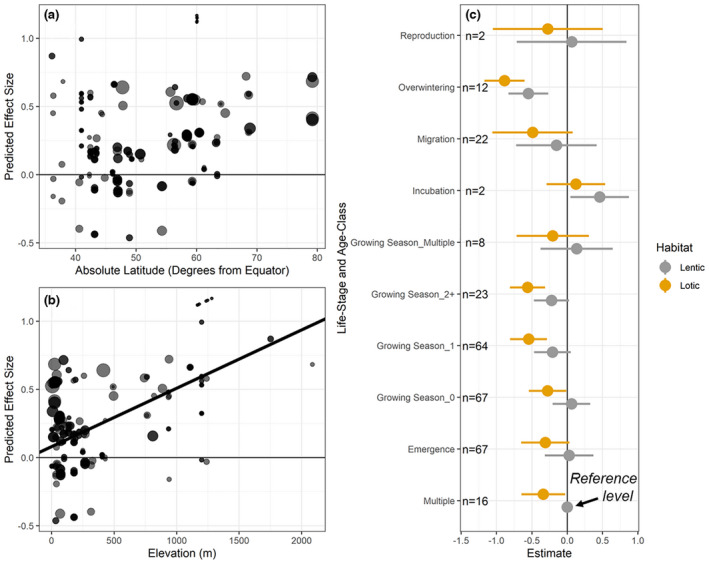
Salmonids are of immense socio-economic importance in much of the world, but are threatened by climate change. This has generated a substantial literature documenting the effects of climate variation on salmonid productivity in freshwater ecosystems, but there has been no global quantitative synthesis across studies. We conducted a systematic review and meta-analysis to gain quantitative insight into key factors shaping the effects of climate on salmonid productivity, ultimately collecting 1321 correlations from 156 studies, representing 23 species across 24 countries. Fisher's Z was used as the standardized effect size, and a series of weighted mixed-effects models were compared to identify covariates that best explained variation in effects. Patterns in climate effects were complex and were driven by spatial (latitude, elevation), temporal (time-period, age-class), and biological (range, habitat type, anadromy) variation within and among study populations. These trends were often consistent with predictions based on salmonid thermal tolerances. Namely, warming and decreased precipitation tended to reduce productivity when high temperatures challenged upper thermal limits, while opposite patterns were common when cold temperatures limited productivity. Overall, variable climate impacts on salmonids suggest that future declines in some locations may be counterbalanced by gains in others. In particular, we suggest that future warming should (1) increase salmonid productivity at high latitudes and elevations (especially >60° and >1500 m), (2) reduce productivity in populations experiencing hotter and dryer growing season conditions, (3) favor non-native over native salmonids, and (4) impact lentic populations less negatively than lotic ones. These patterns should help conservation and management organizations identify populations most vulnerable to climate change, which can then be prioritized for protective measures. Our framework enables broad inferences about future productivity that can inform decision-making under climate change for salmonids and other taxa, but more widespread, standardized, and hypothesis-driven research is needed to expand current knowledge.
Keywords: abundance; data synthesis; freshwater fish; growth; population dynamics; systematic review.
© 2022 The Authors. Global Change Biology published by John Wiley & Sons Ltd.
Conflict of interest statement
The authors have no conflict of interest to declare.
Figures


Similar articles
-
Effects of climate change on stream temperature and salmonid habitats in a Cascades river basin.J Environ Manage. 2025 Jul;387:125843. doi: 10.1016/j.jenvman.2025.125843. Epub 2025 May 21. J Environ Manage. 2025. PMID: 40403659
-
Body size and early marine conditions drive changes in Chinook salmon productivity across northern latitude ecosystems.Glob Chang Biol. 2024 Oct;30(10):e17508. doi: 10.1111/gcb.17508. Glob Chang Biol. 2024. PMID: 39377278
-
Effects of climate change and wildfire on stream temperatures and salmonid thermal habitat in a mountain river network.Ecol Appl. 2010 Jul;20(5):1350-71. doi: 10.1890/09-0822.1. Ecol Appl. 2010. PMID: 20666254
-
Mitigating human impacts including climate change on proliferative kidney disease in salmonids of running waters.J Fish Dis. 2022 Apr;45(4):497-521. doi: 10.1111/jfd.13585. Epub 2022 Jan 31. J Fish Dis. 2022. PMID: 35100455 Review.
-
The ecology of fish parasites with particular reference to helminth parasites and their salmonid fish hosts in Welsh rivers: a review of some of the central questions.Adv Parasitol. 2002;52:1-154. doi: 10.1016/s0065-308x(02)52011-x. Adv Parasitol. 2002. PMID: 12521260 Review.
Cited by
-
Effects of Different Preservatives During Ecological Monitoring of Myxozoan Parasite Tetracapsuloides bryosalmonae Causing Proliferative Kidney Disease (PKD) in Salmonids.J Fish Dis. 2025 Jun;48(6):e14095. doi: 10.1111/jfd.14095. Epub 2025 Feb 12. J Fish Dis. 2025. PMID: 39939283 Free PMC article.
-
Ribosome Profiling and RNA Sequencing Reveal Translation and Transcription Regulation under Acute Heat Stress in Rainbow Trout (Oncorhynchus mykiss, Walbaum, 1792) Liver.Int J Mol Sci. 2024 Aug 14;25(16):8848. doi: 10.3390/ijms25168848. Int J Mol Sci. 2024. PMID: 39201531 Free PMC article.
References
-
- Al‐Chokhachy, R. , Schmetterling, D. , Clancy, C. , Saffel, P. , Kovach, R. , Nyce, L. , Liermann, B. , Fredenberg, W. , & Pierce, R. (2016). Are brown trout replacing or displacing bull trout populations in a changing climate? Canadian Journal of Fisheries and Aquatic Sciences, 73(9), 1395–1404.
-
- Almodóvar, A. , Nicola, G. G. , Ayllón, D. , & Elvira, B. (2012). Global warming threatens the persistence of Mediterranean brown trout. Global Change Biology, 18(5), 1549–1560.
-
- Arismendi, I. , Safeeq, M. , Johnson, S. L. , Dunham, J. B. , & Haggerty, R. (2013). Increasing synchrony of high temperature and low flow in western north American streams: Double trouble for coldwater biota? Hydrobiologia, 712(1), 61–70.
-
- ASF (Atlantic Salmon Federation) . (2011). Economic value of wild Atlantic salmon . Final report prepared by Gardner Pinfold Consultants Inc.
Data sources
-
- Al‐Chokhachy, R. , Schmetterling, D. , Clancy, C. , Saffel, P. , Kovach, R. , Nyce, L. , Liermann, B. , Fredenberg, W. , & Pierce, R. (2016). Are brown trout replacing or displacing bull trout populations in a changing climate? Canadian Journal of Fisheries and Aquatic Sciences, 73(9), 1395–1404.
-
- Arnekleiv, J. V. , Finstad, A. G. , & Rønning, L. (2006). Temporal and spatial variation in growth of juvenile Atlantic salmon. Journal of Fish Biology, 68(4), 1062–1076.
-
- Auvinen, H. E. I. K. K. I. (1988). Factors affecting the year‐class strength of vendace (Coregonus albula [L.]) in Lake Pyhäjärvi (Karelia, SE, Finland). Finnish Fisheries Research, 9, 235–243.
-
- Bærum, K. M. , Haugen, T. O. , Kiffney, P. , Moland Olsen, E. , & Vøllestad, L. A. (2013). Interacting effects of temperature and density on individual growth performance in a wild population of brown trout. Freshwater Biology, 58(7), 1329–1339.
-
- Baigun, C. R. , Sedell, J. , & Reeves, G. (2000). Influence of water temperature in use of deep pools by summer steelhead in Steamboat Creek, Oregon (USA). Journal of Freshwater Ecology, 15(2), 269–279.
Publication types
MeSH terms
LinkOut - more resources
Full Text Sources
Other Literature Sources
