

DNA methylation regulator-mediated modification patterns and tumor microenvironment characterization in glioma
- PMID: 36152044
- PMCID: PMC9596205
- DOI: 10.18632/aging.204291
DNA methylation regulator-mediated modification patterns and tumor microenvironment characterization in glioma
Abstract
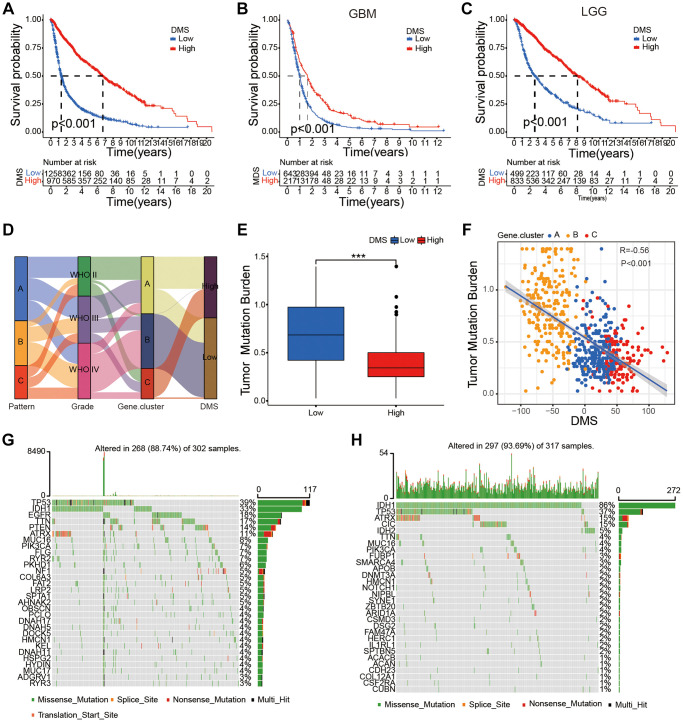
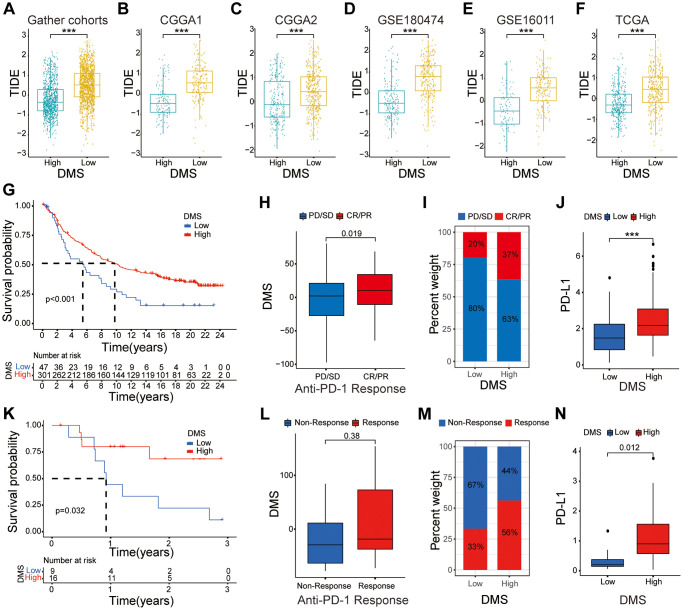
Growing evidences indicate DNA methylation plays a crucial regulatory role in inflammation, innate immunity, and immunotherapy. However, the overall landscape of various DNA methylation regulatory genes and their relationship with the infiltration of immune cells into the tumor microenvironment (TME) as well as the response to immunotherapy in gliomas is still not clear. Therefore, we comprehensively analyzed the correlation between DNA methylation regulator patterns, infiltration of immune cell-types, and tumor immune response status in gather glioma cohorts. Furthermore, we calculated the DNA methylation score (DMS) for individual glioma samples, then evaluated the relationship between DMS, clinicopathological characteristics, and overall survival (OS) in patients with gliomas. Our results showed three distinct DNA methylation regulator patterns among the glioma patients which correlated with three distinct tumor immune response phenotypes, namely, immune-inflamed, immune-excluded, and immune desert. We then calculated DMS for individual glioma samples based on the expression of DNA methylation-related gene clusters. Furthermore, DMS, tumor mutation burden (TMB), programmed death 1 (PD-1) expression, immune cell infiltration status in the TME, and Tumor Immune Dysfunction and Exclusion (TIDE) scores were associated with survival outcomes and clinical responses to immune checkpoint blockade therapy. We also validated the predictive value of DMS in two independent immunotherapy cohorts. In conclusion, our results demonstrated that three DNA methylation regulator patterns that correlated with three tumor immune response phenotypes. Moreover, we demonstrated that DMS was an independent predictive biomarker that correlated with survival outcomes of glioma patients and their responses to immunotherapy therapeutic regimens.
Keywords: DNA methylation; glioma; immune phenotypes; immunotherapy; tumor mutation burden.
Conflict of interest statement
Figures
Similar articles
-
Use of Novel m6A Regulator-mediated Methylation Modification Patterns in Distinct Tumor Microenvironment Profiles to Identify and Predict Glioma Prognosis and Progression, T-cell Dysfunction, and Clinical Response to ICI Immunotherapy.Curr Pharm Des. 2023;29(1):60-78. doi: 10.2174/1381612829666221207112438. Curr Pharm Des. 2023. PMID: 36503445
-
DNA methylation regulator-mediated modification pattern defines tumor microenvironment immune infiltration landscape in colon cancer.Front Genet. 2022 Oct 6;13:1008644. doi: 10.3389/fgene.2022.1008644. eCollection 2022. Front Genet. 2022. PMID: 36276973 Free PMC article.
-
m6A regulator-mediated methylation modification patterns and tumor microenvironment infiltration characterization in gastric cancer.Mol Cancer. 2020 Mar 12;19(1):53. doi: 10.1186/s12943-020-01170-0. Mol Cancer. 2020. PMID: 32164750 Free PMC article.
-
Epigenetic reprogramming and antitumor immune responses in gliomas: a systematic review.Med Oncol. 2025 May 16;42(6):213. doi: 10.1007/s12032-025-02760-y. Med Oncol. 2025. PMID: 40380049 Review.
-
The interaction between DNA methylation and tumor immune microenvironment: from the laboratory to clinical applications.Clin Epigenetics. 2024 Feb 8;16(1):24. doi: 10.1186/s13148-024-01633-x. Clin Epigenetics. 2024. PMID: 38331927 Free PMC article. Review.
Cited by
-
Link between m6A modification and infiltration characterization of tumor microenvironment in lung adenocarcinoma.Exp Biol Med (Maywood). 2023 Dec;248(23):2273-2288. doi: 10.1177/15353702231214266. Epub 2024 Jan 2. Exp Biol Med (Maywood). 2023. PMID: 38166412 Free PMC article.
-
DNMT3A promotes glioma growth and malignancy via TNF-α/NF-κB signaling pathway.Transl Cancer Res. 2024 Apr 30;13(4):1786-1806. doi: 10.21037/tcr-23-1943. Epub 2024 Apr 22. Transl Cancer Res. 2024. PMID: 38737693 Free PMC article.
-
Identification of DNA methylation characteristics associated with metastasis and prognosis in colorectal cancer.BMC Med Genomics. 2024 May 10;17(1):127. doi: 10.1186/s12920-024-01898-4. BMC Med Genomics. 2024. PMID: 38730335 Free PMC article.
References
-
- Cloughesy TF, Petrecca K, Walbert T, Butowski N, Salacz M, Perry J, Damek D, Bota D, Bettegowda C, Zhu JJ, Iwamoto F, Placantonakis D, Kim L, et al.. Effect of Vocimagene Amiretrorepvec in Combination With Flucytosine vs Standard of Care on Survival Following Tumor Resection in Patients With Recurrent High-Grade Glioma: A Randomized Clinical Trial. JAMA Oncol. 2020; 6:1939–46. 10.1001/jamaoncol.2020.3161 - DOI - PMC - PubMed
Publication types
MeSH terms
Substances
LinkOut - more resources
Full Text Sources
