. 2022 Sep 23;14(18):7547-7567.
doi: 10.18632/aging.204302. Epub 2022 Sep 23.

Pyroptosis patterns of colon cancer could aid to estimate prognosis, microenvironment and immunotherapy: evidence from multi-omics analysis

Affiliations

Pyroptosis patterns of colon cancer could aid to estimate prognosis, microenvironment and immunotherapy: evidence from multi-omics analysis

Jing Zhou et al. Aging (Albany NY). .

Abstract

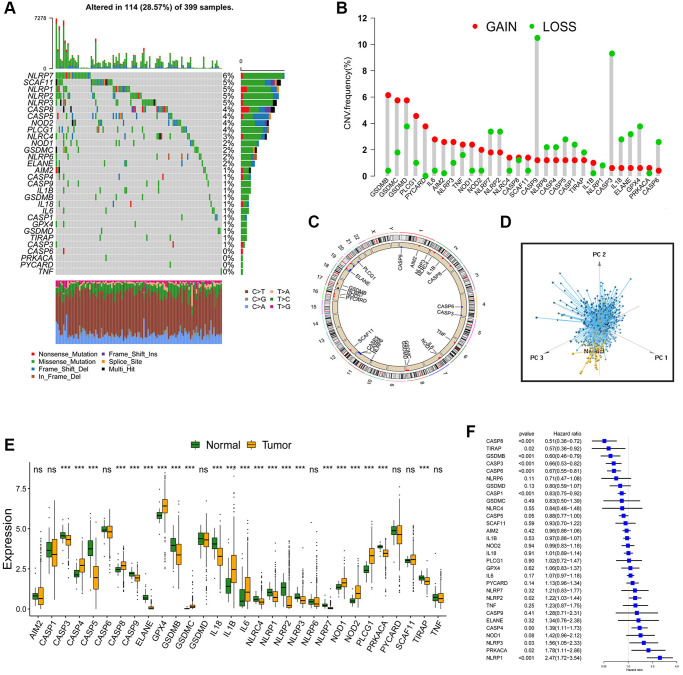
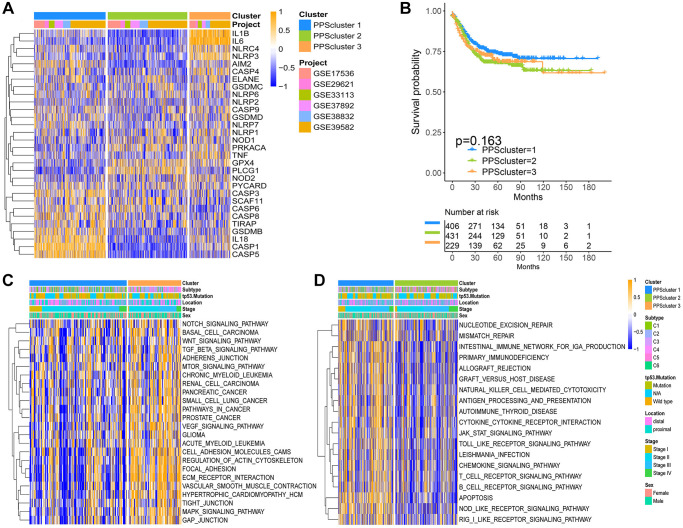
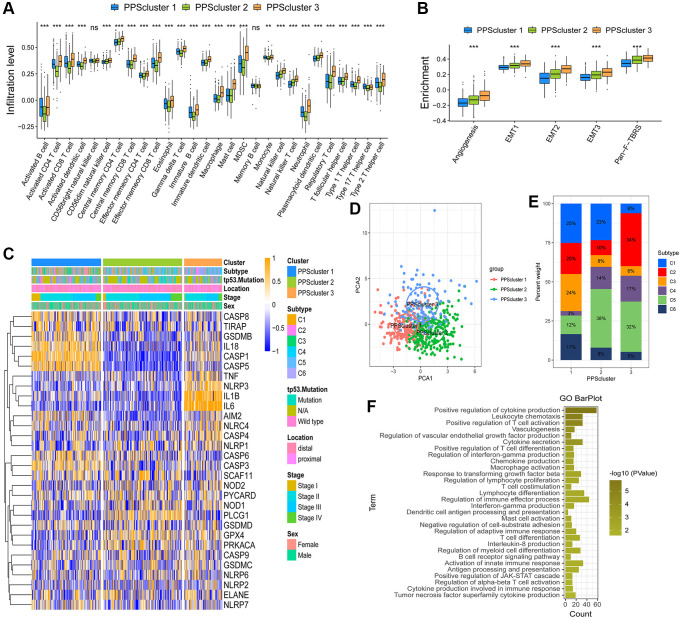
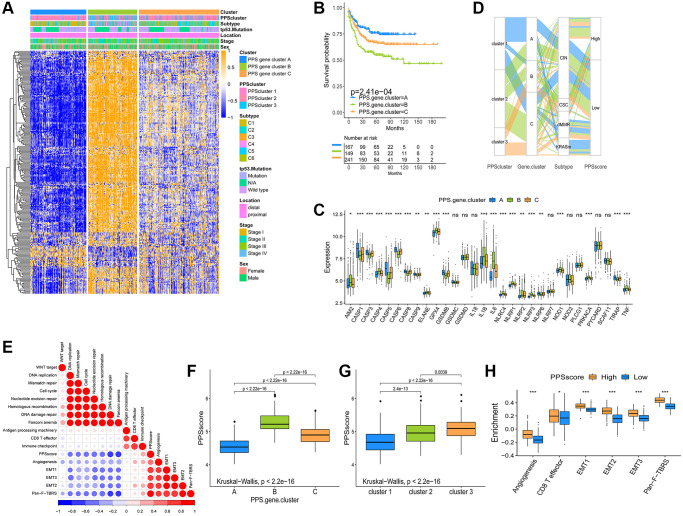
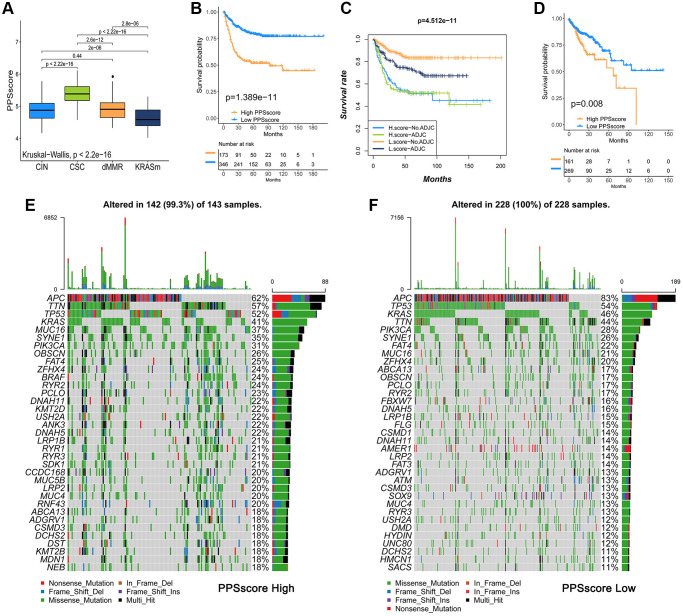
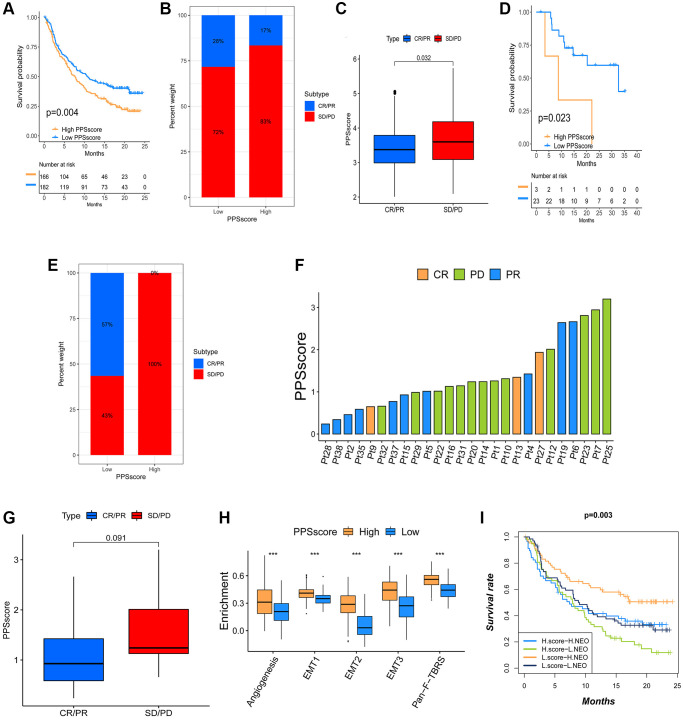
Pyroptosis plays a critical role in the occurrence and development of colon cancer (CC). However, the specific mechanisms of pyroptosis patterns on immune regulation and tumor microenvironment (TME) formation in CC remain unclear. Based on 30 pyroptosis-related genes (PRGs), we evaluated the pyroptosis patterns of 1689 CC samples from the Cancer Genome Atlas and the Gene Expression Omnibus databases. The signatures of pyroptosis patterns and PRGs were identified in CC. In addition to systematically associating these patterns with TME cell infiltration characteristics, we constructed a pyroptosis signature score (PPSscore) to quantify pyroptosis patterns in individual tumor patients with immune responses. We discovered three distinct pyroptosis patterns, each with a different survival probability and being biologically relevant. TME infiltrating characteristics of revealed these patterns, consistent with immune-inflamed, immune-desert and immune-excluded phenotypes. Furthermore, a low PPSscore was associated with better clinical benefits. A high PPSscore was associated with a lower chance of survival due to its association with stromal activation. Additionally, two immunotherapy cohorts revealed that patients with lower PPSscore had better immune responses and durable clinical benefits. Our findings indicate that pyroptosis patterns play a vital role in immunoregulation and the formation of TME in CC.

Keywords: The Cancer Genome Atlas; colon cancer; immunotherapy; pyroptosis patterns; tumor microenvironment.


Conflict of interest statement

CONFLICTS OF INTEREST: The authors declare no conflicts of interest related to this study.

Figures

Figure 1
Figure 1
Landscape of genetic and expression variation of PRGs in CC. (A) Total of 114 of the 399 CC patients experienced genetic alterations of PRGs, with a frequency of 28.57%. The upper barplot showed the tumor mutational burden. The number on the right indicated the mutation frequency in each gene. The stacked barplot below showed fraction of conversions in each sample. Each column represented every individual patient. (B) The histogram showed the CNV variation frequency of PRGs. The height of the column represented the alteration frequency. The deletion frequency, green dot; The amplification frequency, red dot. (C) The location of CNV alteration of PRGs on 23 chromosomes. (D) Principal component analysis for the expression profiles of 30 PRGs to distinguish tumors from normal samples. Tumors were marked with blue and normal samples were marked with yellow. (E) The difference of mRNA expression levels of 30 PRGs between normal and CC samples (*P < 0.05; **P < 0.01; ***P < 0.001). (F) The univariate Cox regression model was used to analyze the prognosis of 30 PRGs in 6 CC cohorts. Hazard ratio >1 indicated risk factors for survival, and hazard ratio <1 indicated protective factors for survival.
Figure 2
Figure 2
Pyroptosis patterns and relevant biological pathway for each pattern. (A) Unsupervised clustering of 30 PRGs in the six CC cohorts. The PPSclusters and cohorts’ names were used as patient annotations. Each column represented patients and each row represented PRGs. (B) Unsupervised clustering analysis of CC patients from 6 GEO cohorts (GSE39582, GSE38832, GSE37892, GSE33113, GSE29621 and GSE17536) resulted in three pyroptosis patterns. Kaplan-Meier curves of relapse-free survival for CC patients in the meta-GEO cohort with different pyroptosis patterns. (C, D) The heatmaps were used to visualize the gene set variation analysis score of representative biological pathways in distinct pyroptosis patterns. The color of orange represented activated pathways and blue represented inhibited pathways. The CC cohorts were used as sample annotations. PPScluster-1 vs. PPScluster-3 (C) and PPScluster-1 vs. PPScluster-2 (D).
Figure 3
Figure 3
TME cell infiltration characteristics in distinct pyroptosis patterns. (A) The abundance of each TME infiltrating cell in three pyroptosis patterns (*P < 0.05; **P < 0.01; ***P < 0.001). (B) Differences in stroma-activated pathways in three pyroptosis patterns (*P < 0.05; **P < 0.01; ***P < 0.001). (C) Unsupervised clustering of 30 PRGs in the GSE39582 cohort. Clinicopathological information including tumor subtype, tp53 mutation, tumor location, tumor stage, and gender as well as the pyroptosis cluster, were shown in annotations above. Orange represented the high expression of genes and blue represented the low expression. (D) Principal component analysis of the transcriptome maps of the three pyroptosis patterns showed that there were significant differences among them. (E) The proportion of six molecular subtypes in GSE39582 cohort among three pyroptosis patterns. (F) The gene ontology enrichment analysis functionally annotates DEGs related to the pyroptosis patterns.
Figure 4
Figure 4
Construction and analysis of pyroptosis signatures. (A) Unsupervised clustering of overlapping pyroptosis phenotype-related genes in GSE39582 cohort to classify patients into three genomic subtype (PPS gene cluster AC). Clinicopathological information such as tumor subtype, tp53 mutation, tumor location, tumor stage, and gender was used as patient annotations. (B) The survival curves of the pyroptosis phenotype-related gene signatures were shown using the Kaplan-Meier plotter. (C) The expression of 30 PRGs in three gene clusters (*P < 0.05; **P < 0.01; ***P < 0.001). (D) The changes of PPSclusters, PPS gene clusters, tumor molecular subtypes and PPSscore were shown in the Alluvial diagram. (E) Correlations between PPSscore and the other gene signatures in GSE39582 CC cohort using Spearman analysis. Negative correlation was marked with blue and positive correlation with red. (F, G) The Kruskal-Wallis test was used to compare the statistical difference in PPSscore among three gene clusters and three PPSclusters. (H) Differences in stroma-activated pathways between high and low PPSscore groups (*P < 0.05; **P < 0.01; ***P < 0.001).
Figure 5
Figure 5
Analysis of pyroptosis patterns characteristics and tumor somatic mutation. (A) The Kruskal-Wallis test was used to compare the statistical differences of PPSscore among the four molecular subtypes. (B) Survival analyses for low and high PPSscore patient groups in GSE39582 using Kaplan-Meier curves. (C) Survival analyses for subgroup patients classified by PPSscore and treatment with adjuvant chemotherapy (ADJC) using Kaplan-Meier curves. (D) Survival analyses for low and high PPSscore patient groups in the TCGA-COAD cohort using Kaplan-Meier curves. (E, F) Tumor somatic mutation landscape in TCGA-COAD cohort were established according to high PPSscore (E) and low PPSscore (F). Each column represented individual patients. The upper barplot showed TMB. The right number indicated the mutation frequency in each gene. The right barplot showed the proportion of each variant type.
Figure 6
Figure 6
The influence of distinct PPSscore on anti-PD-1/L1 immunotherapy. (A) Survival analyses for low and high PPSscore patient groups in the anti-PD-L1 immunotherapy cohort using Kaplan-Meier curves. (B) The percent weight of patients with clinical response to anti-PD-L1 immunotherapy in low or high PPSscore groups. SD/PD, stable disease/progressive disease; CR/PR, complete response/partial response. (C) The distribution of PPSscore in distinct anti-PD-L1 clinical response groups. (D) Survival analyses for low and high PPSscore patient groups in the anti-PD1 immunotherapy cohort using Kaplan-Meier curves. (E) The percent weight of patients with clinical response to PD-1 blockade immunotherapy in low or high PPSscore groups. (F) The correlation of PPSscore with clinical response to anti-PD-1 immunotherapy. Pt, patients. PD, green; PR, blue; CR, orange. (G) The distribution of PPSscore in distinct anti-PD-1 clinical response groups. (H) Differences in stroma-activated pathways between high and low PPSscore groups in anti-PD-L1 immunotherapy cohort. The upper and lower ends of the boxes represented the interquartile range of values. The lines in the boxes represented the median value. The asterisks represented the statistical P value (***P < 0.001). (I) Survival analyses for patients receiving anti-PD-L1 immunotherapy classified by both PPSscore and neoantigen burden using Kaplan-Meier curves.

Similar articles

Cited by

References

    1. Hughes LD, Wang Y, Meli AP, Rothlin CV, Ghosh S. Decoding Cell Death: From a Veritable Library of Babel to Vade Mecum? Annu Rev Immunol. 2021; 39:791–817. 10.1146/annurev-immunol-102819-072601 - DOI - PubMed
    1. Miao EA, Rajan JV, Aderem A. Caspase-1-induced pyroptotic cell death. Immunol Rev. 2011; 243:206–14. 10.1111/j.1600-065X.2011.01044.x - DOI - PMC - PubMed
    1. Bergsbaken T, Fink SL, Cookson BT. Pyroptosis: host cell death and inflammation. Nat Rev Microbiol. 2009; 7:99–109. 10.1038/nrmicro2070 - DOI - PMC - PubMed
    1. Tan Y, Chen Q, Li X, Zeng Z, Xiong W, Li G, Li X, Yang J, Xiang B, Yi M. Pyroptosis: a new paradigm of cell death for fighting against cancer. J Exp Clin Cancer Res. 2021; 40:153. 10.1186/s13046-021-01959-x - DOI - PMC - PubMed
    1. Liu X, Zhang Z, Ruan J, Pan Y, Magupalli VG, Wu H, Lieberman J. Inflammasome-activated gasdermin D causes pyroptosis by forming membrane pores. Nature. 2016; 535:153–8. 10.1038/nature18629 - DOI - PMC - PubMed

Publication types

Substances

LinkOut - more resources