. 2022 Nov 3;82(21):4176-4188.e8.
doi: 10.1016/j.molcel.2022.09.009. Epub 2022 Sep 23.

Stress-triggered hematopoietic stem cell proliferation relies on PrimPol-mediated repriming

Affiliations

Stress-triggered hematopoietic stem cell proliferation relies on PrimPol-mediated repriming

Kurt Jacobs et al. Mol Cell. .

Abstract

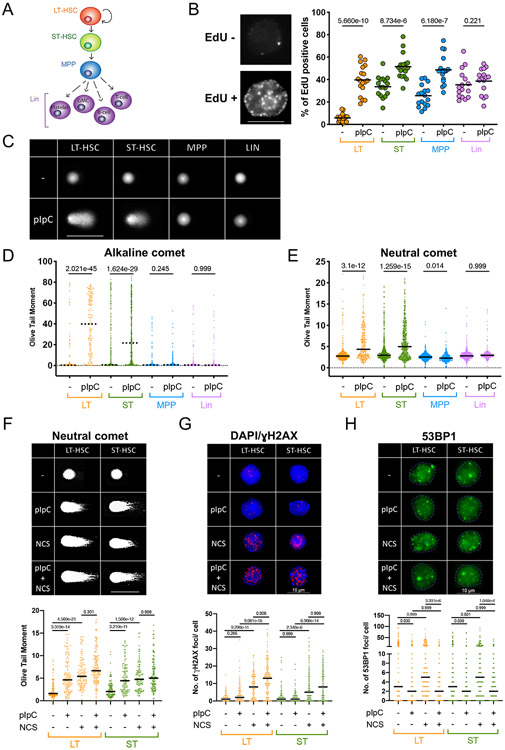
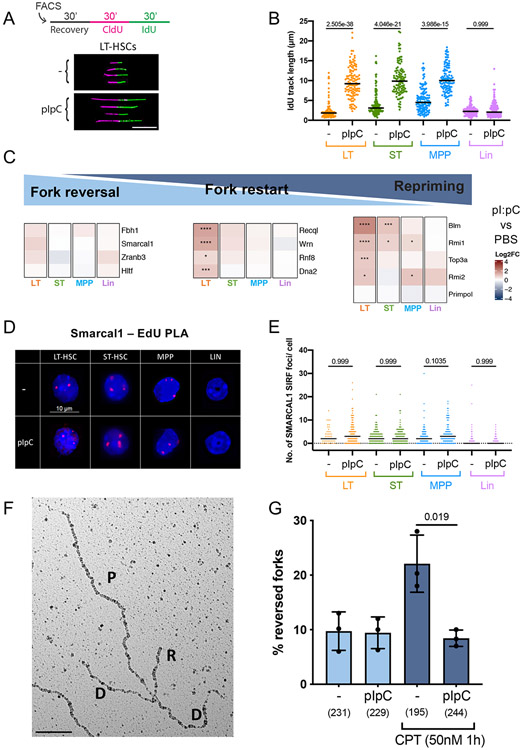
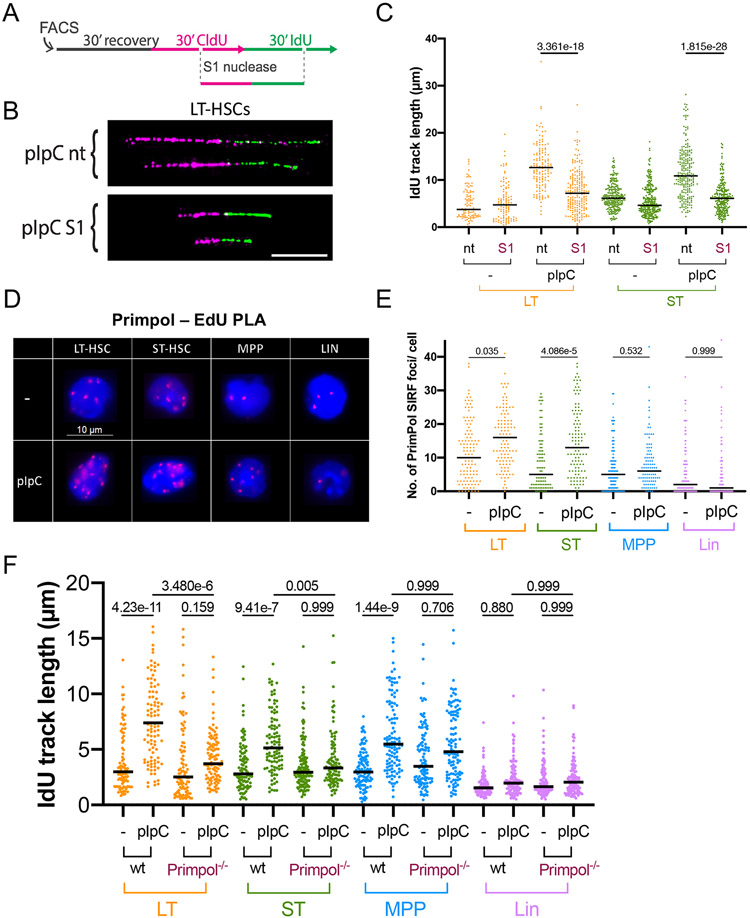
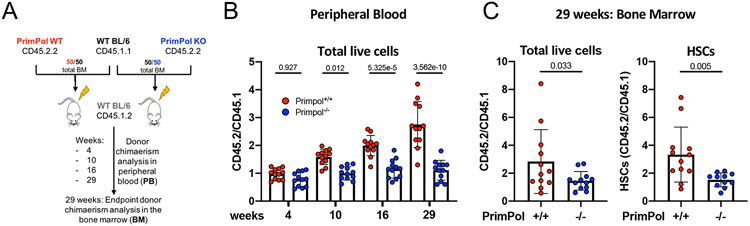
Stem cell division is linked to tumorigenesis by yet-elusive mechanisms. The hematopoietic system reacts to stress by triggering hematopoietic stem and progenitor cell (HSPC) proliferation, which can be accompanied by chromosomal breakage in activated hematopoietic stem cells (HSCs). However, whether these lesions persist in their downstream progeny and induce a canonical DNA damage response (DDR) remains unclear. Inducing HSPC proliferation by simulated viral infection, we report that the associated DNA damage is restricted to HSCs and that proliferating HSCs rewire their DDR upon endogenous and clastogen-induced damage. Combining transcriptomics, single-cell and single-molecule assays on murine bone marrow cells, we found accelerated fork progression in stimulated HSPCs, reflecting engagement of PrimPol-dependent repriming, at the expense of replication fork reversal. Ultimately, competitive bone marrow transplantation revealed the requirement of PrimPol for efficient HSC amplification and bone marrow reconstitution. Hence, fine-tuning replication fork plasticity is essential to support stem cell functionality upon proliferation stimuli.

Keywords: DNA damage response; DNA replication; Primpol; bone marrow reconstitution; hematopoietic stem cells; induced proliferation; replication fork plasticity; repriming; stem cell division.


Conflict of interest statement

Declaration of interests The authors declare no competing interests.

Figures

Figure 1.
Figure 1.. Activated HSCs specifically accumulate DNA damage and display a non-canonical DNA damage response.
A Schematic lineage tree of the hematopoietic stem-, progenitor and differentiated cell types used. Long-term (LT), short-term (ST), multipotent progenitor (MPP/MPP4), granulocyte/macrophage (GM). B Representative staining of an EdU-positive and -negative cell (left, scalebar = 8μm) and EdU positive cells in percent (right) as quantified by QIBC, 48h after injection of pI:pC compared to untreated (−). To measure replication status in vivo, EdU was injected 45 min before sacrifice. Medians of 18 experiments are plotted as dots. Lines show averages. C Representative images of an alkaline comet experiment conducted on freshly isolated subpopulations from untreated (upper row) and pI:pC-treated (lower row) mice. Scalebar = 100μm D Olive tail moment (OTM) values of a representative alkaline comet assay, conducted as in C. A minimum of 100 cells was scored per sample. Dotted line marks the median. See Figure S2A for compiled repetitions. E OTM of a representative neutral comet assay, 48h after injection of pI:pC compared to untreated (−) conditions. A minimum of 100 cells was scored per sample. Black line marks the median. See S2B for compiled repetitions. F Representative images and OTM of a neutral comet experiment. Scalebar = 125μm. G Representative images and foci counts of a γH2AX immunofluorescence staining; DAPI is displayed to identify γH2AX-negative cells. Scalebar = 10μm. H Representative images and foci counts of a 53BP1 immunofluorescence staining. Scalebar = 10μm. F-H, LT- and ST-HSCs were isolated 48h after pI:pC injection and optionally subjected to Neocarzinostatin (NCS, 1h 5μg/ml), prior to comet/IF analysis. A minimum of 100 cells per sample was scored. Black line marks the median. Comet and IF experiments were performed in parallel on the same batch of freshly isolated and treated HSCs. See S3A-C, F for compiled repetitions. B Welch’s t-test, D-H Kruskal-Wallis test. Indicated comparisons show numerical p-values. See STAR methods for the number of animals per group.
Figure 2.
Figure 2.. Upon stress-induced proliferation, HSPCs display accelerated fork progression and counteract fork reversal.
A Schematic overview (top) and compiled image of cropped, representative DNA fiber tracks on black background (bottom) of the DNA fiber spreading procedure applied to LT-HSCs from unstimulated (−) or pI:pC-treated mice. Freshly isolated cell populations were allowed to recover for 30 mins before nucleotide analogue-labelling as depicted. CldU/IdU-tracks were immunostained and displayed in magenta and green, respectively. IdU track length of double-labelled tracks (ongoing forks) were measured to assess replication fork speed. Scalebar = 10μm. B IdU track length of one biological replicate, 48h after optional pI:pC treatment. A minimum of 100 fibers was scored per sample. Black line marks the median. See S5B for compiled repetitions. C Tile map of the log2 fold change and significance of pI:pC versus PBS for each cell line as calculated from differential expression using DESeq2. Colour denotes log2 fold change where red (positive) is higher in pI:pC and blue (negative) is higher in PBS. Asterisks denote FDR-corrected p-values: **** = p<0.0001; *** = p<0.001; and; * = p<0.05. Genes were clustered by log2 fold change using Ward's hierarchical clustering. D Representative images of SMARCAL1 SIRF foci (red) over DAPI staining. Scalebar = 10μm. E Foci count of a representative SMARCAL1 SIRF replicate, 48h after optional injection of pI:pC. Black bar indicates median. See S5I for compiled repetitions. F Representative electron microscopy image of a reversed replication fork obtained from freshly isolated mouse bone marrow. P, parental strand; D, daughter strand; R, regressed arm. G Frequency of reversed forks in total bone marrow cells isolated from mice, optionally treated in vivo with pI:pC and ex vivo with camptothecin (CPT, 50nM, 1h), prior to psoralen-crosslinking followed by DNA extraction. Data from 3 biological replicates are depicted as mean ± SEM. Brackets = total number of replication intermediates analysed per sample. B,E Kruskal-Wallis test, G Welch’s t-test. Indicated comparisons show numerical p-values. See STAR methods for the number of animals per experimental group.
Figure 3.
Figure 3.. Proliferating HSCs display fast, discontinuous DNA synthesis, mediated by Primpol.
A Schematic display of the DNA fiber spreading assay coupled with ssDNA-specific S1 nuclease treatment for the detection of ssDNA gaps/ discontinuities on ongoing forks. Isolated cells were allowed to recover 30 mins and then incubated with nucleotide-analogues, followed by optional treatment with the S1 nuclease. CldU/IdU-tracks were immunostained and displayed in magenta and green, respectively; IdU track length of double-labelled tracks were measured to assess replication fork speed. B Compiled image of cropped, representative DNA fiber tracks on black background from unstimulated (−) or pI:pC-treated LT-HSCs. White scalebar = 10μm. C Representative biological replicate of IdU track length in unstimulated (−) cells or 48h after pI:pC treatment with optional S1 nuclease digestion. Black bars represent medians. A minimum of 100 tracks was measured per sample. See S6A for compiled repetitions. D Representative images of PrimPol SIRF foci (red) over DAPI staining. Scalebar = 10μm. E Foci counts of a representative PrimPol SIRF replicate, 48h after injection of pI:pC compared to untreated (−) conditions. Black bar indicates median. See S6E for compiled repetitions. F IdU track length of a biological replicate in unstimulated (−) cells or 48h after pI:pC treatment in wt or Primpol−/− mice. Black line marks the median. A minimum of 100 tracks per sample was measured. See S6F for compiled repetitions. C,E,F Kruskal-Wallis test. Indicated comparisons show numerical p-values. See STAR methods for the number of animals per experimental group.
Figure 4.
Figure 4.. Efficient bone marrow reconstitution upon stress requires Primpol.
A Schematic of the competitive transplantation assay performed to compare bone marrow reconstitution ability of freshly isolated PrimPol wt versus Primpol−/− donor cells in lethally irradiated recipient mice. Two donor pools with varying surface marker isoforms - CD45.1.1 WT BL/6 cells and CD45.2.2 either PrimPol wt or Primpol−/− cells - were prepared to each make up for 50% of the injected donor material. To assess donor chimaerism, ratios of peripheral blood (PB) cells carrying the respective CD45 isoforms were determined at 4, 10, 16 and 29 weeks post transplantation. At 29 weeks, mice were sacrificed, femurs harvested, and donor chimaerism assessed as above for total bone marrow or hematopoietic stem cells. B Donor chimaerism assessed as isoform ratios of total live PB cells at the indicated time post transplantation. Ratios from 12 recipient mice per group are plotted as dots. C Donor chimaerism displayed as CD45 isoform ratios of total live bone marrow cells (left) or HSCs (right) 29 weeks after transplantation. Ratios from 12 (+/+) and 11 (−/−) recipient mice per group are plotted as dots. B One-way ANOVA. C Welch’s t-test. Indicated comparisons show numerical p-values. See also Figure S8.

Similar articles

Cited by

References

    1. Adams PD, Jasper H, and Rudolph KL (2015). Aging-Induced Stem Cell Mutations as Drivers for Disease and Cancer. Cell Stem Cell 16, 601–612. 10.1016/j.stem.2015.05.002. - DOI - PMC - PubMed
    1. Adolfsson J, Borge OJ, Bryder D, Theilgaard-Mönch K, Åstrand-Grundström I, Sitnicka E, Sasaki Y, and Jacobsen SEW (2001). Upregulation of Flt3 Expression within the Bone Marrow Lin−Scal+c-kit+ Stem Cell Compartment Is Accompanied by Loss of Self-Renewal Capacity. Immunity 15, 659–669. 10.1016/s1074-7613(01)00220-5. - DOI - PubMed
    1. Ahuja AK, Jodkowska K, Teloni F, Bizard AH, Zellweger R, Herrador R, Ortega S, Hickson ID, Altmeyer M, Mendez J, et al. (2016). A short G1 phase imposes constitutive replication stress and fork remodelling in mouse embryonic stem cells. Nature Communications 7, 10660. 10.1038/ncomms10660. - DOI - PMC - PubMed
    1. Aladjem MI, Spike BT, Rodewald LW, Hope TJ, Klemm M, Jaenisch R, and Wahl GM (1998). ES cells do not activate p53-dependent stress responses and undergo p53-independent apoptosis in response to DNA damage. Curr Biol 8, 145–155. 10.1016/s0960-9822(98)70061-2. - DOI - PubMed
    1. Bai G, Kermi C, Stoy H, Schiltz CJ, Bacal J, Zaino AM, Hadden MK, Eichman BF, Lopes M, and Cimprich KA (2020). HLTF Promotes Fork Reversal, Limiting Replication Stress Resistance and Preventing Multiple Mechanisms of Unrestrained DNA Synthesis. Mol Cell 10.1016/j.molcel.2020.04.031. - DOI - PMC - PubMed

Publication types