. 2022 Dec;383(3):208-216.
doi: 10.1124/jpet.122.001147. Epub 2022 Sep 24.

Effects of a Novel Beta Lactam Compound, MC-100093, on the Expression of Glutamate Transporters/Receptors and Ethanol Drinking Behavior of Alcohol-Preferring Rats

Affiliations

Effects of a Novel Beta Lactam Compound, MC-100093, on the Expression of Glutamate Transporters/Receptors and Ethanol Drinking Behavior of Alcohol-Preferring Rats

Hasan Alhaddad et al. J Pharmacol Exp Ther. 2022 Dec.

Abstract

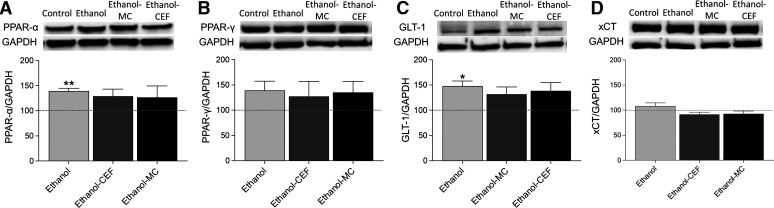
Chronic ethanol exposure affects the glutamatergic system in several brain reward regions including the nucleus accumbens (NAc). Our laboratory has shown that chronic exposure to ethanol reduced the expression of glutamate transporter 1 (GLT-1) and cystine/glutamate exchanger (xCT) and, as a result, increased extracellular glutamate concentrations in the NAc of alcohol-preferring (P) rats. Moreover, previous studies from our laboratory reported that chronic ethanol intake altered the expression of certain metabotropic glutamate receptors in the brain. In addition to central effects, chronic ethanol consumption induced liver injury, which is associated with steatohepatitis. In the present study, we investigated the effects of chronic ethanol consumption in the brain and liver. Male P rats had access to a free choice of ethanol and water bottles for five weeks. Chronic ethanol consumption reduced GLT-1 and xCT expression in the NAc shell but not in the NAc core. Furthermore, chronic ethanol consumption increased fat droplet content as well as peroxisome proliferator-activated receptor alpha (PPAR-α) and GLT-1 expression in the liver. Importantly, treatment with the novel beta-lactam compound, MC-100093, reduced ethanol drinking behavior and normalized the levels of GLT-1 and xCT expression in the NAc shell as well as normalized GLT-1 and PPAR-α expression in the liver. In addition, MC-100093 attenuated ethanol-induced increases in fat droplet content in the liver. These findings suggest that MC-100093 may be a potential lead compound to attenuate ethanol-induced dysfunction in the glutamatergic system and liver injury. SIGNIFICANCE STATEMENT: This study identified a novel beta-lactam, MC-100093, that has demonstrated upregulatory effects on GLT-1. MC-100093 reduced ethanol drinking behavior and normalized levels of GLT-1 and xCT expression in the NAc shell as well as normalized GLT-1 and PPAR-α expression in the liver. In addition, MC-100093 attenuated ethanol-induced increases in fat droplet content in the liver.


Figures

Fig. 1.
Fig. 1.
Chemical structure of GLT-1 uptake modulators: MS-153, CEF, and MC-100093. MC-100093 synthesized by structural modification of the cephalosporin ring system and side chains of CEF.
Fig. 2.
Fig. 2.
Effects of five consecutive days of MC-100093 (50 mg/kg, i.p.) or CEF (200 mg/kg, i.p.) treatment on (A) ethanol consumption (g/kg of average body weight/24 h), (B) water intake (mL/day), and (C) body weight (g). Statistical analyses revealed that treatment with MC-100093 or CEF significantly reduced ethanol consumption from day 2 through day 5, with a concomitant significant increase in water consumption from day 2 through day 5 by the ethanol–CEF group and on day 5 by the ethanol–MC-100093 group as compared with the ethanol–saline group. However, ethanol consumption was significantly lower, and water consumption was significantly higher in the ethanol–CEF group as compared with the ethanol–MC-100093 group on day 2 through day 5. There were no significant effects of MC-100093 or CEF treatment on body weight. The values are expressed as mean ± S.E.M. (n = 8/group for the ethanol–saline group and n = 9/group for ethanol–MC-100093 and ethanol–CEF groups). *P < 0.05; **P < 0.01; #P < 0.0001.
Fig. 3.
Fig. 3.
Effects of five consecutive days of MC-100093 or CEF treatment on (A) GLT-1 expression in the NAc core. Upper panel: Representative immunoblot of GLT-1 and β-tubulin in the NAc core. Lower panel: Quantitative analysis revealed a nonsignificant difference in GLT-1 expression between water control, ethanol, ethanol–MC-100093, and ethanol–CEF groups in the NAc core. (B) GLT-1 expression in the NAc shell. Upper panel: Representative immunoblot of GLT-1 and β-tubulin in the NAc shell. Lower panel: Quantitative analysis revealed a significant downregulation of GLT-1 expression in the ethanol group compared to the water control group. However, the ethanol–MC-100093 and ethanol–CEF groups showed significantly higher levels of GLT-1 expression compared with the ethanol group, with no significant difference between the water control, ethanol–MC-100093, and ethanol–CEF groups in the NAc shell. (C) xCT expression in NAc core. Upper panel: Representative immunoblot of xCT and β-tubulin in the NAc core. Lower panel: Quantitative analysis revealed a nonsignificant difference in xCT expression between the water control, ethanol, ethanol–MC-100093, and ethanol–CEF groups in the NAc core. (D) xCT expression in the NAc shell. Upper panel: Representative immunoblot of xCT and β-tubulin in the NAc shell. Lower panel: Quantitative analysis revealed a significant downregulation of xCT expression in the ethanol group compared to the water control group. However, the ethanol–MC-100093 and ethanol–CEF groups showed significantly higher level of xCT compared to the ethanol group, with no significant difference between the water control, ethanol–MC-100093, and ethanol–CEF groups in the NAc shell. Control group data were represented as 100% (i.e., relative to water control). The values are expressed as mean ± S.E.M (n = 8/group). *P < 0.05; **P < 0.01.
Fig. 4.
Fig. 4.
Effects of five consecutive days of MC-100093 or CEF treatment on (A) protein expression of mGluR1 in the NAc core. Upper panel: Representative immunoblot of mGluR1 and β-tubulin in the NAc core. Lower panel: Quantitative analysis revealed a nonsignificant difference in mGluR1 expression between the water control, ethanol, ethanol–MC-100093, and ethanol–CEF groups in the NAc core. (B) mGluR1 expression in the NAc shell. Upper panel: Representative immunoblot of mGluR1 and β-tubulin in the NAc shell. Lower panel: Quantitative analysis revealed non-significant differences in mGluR1 expression between the water control, ethanol, ethanol–MC-100093, and ethanol–CEF groups in the NAc shell. (C) mGluR5 expression in the NAc core. Upper panel: Representative immunoblot of mGluR5 and β-tubulin in the NAc core. Lower panel: Quantitative analysis revealed a nonsignificant difference in mGluR5 expression between the water control, ethanol, ethanol–MC-100093, and ethanol–CEF groups in the NAc core. (D) mGluR5 expression in NAc shell. Upper panel: Representative immunoblot of mGluR5 and β-tubulin in the NAc shell. Lower panel: Quantitative analysis revealed a significant downregulation in mGluR5 expression in the ethanol group compared to the water control group in the NAc shell. However, there was no significant difference in mGluR5 expression in the ethanol–MC-100093 and ethanol–CEF groups compared to the water control group. (E) PPAR-α expression in the NAc core. Upper panel: Representative immunoblot of PPAR-α and β-tubulin in the NAc core. Lower panel: Quantitative analysis revealed nonsignificant differences in PPAR-α expression between the water control, ethanol, ethanol–MC-100093, and ethanol–CEF groups in the NAc core. (F) PPAR-α expression in the NAc shell. Upper panel: Representative immunoblot of PPAR-α and β-tubulin in the NAc shell. Lower panel: Quantitative analysis revealed nonsignificant differences in PPAR-α expression between the water control, ethanol, ethanol–MC-100093, and ethanol–CEF groups in the NAc shell. Control group data were represented as 100% (i.e., relative to water control). The values are expressed as mean ± S.E.M. (n = 7–8/group). *P < 0.05; **P < 0.01.
Fig. 5.
Fig. 5.
Fat droplets in Oil Red O-stained liver sections. (A) Quantitative analysis revealed a significant increase in liver fat content (high fat deposition) in the ethanol group compared with the water control group. There was no significant difference in fat content between the water control, ethanol–MC-100093, and ethanol–CEF groups. (B) Representative Oil Red O-stained liver sections of the water control, ethanol, ethanol–MC, and ethanol–CEF groups. Higher fat content was observed in liver sections of the ethanol group as compared to the water control, ethanol–MC-100093, or ethanol–CEF groups. The values are expressed as mean ± S.E.M. (n = 4-5/group). *P < 0.05.
Fig. 6.
Fig. 6.
Effects of five consecutive days of MC-100093 or CEF injections on (A) PPAR-α expression in the liver. Upper panel: Representative immunoblot of PPAR-α and glyceraldehyde-3-phosphate dehydrogenase (GAPDH) in the liver. Lower panel: Quantitative analysis revealed a significant increase in PPAR-α expression in the ethanol group compared with control the water control group in the liver. However, there was no significant change in PPAR-α expression in the ethanol–MC-100093 and ethanol–CEF groups compared to the water control group. (B) PPAR-γ expression in the liver. Upper panel: Representative immunoblot of PPAR-γ and GAPDH in the liver. Lower panel: Quantitative analysis revealed no significant difference in PPAR-γ expression between all groups. (C) GLT-1 expression in the liver. Upper panel: Representative immunoblot of GLT-1 and GAPDH in the liver. Lower panel: Quantitative analysis revealed a significant increase in GLT-1 expression in the ethanol group compared with the water control group in the liver. However, there was no significant change in GLT-1 expression in the ethanol–MC-100093 and ethanol–CEF groups compared to the water control group. (D) xCT expression in the liver. Upper panel: Representative immunoblot of xCT and GAPDH in the liver. Lower panel: Quantitative analysis revealed no significant difference in xCT expression between all groups. Control group data were represented as 100% (i.e., relative to water control). The values are expressed as mean ± S.E.M. (n = 8/group). *P < 0.05; **P < 0.01.

Similar articles

Cited by

References

    1. Abou-Gharbia M, Blass B, Childers W, Ramanjulu M, Melenski E (2017) Glutamate transporter-1 (GLT-1): a potential therapeutic target for the treatment of central nervous system diseases and disorders. Drugs Fut 42:489–509.
    1. Alasmari F, Alhaddad H, Wong W, Bell RL, Sari Y (2020) Ampicillin/sulbactam treatment modulates NMDA receptor NR2B subunit and attenuates neuroinflammation and alcohol intake in male high alcohol drinking rats. Biomolecules 10:1030. - PMC - PubMed
    1. Alhaddad H, Alasmari F, Alhamadani B, Wong W, Bell RL, Sari Y (2020) Effects of chronic ethanol consumption on the expression of GLT-1 and neuroplasticity-related proteins in the nucleus accumbens of alcohol-preferring rats. Brain Res Bull 165:272–280. - PMC - PubMed
    1. Alhaddad H, Das SC, Sari YJP. (2014) Effects of ceftriaxone on ethanol intake: a possible role for xCT and GLT-1 isoforms modulation of glutamate levels in P rats. Psychopharmacology (Berl) 231:4049–4057. - PMC - PubMed
    1. Alhaddad H, Gordon DM, Bell RL, Jarvis EE, Kipp ZA, Hinds TD Jr, Sari Y (2020) Chronic ethanol consumption alters glucocorticoid receptor isoform expression in stress neurocircuits and mesocorticolimbic brain regions of alcohol-preferring rats. Neuroscience 437:107–116. - PMC - PubMed

Publication types

LinkOut - more resources