

Evaluating sensitivity to classification uncertainty in latent subgroup effect analyses
- PMID: 36153493
- PMCID: PMC9508766
- DOI: 10.1186/s12874-022-01720-8
Evaluating sensitivity to classification uncertainty in latent subgroup effect analyses
Abstract
Background: Increasing attention is being given to assessing treatment effect heterogeneity among individuals belonging to qualitatively different latent subgroups. Inference routinely proceeds by first partitioning the individuals into subgroups, then estimating the subgroup-specific average treatment effects. However, because the subgroups are only latently associated with the observed variables, the actual individual subgroup memberships are rarely known with certainty in practice and thus have to be imputed. Ignoring the uncertainty in the imputed memberships precludes misclassification errors, potentially leading to biased results and incorrect conclusions.
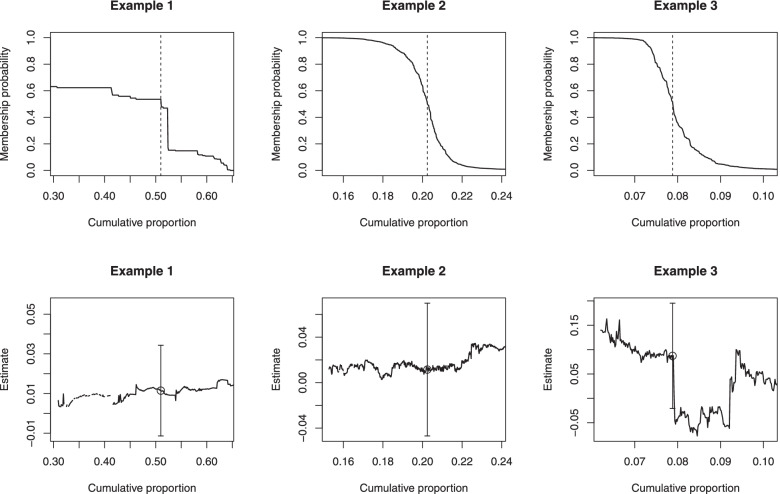
Methods: We propose a strategy for assessing the sensitivity of inference to classification uncertainty when using such classify-analyze approaches for subgroup effect analyses. We exploit each individual's typically nonzero predictive or posterior subgroup membership probabilities to gauge the stability of the resultant subgroup-specific average causal effects estimates over different, carefully selected subsets of the individuals. Because the membership probabilities are subject to sampling variability, we propose Monte Carlo confidence intervals that explicitly acknowledge the imprecision in the estimated subgroup memberships via perturbations using a parametric bootstrap. The proposal is widely applicable and avoids stringent causal or structural assumptions that existing bias-adjustment or bias-correction methods rely on.
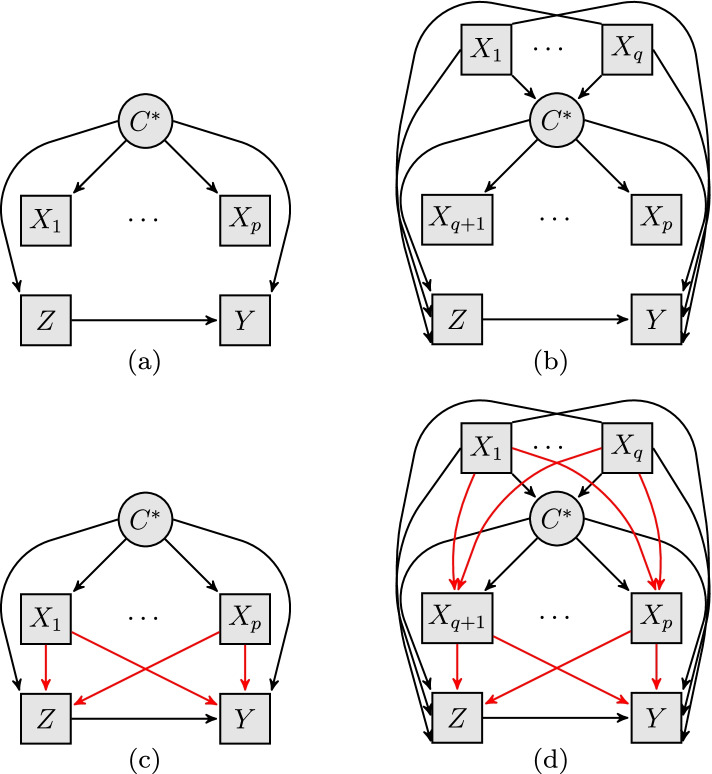
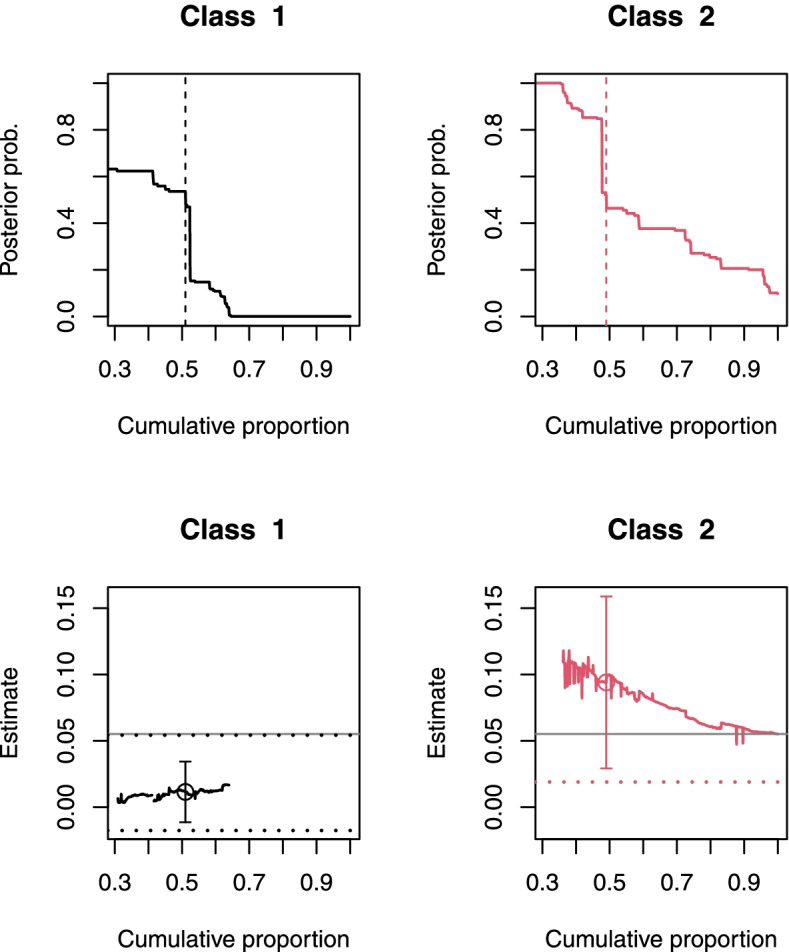
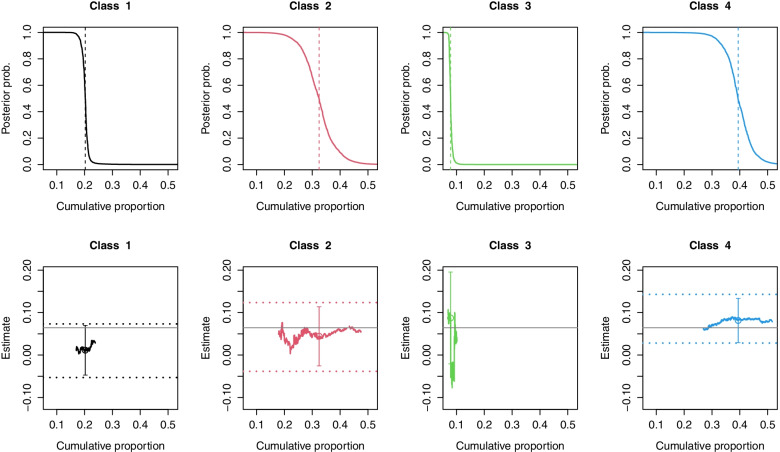
Results: Using two different publicly available real-world datasets, we illustrate how the proposed strategy supplements existing latent subgroup effect analyses to shed light on the potential impact of classification uncertainty on inference. First, individuals are partitioned into latent subgroups based on their medical and health history. Then within each fixed latent subgroup, the average treatment effect is assessed using an augmented inverse propensity score weighted estimator. Finally, utilizing the proposed sensitivity analysis reveals different subgroup-specific effects that are mostly insensitive to potential misclassification.
Conclusions: Our proposed sensitivity analysis is straightforward to implement, provides both graphical and numerical summaries, and readily permits assessing the sensitivity of any machine learning-based causal effect estimator to classification uncertainty. We recommend making such sensitivity analyses more routine in latent subgroup effect analyses.
Keywords: Causal inference; Finite mixture models; Latent class analysis; Parametric bootstrap; Perturbed confidence interval; Sensitivity analysis; Subgroup average treatment effect (ATE).
© 2022. The Author(s).
Conflict of interest statement
The authors declare that they have no competing interests.
Figures
References
-
- Ferreira JP, Duarte K, McMurray JJV, Pitt B, van Veldhuisen DJ, Vincent J, Ahmad T, Tromp J, Rossignol P, Zannad F. Data-driven approach to identify subgroups of heart failure with reduced ejection fraction patients with different prognoses and aldosterone antagonist response patterns. Circ Heart Fail. 2018;11(7):004926. - PubMed
-
- Kim HJ, Lu B, Nehus EJ, Kim M-O. Estimating heterogeneous treatment effects for latent subgroups in observational studies. Stat Med. 2019;38(3):339–53. - PubMed
-
- de Ruigh EL, Bouwmeester S, Popma A, Vermeiren RRJM, van Domburgh L, Jansen LMC. Using the biopsychosocial model for identifying subgroups of detained juveniles at different risk of re-offending in practice: a latent class regression analysis approach. Child Adolesc Psychiatry Ment Health. 2021;15(1):33. - PMC - PubMed
Publication types
MeSH terms
LinkOut - more resources
Full Text Sources
Research Materials
