

An integrative bioinformatics investigation and experimental validation of critically involved genes in high-grade gliomas
- PMID: 36153549
- PMCID: PMC9508723
- DOI: 10.1186/s13000-022-01253-0
An integrative bioinformatics investigation and experimental validation of critically involved genes in high-grade gliomas
Abstract
Background: Lack of knowledge around underlying mechanisms of gliomas mandates intense research efforts to improve the disease outcomes. Identification of high-grade gliomas pathogenesis which is known for poor prognosis and low survival is of particular importance. Distinguishing the differentially expressed genes is one of the core approaches to clarify the causative factors.
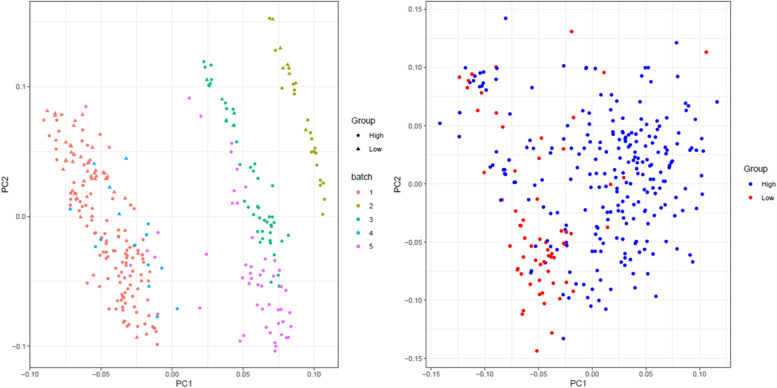
Methods: Microarray datasets of the treatment-naïve gliomas were provided from the Gene Expression Omnibus considering the similar platform and batch effect removal. Interacting recovery of the top differentially expressed genes was performed on the STRING and Cytoscape platforms. Kaplan-Meier analysis was piloted using RNA sequencing data and the survival rate of glioma patients was checked considering selected genes. To validate the bioinformatics results, the gene expression was elucidated by real-time RT-qPCR in a series of low and high-grade fresh tumor samples.
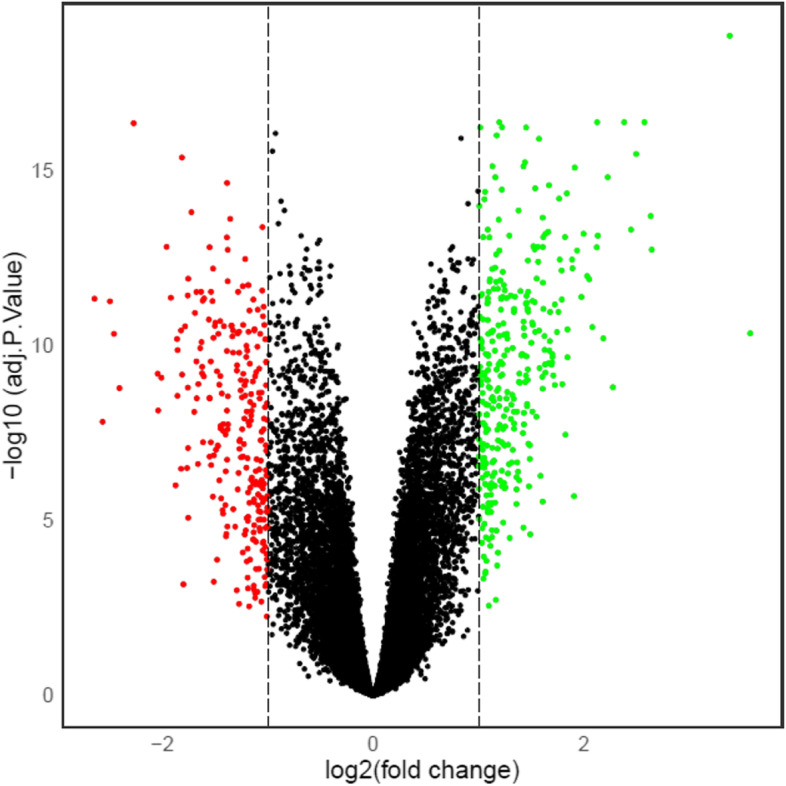
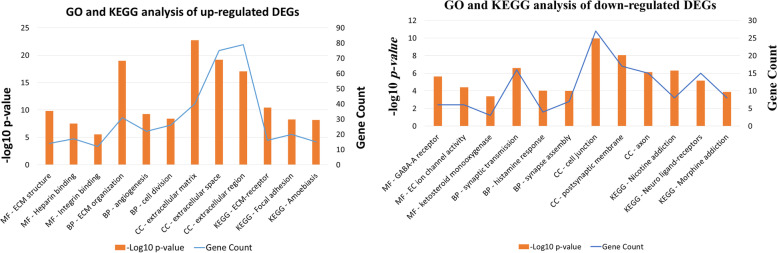
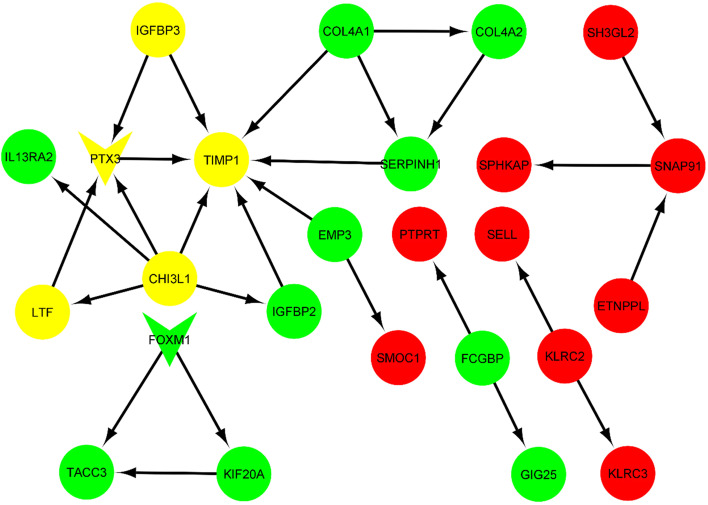
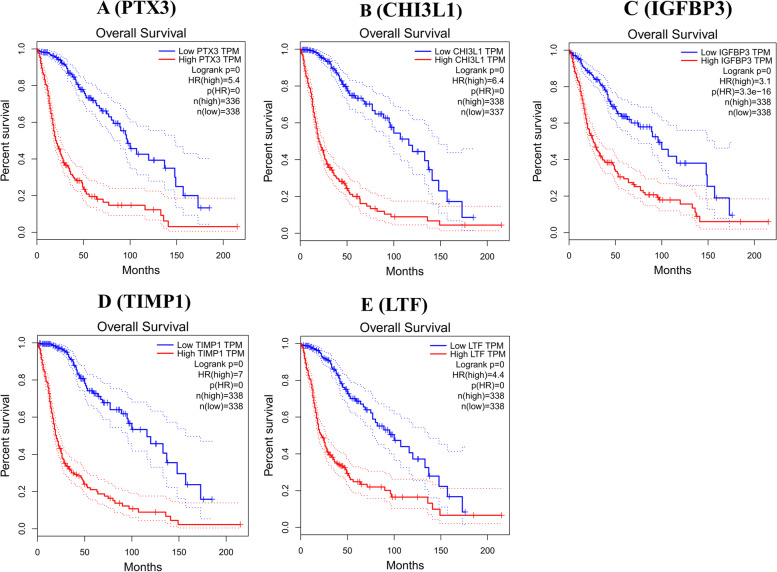
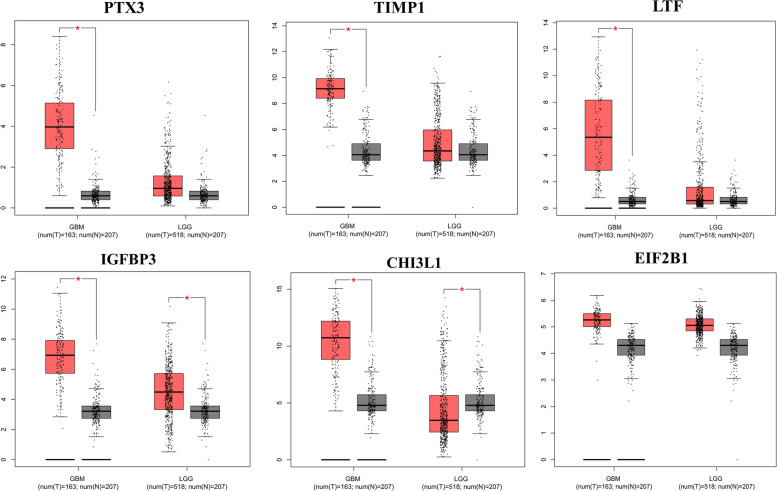
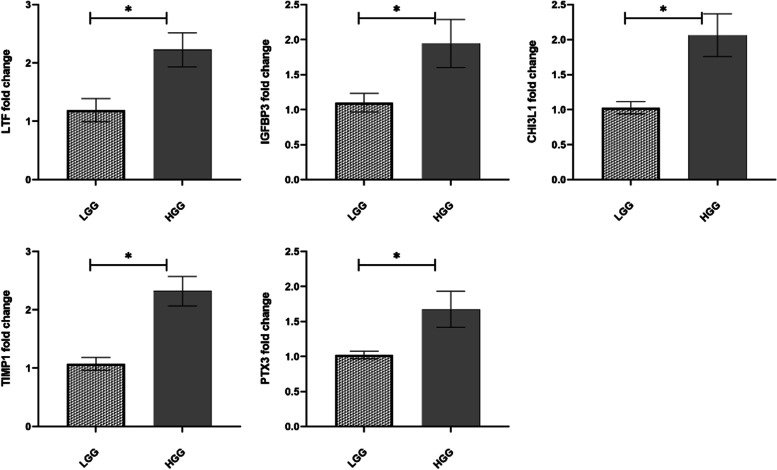
Results: We identified 323 up-regulated and 253 down-regulated genes. The top 20 network analysis indicated that PTX3, TIMP1, CHI3L1, LTF and IGFBP3 comprise a crucial role in gliomas progression. The survival was inversely linked to the levels of all selected genes. Further analysis of RNA sequencing data indicated a significant increase in all five genes in high-grade tumors. Among them, PTX3, TIMP1 and LTF did not show any change in low-grade versus controls. Real-time RT-qPCR confirmed the in-silico results and revealed significantly higher expression of selected genes in high-grade samples compared to low-grade.
Conclusions: Our results highlighted the role of PTX3 and TIMP1 which were previously considered in glioma tumorigenesis as well as LTF as a new potential biomarker.
Keywords: Adult glioma; Differentially expressed genes; GEO data; Integrated bioinformatics.
© 2022. The Author(s).
Conflict of interest statement
There are no competing interests declared by the authors.
Figures
References
-
- Louis DN, Perry A, Reifenberger G, von Deimling A, Figarella-Branger D, Cavenee WK, Ohgaki H, Wiestler OD, Kleihues P, Ellison DW. The 2016 World Health Organization classification of tumors of the central nervous system: a summary. Acta Neuropathol. 2016;131:803–820. doi: 10.1007/s00401-016-1545-1. - DOI - PubMed
-
- Alvarez MJ, Subramaniam PS, Tang LH, Grunn A, Aburi M, Rieckhof G, Komissarova EV, Hagan EA, Bodei L, Clemons PA, et al. A precision oncology approach to the pharmacological targeting of mechanistic dependencies in neuroendocrine tumors. Nat Genet. 2018;50:979–989. doi: 10.1038/s41588-018-0138-4. - DOI - PMC - PubMed
MeSH terms
Substances
LinkOut - more resources
Full Text Sources
Research Materials
Miscellaneous
