

Machine Learning Algorithms for understanding the determinants of under-five Mortality
- PMID: 36153553
- PMCID: PMC9509654
- DOI: 10.1186/s13040-022-00308-8
Machine Learning Algorithms for understanding the determinants of under-five Mortality
Abstract
Background: Under-five mortality is a matter of serious concern for child health as well as the social development of any country. The paper aimed to find the accuracy of machine learning models in predicting under-five mortality and identify the most significant factors associated with under-five mortality.
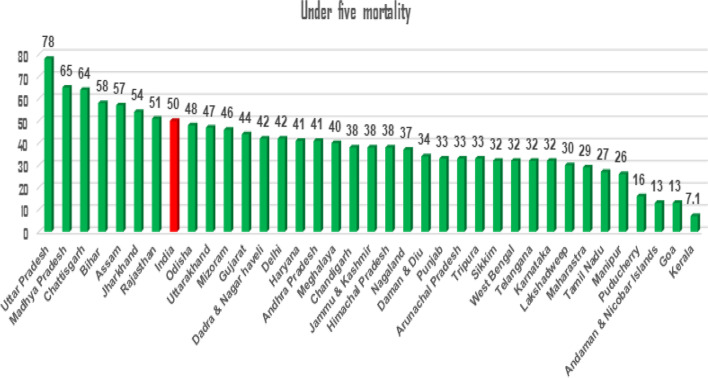
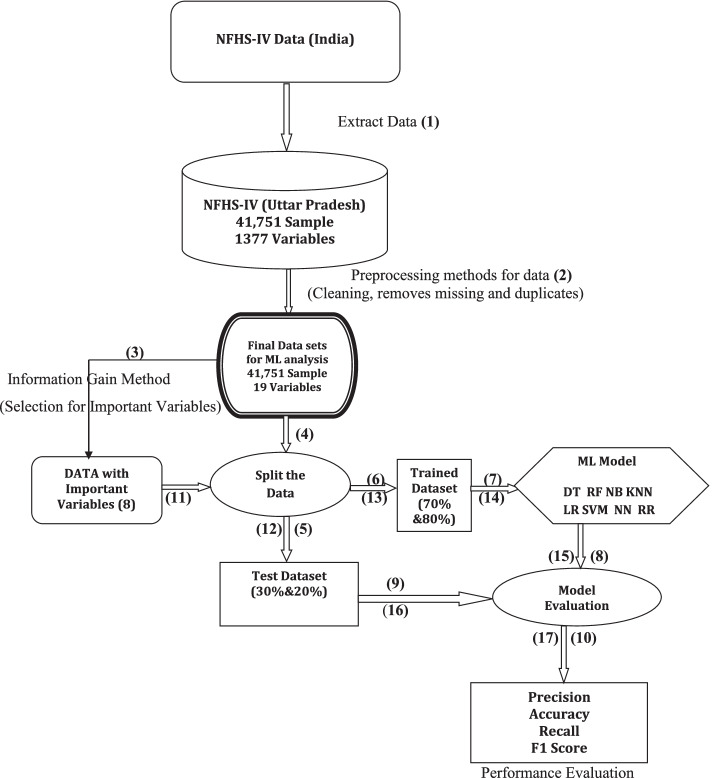
Method: The data was taken from the National Family Health Survey (NFHS-IV) of Uttar Pradesh. First, we used multivariate logistic regression due to its capability for predicting the important factors, then we used machine learning techniques such as decision tree, random forest, Naïve Bayes, K- nearest neighbor (KNN), logistic regression, support vector machine (SVM), neural network, and ridge classifier. Each model's accuracy was checked by a confusion matrix, accuracy, precision, recall, F1 score, Cohen's Kappa, and area under the receiver operating characteristics curve (AUROC). Information gain rank was used to find the important factors for under-five mortality. Data analysis was performed using, STATA-16.0, Python 3.3, and IBM SPSS Statistics for Windows, Version 27.0 software.
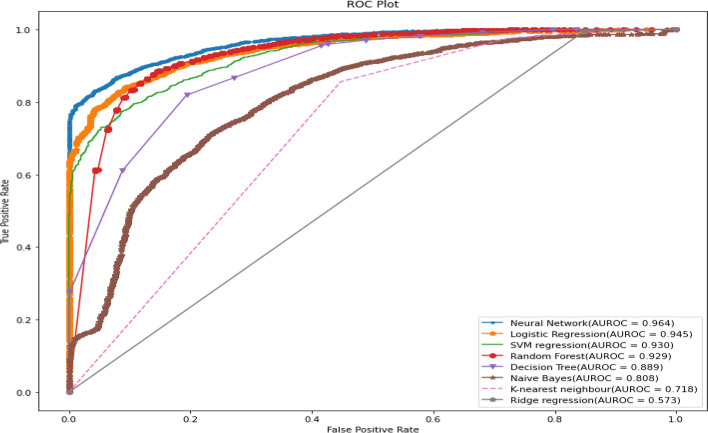
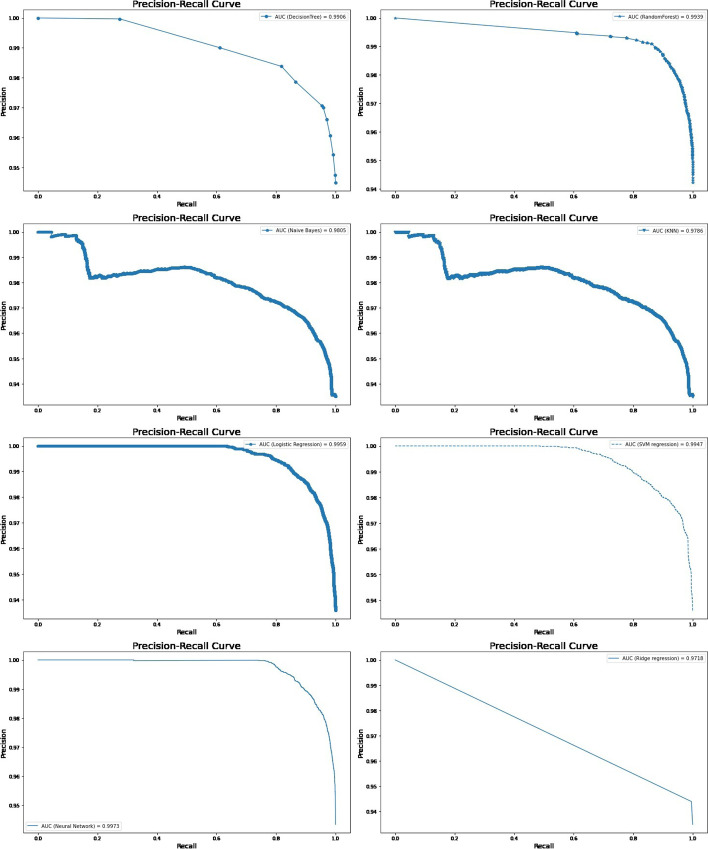
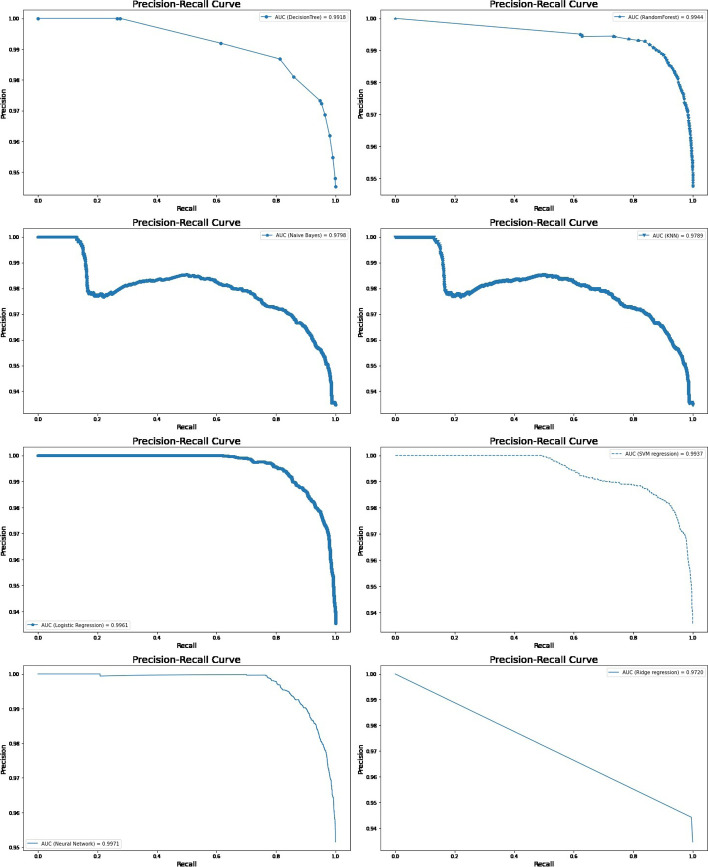
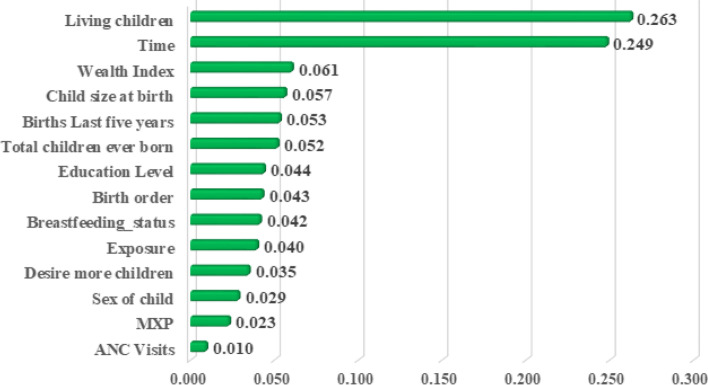
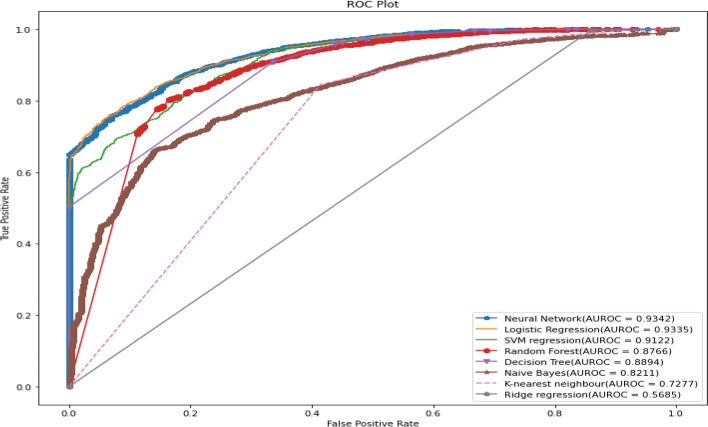
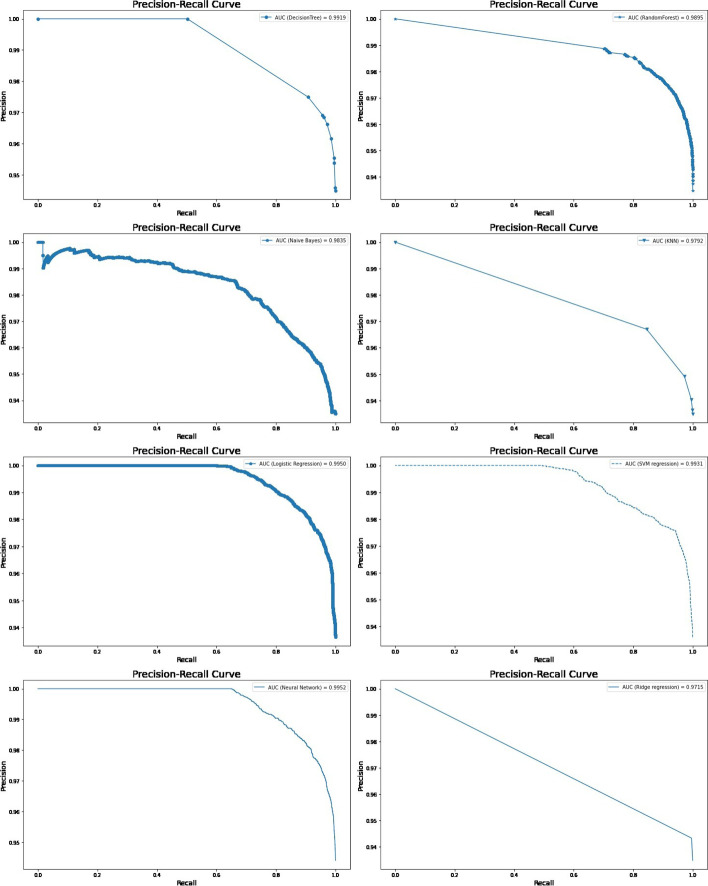
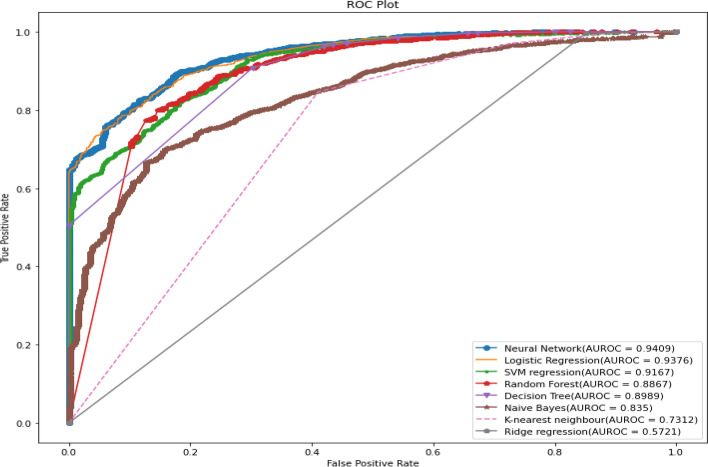
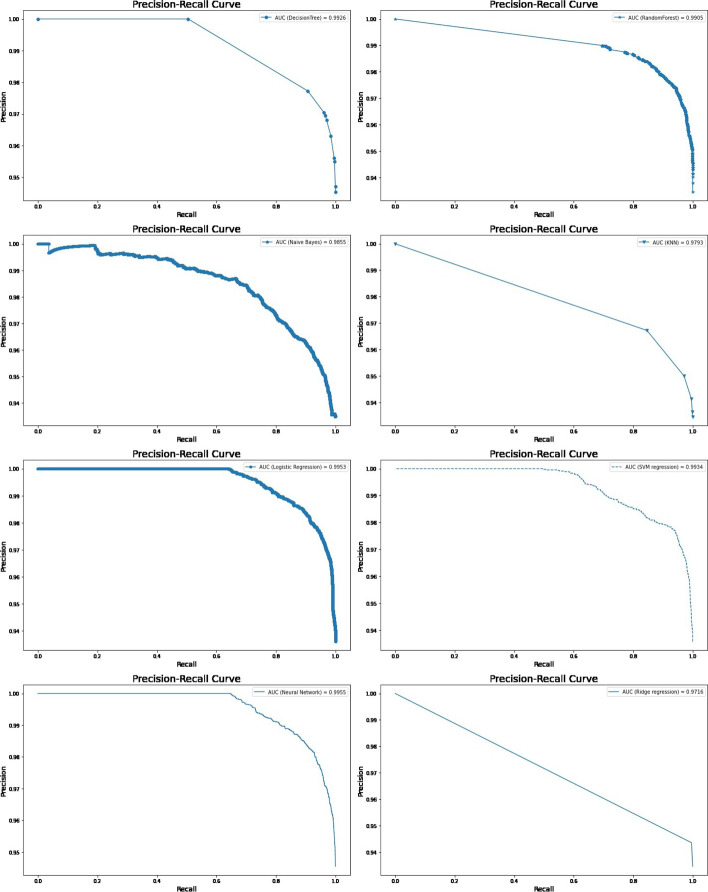
Result: By applying the machine learning models, results showed that the neural network model was the best predictive model for under-five mortality when compared with other predictive models, with model accuracy of (95.29% to 95.96%), recall (71.51% to 81.03%), precision (36.64% to 51.83%), F1 score (50.46% to 62.68%), Cohen's Kappa value (0.48 to 0.60), AUROC range (93.51% to 96.22%) and precision-recall curve range (99.52% to 99.73%). The neural network was the most efficient model, but logistic regression also shows well for predicting under-five mortality with accuracy (94% to 95%)., AUROC range (93.4% to 94.8%), and precision-recall curve (99.5% to 99.6%). The number of living children, survival time, wealth index, child size at birth, birth in the last five years, the total number of children ever born, mother's education level, and birth order were identified as important factors influencing under-five mortality.
Conclusion: The neural network model was a better predictive model compared to other machine learning models in predicting under-five mortality, but logistic regression analysis also shows good results. These models may be helpful for the analysis of high-dimensional data for health research.
Keywords: Accuracy; Machine learning; Neural Network; Random Forest; Under-five mortality.
© 2022. The Author(s).
Conflict of interest statement
The authors declared that they have no competing interests.
Figures

Similar articles
-
Identifying determinants of malnutrition in under-five children in Bangladesh: insights from the BDHS-2022 cross-sectional study.Sci Rep. 2025 Apr 24;15(1):14336. doi: 10.1038/s41598-025-99288-y. Sci Rep. 2025. PMID: 40274916 Free PMC article.
-
Application of machine learning methods for predicting infant mortality in Rwanda: analysis of Rwanda demographic health survey 2014-15 dataset.BMC Pregnancy Childbirth. 2022 May 4;22(1):388. doi: 10.1186/s12884-022-04699-8. BMC Pregnancy Childbirth. 2022. PMID: 35509018 Free PMC article.
-
Identifying determinants of under-5 mortality in Bangladesh: A machine learning approach with BDHS 2022 data.PLoS One. 2025 Jun 11;20(6):e0324825. doi: 10.1371/journal.pone.0324825. eCollection 2025. PLoS One. 2025. PMID: 40498759 Free PMC article.
-
Application of machine learning methods for predicting under-five mortality: analysis of Nigerian demographic health survey 2018 dataset.BMC Med Inform Decis Mak. 2024 Mar 25;24(1):86. doi: 10.1186/s12911-024-02476-5. BMC Med Inform Decis Mak. 2024. PMID: 38528495 Free PMC article.
-
Predicting the Onset of Diabetes with Machine Learning Methods.J Pers Med. 2023 Feb 24;13(3):406. doi: 10.3390/jpm13030406. J Pers Med. 2023. PMID: 36983587 Free PMC article. Review.
Cited by
-
Multi-parametric MRI-based machine learning model for prediction of pathological grade of renal injury in a rat kidney cold ischemia-reperfusion injury model.BMC Med Imaging. 2024 Jul 26;24(1):188. doi: 10.1186/s12880-024-01320-6. BMC Med Imaging. 2024. PMID: 39060984 Free PMC article.
-
Subnational estimates of life expectancy at birth in India: evidence from NFHS and SRS data.BMC Public Health. 2024 Apr 16;24(1):1058. doi: 10.1186/s12889-024-18278-3. BMC Public Health. 2024. PMID: 38627658 Free PMC article.
-
Machine learning-based models for prediction of the risk of stroke in coronary artery disease patients receiving coronary revascularization.PLoS One. 2024 Feb 8;19(2):e0296402. doi: 10.1371/journal.pone.0296402. eCollection 2024. PLoS One. 2024. PMID: 38330052 Free PMC article.
-
Predictors of micronutrient deficiency among children aged 6-23 months in Ethiopia: a machine learning approach.Front Nutr. 2024 Jan 5;10:1277048. doi: 10.3389/fnut.2023.1277048. eCollection 2023. Front Nutr. 2024. PMID: 38249594 Free PMC article.
-
Prediction of incomplete immunization among under-five children in East Africa from recent demographic and health surveys: a machine learning approach.Sci Rep. 2024 May 21;14(1):11529. doi: 10.1038/s41598-024-62641-8. Sci Rep. 2024. PMID: 38773175 Free PMC article.
References
-
- IIPS, ICF. National Family Health Survey (NFHS-4), 2015–16: India. Mumbai: International Institute for Population Sciences 2017.
-
- http://rchiips.org/nfhs/NFHS-4Reports/India.pdf (access on 23/07/2021 at 2.50 PM (IST)).
LinkOut - more resources
Full Text Sources
