. 2022 Sep 24;14(1):109.
doi: 10.1186/s13073-022-01110-1.

Intratumor heterogeneity and T cell exhaustion in primary CNS lymphoma

Affiliations

Intratumor heterogeneity and T cell exhaustion in primary CNS lymphoma

Michael Heming et al. Genome Med. .

Abstract

Background: Primary central nervous system lymphoma (PCNSL) is a rare lymphoma of the central nervous system, usually of diffuse large B cell phenotype. Stereotactic biopsy followed by histopathology is the diagnostic standard. However, limited material is available from CNS biopsies, thus impeding an in-depth characterization of PCNSL.

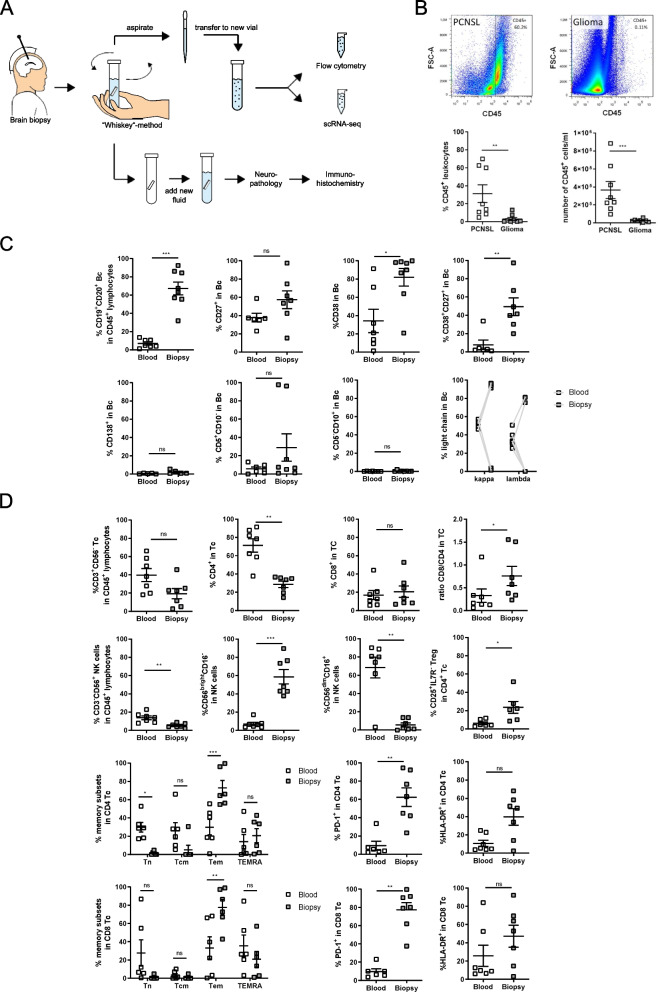
Methods: We performed flow cytometry, single-cell RNA sequencing, and B cell receptor sequencing of PCNSL cells released from biopsy material, blood, and cerebrospinal fluid (CSF), and spatial transcriptomics of biopsy samples.

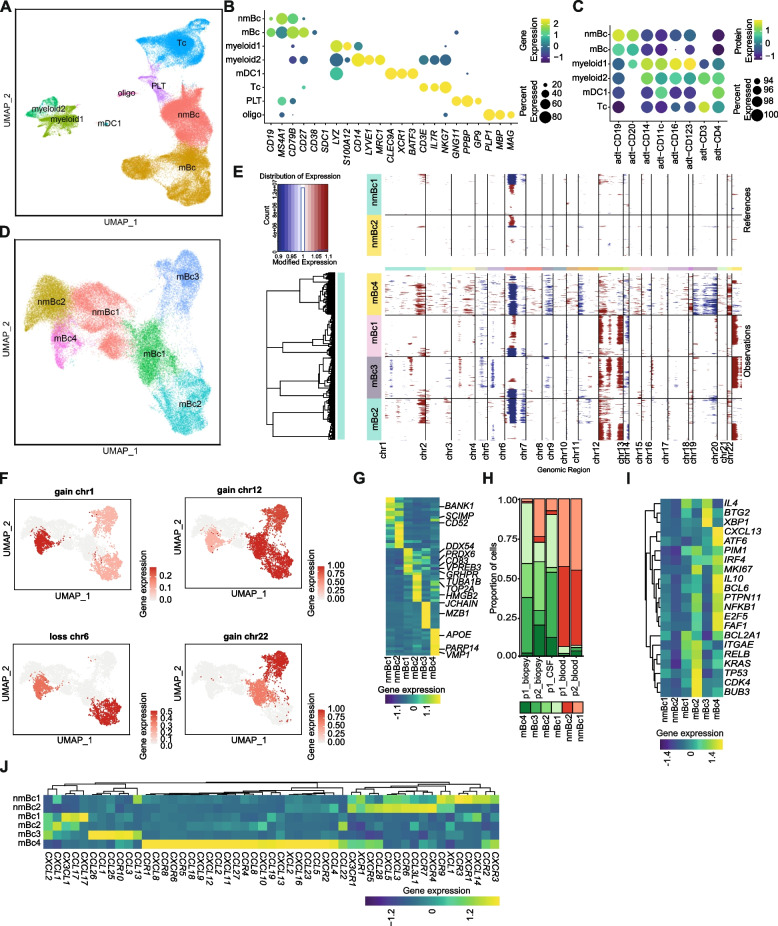
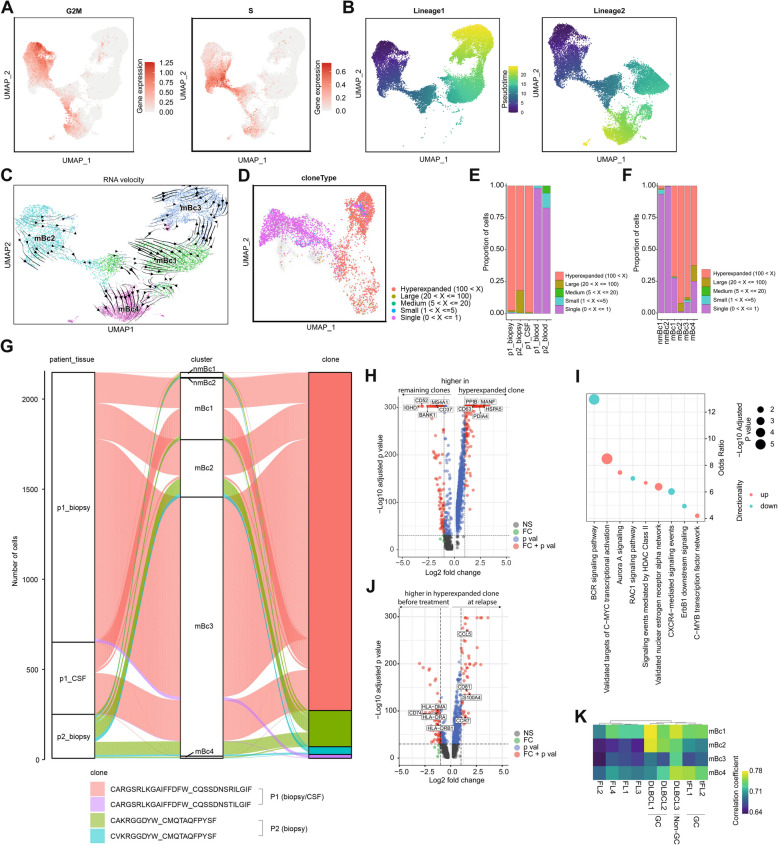
Results: PCNSL-released cells were predominantly activated CD19+CD20+CD38+CD27+ B cells. In single-cell RNA sequencing, PCNSL cells were transcriptionally heterogeneous, forming multiple malignant B cell clusters. Hyperexpanded B cell clones were shared between biopsy- and CSF- but not blood-derived cells. T cells in the tumor microenvironment upregulated immune checkpoint molecules, thereby recognizing immune evasion signals from PCNSL cells. Spatial transcriptomics revealed heterogeneous spatial organization of malignant B cell clusters, mirroring their transcriptional heterogeneity across patients, and pronounced expression of T cell exhaustion markers, co-localizing with a highly malignant B cell cluster.

Conclusions: Malignant B cells in PCNSL show transcriptional and spatial intratumor heterogeneity. T cell exhaustion is frequent in the PCNSL microenvironment, co-localizes with malignant cells, and highlights the potential of personalized treatments.

Keywords: Flow cytometry; Intratumoral heterogeneity; Primary central nervous system lymphoma; Single-cell RNA sequencing; Spatial transcriptomics; T cell exhaustion.


Conflict of interest statement

A patent application covering the method for reconstructing BCR information from 3′ libraries has been requested under the filing number LU101949 by X.L. and G.M.z.H. The remaining authors declare that they have no competing interests.

Figures

Fig. 1
Fig. 1
The “Whiskey Method” provides unique access to malignant cells and facilitates detection of PCNSL. A Experimental scheme of the “Whiskey Method.” Brain biopsy was collected into a sterile sampling tube filled with 2 ml 0.9% sodium chloride. The sample container was swirled for 10 s, and the supernatant was immediately subjected to flow cytometric and scRNA-seq analyses. The biopsy tissue was sent for neuropathological evaluation. B Representative flow cytometry dot plots of CD45+ leukocytes and flow cytometry analysis of the percentage and number of CD45+ leukocytes in the samples of PCNSL (n = 8) and glioblastoma (n = 8) patients (Additional file 1: Table S1 and Additional file 2: Supplementary Methods). C Flow cytometry analysis of CD19+CD20+ B cells (Bc) within the CD45+ leukocyte gate in peripheral blood (n = 7) and biopsy samples (n = 8) of PCNSL samples. B cell subpopulations were further characterized by analyzing the distribution of CD27+CD20+, CD38+, CD38+CD27+, CD138+, CD5+CD10, CD5CD10+, and of Ig kappa or lambda light chain expressing cells. The gating strategy is shown in Additional file 4: Fig. S1. D Flow cytometry analysis of CD3+CD56- T cells (Tc) and CD3CD56+ NK cells in the CD45+ lymphocytes gate within peripheral blood (n = 7) and biopsy samples (n = 7) are shown. NK cells were further subclustered into CD56dimCD16+ and CD56brightCD16 NK cells. T cells were further characterized by the percentage and ratio of CD4+ and CD8+ Tc, and CD4+CD25+IL7R Treg, as well as the distribution of naive T cells (Tn; CCR7+CD45RA+), central memory T cells (Tcm; CCR7+CD45RA-), effector memory T cells (Tem; CCR7CD45RA), effector memory recently activated T cells (TEMRA; CCR7CD45RA+). In addition, percentages of CD4+ and CD8+ T cells expressing HLA-DR and PD-1 were determined. Gating strategies are depicted in Additional file 4: Fig. S2. Data are depicted as mean, error bars show the SE; two-sided Mann-Whitney U test was used to calculate statistical significance between groups; * p<0.05, ** p<0.01, *** p <0.001, **** p <0.0001, ns not significant
Fig. 2
Fig. 2
Single-cell transcriptomic reveals heterogeneous malignant B cell phenotypes in PCNSL. A UMAP plot of 73,896 total single-cell transcriptomes aggregated from five samples (patient 1: biopsy, blood, CSF; patient2: biopsy, blood). B Gene and protein (C) cell markers of the clusters identified by single-cell RNA sequencing (scRNA-seq) and CITE-seq (biopsy and blood from patient 1). Color encodes average gene/protein expression, and dot size represents the percentage of cells expressing the gene. The threshold of percentage of cells expressing the gene/protein was set to 15% in B and 90% in C. D UMAP plot of 45,890 reclustered B cells (mBc and nmBc cluster from A). E Analysis of copy number variations of downsampled B cell clusters. The nmBc1-2 clusters were used as reference cells and mBc1-4 as observations. The amplification of chromosomal regions is colored in red and the deletion of chromosomal regions in blue. F Feature plots of chromosomal gains and losses with the UMAP embeddings of D. Color encodes the proportion of chromosomal aberration. G Top ten differentially expressed genes of each B cell cluster shown in a heatmap. Selected genes are highlighted. Gene expression values were scaled gene-wise. H Proportions of B cells split by sample and colored by cluster name. I–J Gene expression heatmap of known PCNSL- associated genes (I) and of chemokines and their receptors (J) in B cell clusters, scaled gene-wise. Gene name - alias: MS4A1 - CD20; SDC1 - CD138; SELL - CD62L; IRF4 - MUM1. Abbreviations: mBc - malignant B cells; nmBc - non-malignant B cells; mDC1 - myeloid dendritic cells type 1; oligo - oligodendrocytes; Tc - T cells; PLT -platelets; p1 - patient 1; p2 - patient 2; CSF - cerebrospinal fluid
Fig. 3
Fig. 3
Biopsy- and CSF-derived cells but not blood cells share hyperexpanded B cell clones. A Geneset feature plot of G2/M and S phase with the UMAP embeddings of C. Color encodes gene expression. B Feature plots of two lineages of pseudotime analysis. Pseudotime is color-coded and the UMAP embeddings refer to C. C RNA velocity analysis of mBc1-4 clusters (Fig. 2A). Streamlines represent vector velocity fields, which show the developmental pathways. D UMAP plot of all B cell clusters (45,890 cells) from 5 samples (patient 1: biopsy, blood, CSF; patient 2: biopsy, blood) with color-coded frequency of B cell clones. Cells colored in transparent grey represent cells with missing BCR information. E, F Proportions of B cells with BCR information split by sample (E) or cluster (F) and colored by frequency. Frequency was defined by the number of B cells expressing a unique clone (paired BCR heavy and light chains). G Alluvial plot shows the origin tissue and cluster of the hyperexpanded clones. H, J Volcano plots of the differentially expressed (DE) genes of the hyperexpanded clones versus all remaining clones (H) and DE genes of the hyperexpanded clone of patient 1 after treatment at relapse (CSF-derived) versus before treatment (biopsy-derived) (I). The threshold for the log2 fold change was set to 1 and the threshold for the negative log10p-value to 30. I Significantly enriched terms of DE genes based on the NCI-Nature Pathway Interaction Database corresponding to H. Size encodes the significance and color encodes whether the term was enriched in genes with elevated or reduced gene expression. K Correlation coefficients between gene expression of mBc1-4 clusters (row) and different lymphomas (column) from Roider et al. [15] including four follicular lymphoma (FL1-4), four GC-derived DLBCLs, of which two were transformed from FLs (DLBCL1, DLBCL2, tFL1, and tFL2) and one non-GC-derived DLBCL (DLBCL3), visualized in a heatmap. High correlation coefficients, colored in yellow, indicate a high transcriptional overlap. Abbreviations: mBc - malignant B cells; nmBc - non-malignant B cells; p1 - patient 1; p2 - patient 2; Bc - B cells; CSF - cerebrospinal fluid; NS - not significant; FC - fold change; p val - p-value; DLBCL - diffuse large B cell lymphoma; FL - follicular lymphoma (FL); tFL - transformed FL
Fig. 4
Fig. 4
Increased expression of regulatory and T cell exhaustion molecules in the PCNSL microenvironment. A UMAP plot of all T cell subclusters, including 17,175 single-cell transcriptomes from 5 samples (patient 1: biopsy, blood, CSF; patient 2: biopsy, blood). B Dot plot of T cell markers in T cell subclusters. Color encodes average gene expression and dot size shows the percentage of cells expressing the gene with the threshold of percentage of cells expressing the gene set to 10%. C Proportion of T cells split by sample and colorized by cluster name. D Comparison of T cell subcluster abundances between biopsy and blood by plotting the log2 fold change. E,F Gene expression heatmaps of canonical immune checkpoints (D), exhaustion profiles from Singer et al. [50], Tirosh et al. [51], Chihara et al. [52] (F), and regulatory T cell markers (G) in T subclusters. Values were scaled row-wise and color encodes gene expression. Exhaustion signatures are listed in Additional file 14: Table S12. H Gene expression heatmap of immune checkpoint ligands in B cell clusters, scaled gene-wise, color encodes gene expression. I,J Biopsy-derived T cells (I) and blood-derived T cells (J) were projected on the latent space of a reference T cell dataset [24]. Gene name - alias: HAVCR2 - TIM3; PDCD1 - PD1; IRF4 - MUM1; PDCD1LG2 - PD-L2; LGALS9 - Galectin9. Abbreviations: NK - natural killer cells; memCD4/CD8 - memory-like CD4+/CD8+ T cells; naiveCD4/CD8 - naive-like CD4+/CD8+ T cells; actTc - activated T cells; exhTc - exhausted T cells; TregCD4 - regulatory CD4+ T cells; p1 - patient1; p2 - patient2; CSF - cerebrospinal fluid; mBc - malignant B cells; nmBc - non-malignant B cells; Tex -terminally-exhausted; Tpex - precursor-exhausted; Tfh - CD4+ follicular-helper cells
Fig. 5
Fig. 5
Cellular crosstalk between PCNSL and its microenvironment feature immune evasion signaling. A Selected predicted cellular interactions between malignant B cell clusters (mBc1-4) and the immune cell clusters of the tumor microenvironment based on CellPhoneDB [28] (see “Methods”). Circle size represents the p-value and color encodes the logarithmic mean of the gene expression of the interacting pairs
Fig. 6
Fig. 6
Spatial patterns of malignant B cell clusters reflect their transcriptional heterogeneity across patients. A–D Spatial feature plots of the integrated malignant B cell clusters of patients 1 (A), 2 (B), 3 (C), and 7 (D). The transcriptional expression is overlaid on top of the tissue histology. The gene expression of the integrated clusters is encoded by color and transparency. E–H Spatial feature plots of canonical T cell exhaustion markers of patients 1 (E), 2 (F), 3 (G), and 7 (H). The gene expression is encoded by color and transparency. Gene name - alias: HAVCR2 - TIM3; PDCD1 - PD1. Abbreviations: mBc - malignant B cells; nm - non-malignant B cells

References

    1. Korfel A, Schlegel U. Diagnosis and treatment of primary CNS lymphoma. Nat Rev Neurol. 2013;9:317–27. - PubMed
    1. Grommes C, Rubenstein JL, DeAngelis LM, Ferreri AJM, Batchelor TT. Comprehensive approach to diagnosis and treatment of newly diagnosed primary CNS lymphoma. Neuro Oncol. 2019;21:296–305. - PMC - PubMed
    1. Grommes C, DeAngelis LM. Primary CNS Lymphoma. J Clin Oncol. 2017;35:2410–8. - PMC - PubMed
    1. Hattab EM, Martin SE, Al-Khatib SM, Kupsky WJ, Vance GH, Stohler RA, et al. Most primary central nervous system diffuse large B-cell lymphomas occurring in immunocompetent individuals belong to the nongerminal center subtype: a retrospective analysis of 31 cases. Mod Pathol. 2010;23:235–43. - PubMed
    1. Rubenstein JL, Wong VS, Kadoch C, Gao H-X, Barajas R, Chen L, et al. CXCL13 plus interleukin 10 is highly specific for the diagnosis of CNS lymphoma. Blood. 2013;121:4740–8. - PMC - PubMed

Publication types

MeSH terms

Substances