. 2022 Sep 24;14(1):110.
doi: 10.1186/s13073-022-01112-z.

Longitudinal multi-omics analysis identifies early blood-based predictors of anti-TNF therapy response in inflammatory bowel disease

Collaborators, Affiliations

Longitudinal multi-omics analysis identifies early blood-based predictors of anti-TNF therapy response in inflammatory bowel disease

Neha Mishra et al. Genome Med. .

Abstract

Background and aims: Treatment with tumor necrosis factor α (TNFα) antagonists in IBD patients suffers from primary non-response rates of up to 40%. Biomarkers for early prediction of therapy success are missing. We investigated the dynamics of gene expression and DNA methylation in blood samples of IBD patients treated with the TNF antagonist infliximab and analyzed the predictive potential regarding therapy outcome.

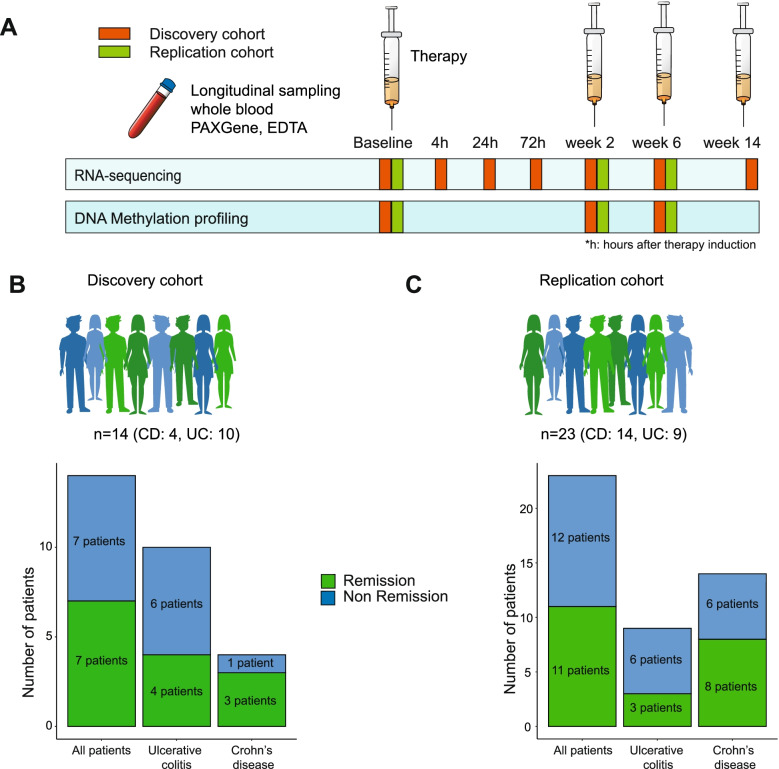
Methods: We performed a longitudinal, blood-based multi-omics study in two prospective IBD patient cohorts receiving first-time infliximab therapy (discovery: 14 patients, replication: 23 patients). Samples were collected at up to 7 time points (from baseline to 14 weeks after therapy induction). RNA-sequencing and genome-wide DNA methylation data were analyzed and correlated with clinical remission at week 14 as a primary endpoint.

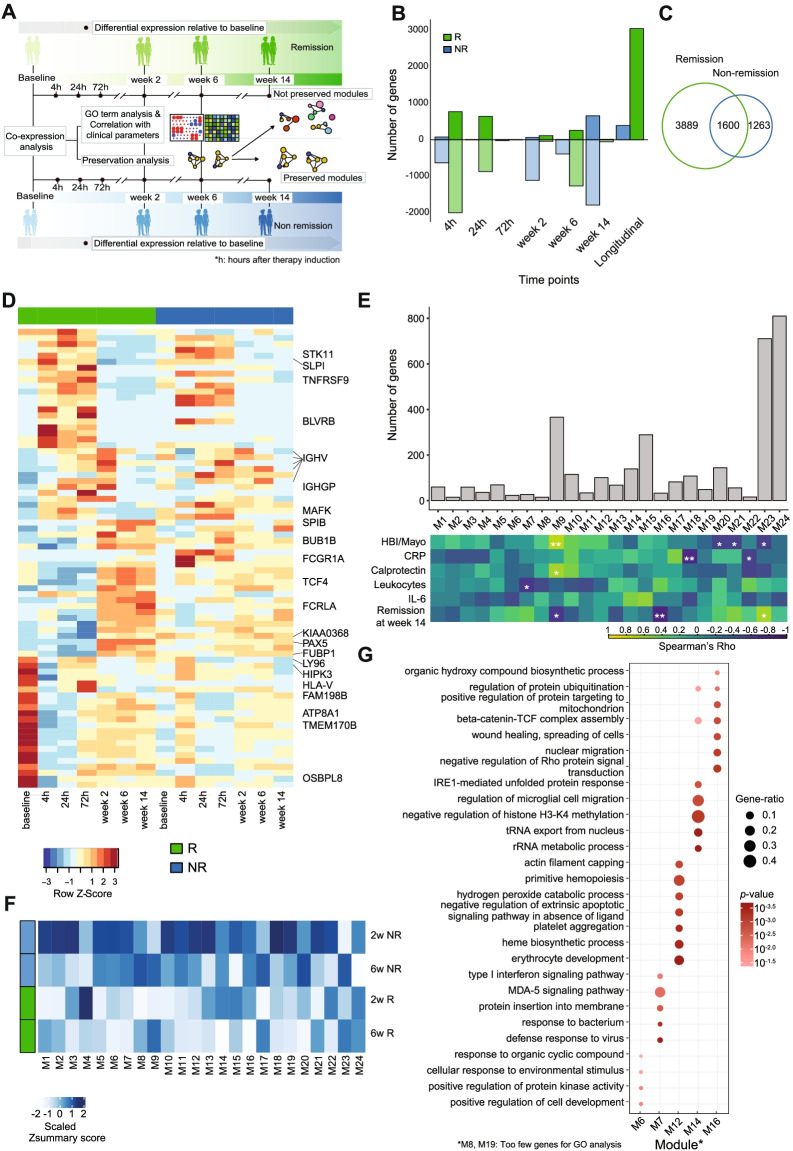
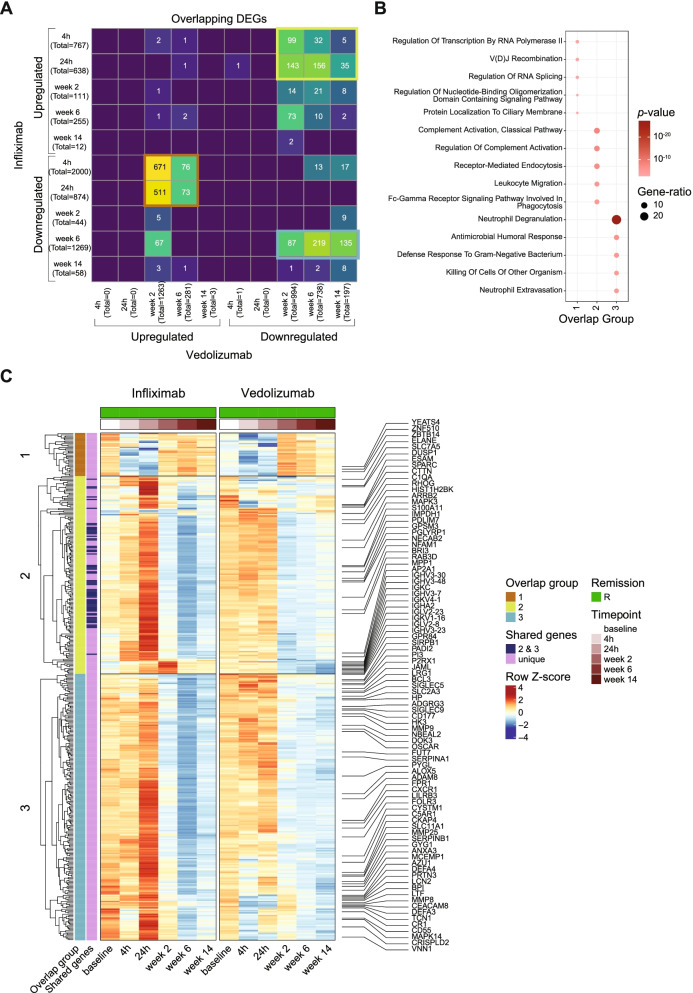
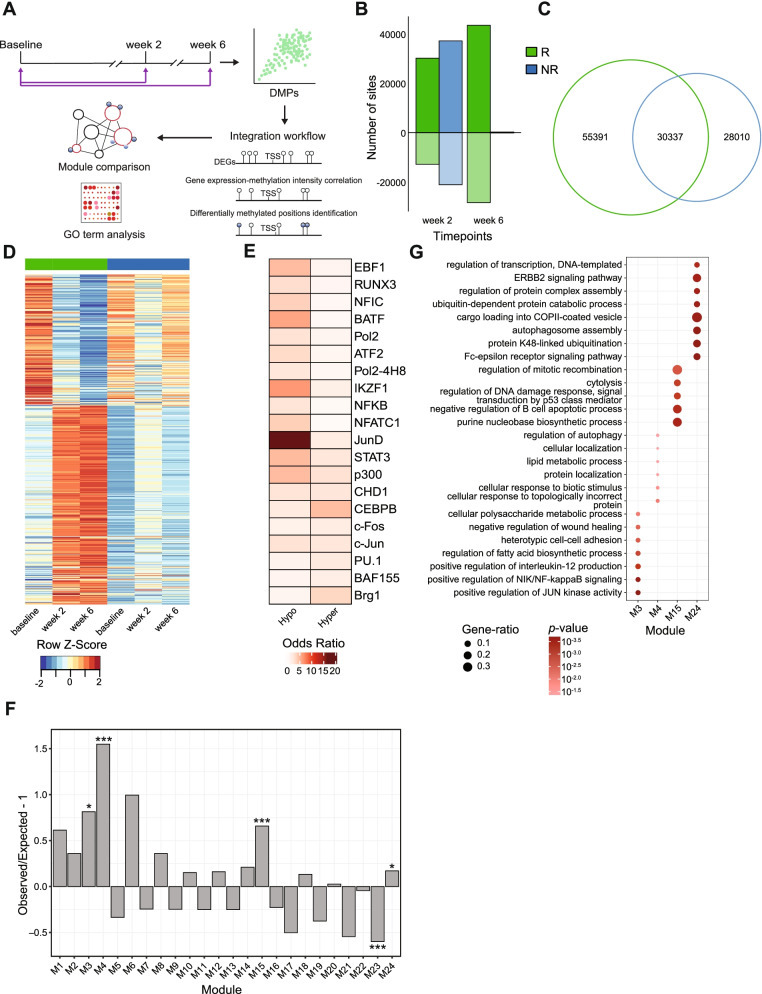
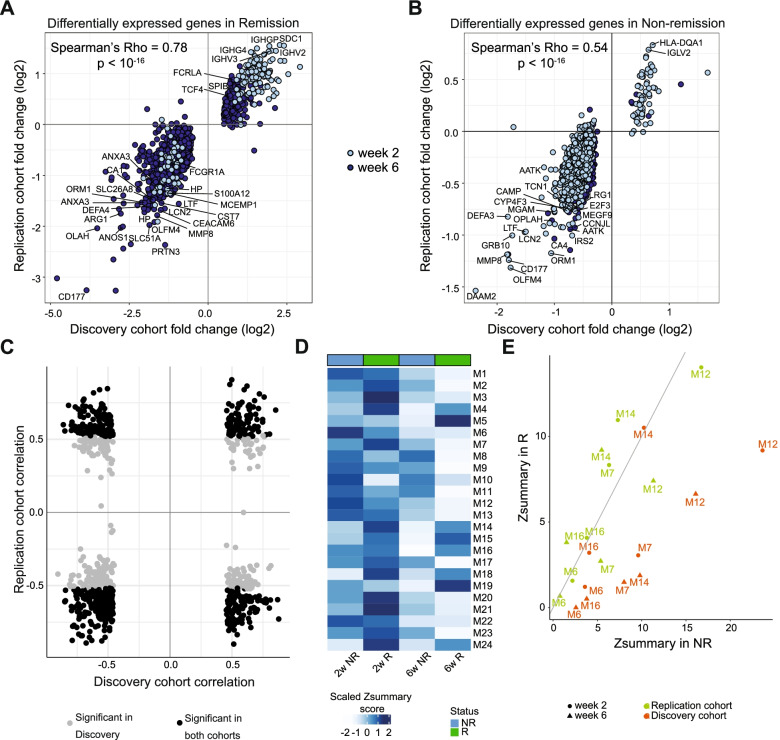
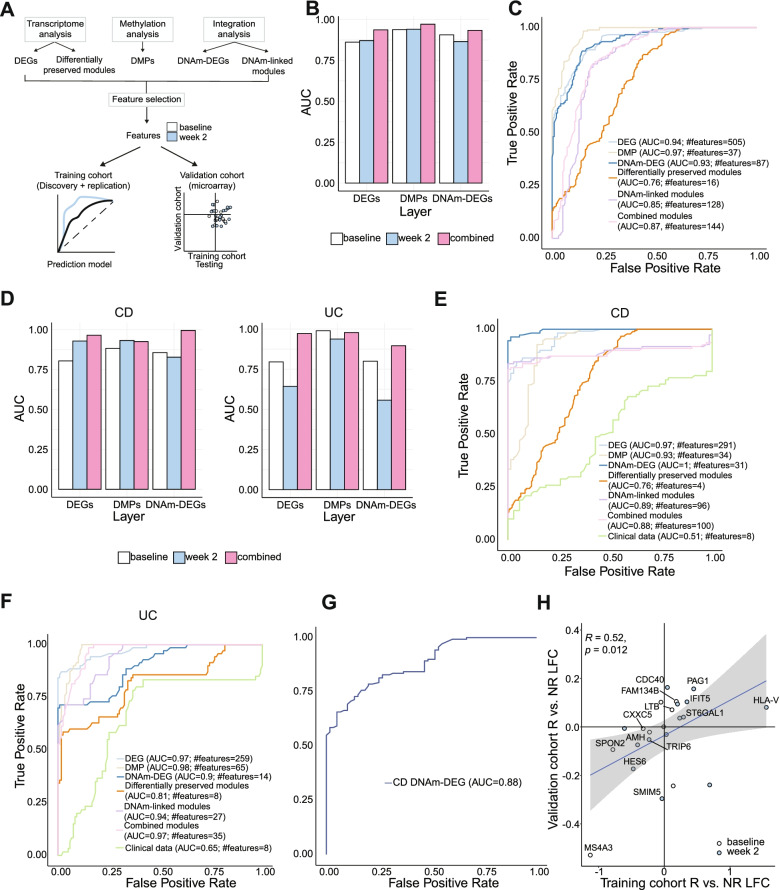
Results: We found no consistent ex ante predictive signature across the two cohorts. Longitudinally upregulated transcripts in the non-remitter group comprised TH2- and eosinophil-related genes including ALOX15, FCER1A, and OLIG2. Network construction identified transcript modules that were coherently expressed at baseline and in non-remitting patients but were disrupted at early time points in remitting patients. These modules reflected processes such as interferon signaling, erythropoiesis, and platelet aggregation. DNA methylation analysis identified remission-specific temporal changes, which partially overlapped with transcriptomic signals. Machine learning approaches identified features from differentially expressed genes cis-linked to DNA methylation changes at week 2 as a robust predictor of therapy outcome at week 14, which was validated in a publicly available dataset of 20 infliximab-treated CD patients.

Conclusions: Integrative multi-omics analysis reveals early shifts of gene expression and DNA methylation as predictors for efficient response to anti-TNF treatment. Lack of such signatures might be used to identify patients with IBD unlikely to benefit from TNF antagonists at an early time point.

Keywords: Biologics; Biomarker; Intestinal inflammation; Personalized medicine; Therapy response.


Conflict of interest statement

Stefan Schreiber has been a consultant for AbbVie, Bristol Myers Squibb, Boehringer Ingelheim, Ferring, Genentech/Roche, Janssen, Lilly, Medimmune/AstraZeneca, Novartis, Merck Sharp Dohme, Pfizer, Protagonist, Sanofi, Takeda, Theravance, and UCB and is a paid speaker for AbbVie, Ferring, Janssen, Merck Sharp Dohme, Novartis, Takeda, and UCB. Philip Rosenstiel has been a consultant for Takeda and Omass. All other authors declare no competing interests.

Figures

Fig. 1
Fig. 1
Study design and cohorts. A Schematic representation of the study design. B, C Total number of IBD patients recruited in the discovery (B) and replication (C) cohorts
Fig. 2
Fig. 2
Dynamic changes in transcription in response to therapy induction and remission. A Schematic workflow. B Number of upregulated (dark) and downregulated (light) genes in remission (green) and non-remission (blue) patients at each time point after therapy induction obtained from the pairwise analysis and number of transiently differentially expressed genes obtained from the longitudinal analysis of the discovery cohort. Negative numbers are used to show the number of downregulated genes. C Venn diagram showing the number of DEGs in remission and non-remission patients from pairwise and longitudinal analysis combined. D Heatmap of top DEGs in remission patients from pairwise and longitudinal analysis, showing scaled mean expression counts at each time point in remission and non-remission samples. Selected immune-relevant transcripts are labeled by gene name. E Bar plot showing the number of genes in each co-expression module along with a correlation heatmap showing Spearman’s rank correlation coefficients between gene co-expression modules (columns) and clinical parameters (rows). *p-value < 0.05, **p-value < 0.01, and ***p-value < 0.001 in Spearman’s correlation. Color intensity corresponds to the correlation coefficient. F Heatmap showing Zsummary scores of baseline co-expression modules in remission and non-remission samples at weeks 2 and 6. G GO terms enriched in differentially preserved co-expression modules between remission and non-remission. Dot size is proportional to the gene ratio and color corresponds to the p-value of enrichment
Fig. 3
Fig. 3
Comparison of transcriptomic changes between infliximab and vedolizumab patients. A Cross-tabulation of genes differentially expressed in patients treated with infliximab (rows) and vedolizumab (columns) that achieved remission after 14 weeks of the respective therapy induction. The three groups of overlapping genes are highlighted in orange (group 1), green (group 2), and blue (group 3). B GO terms enriched in genes belonging to the three overlap groups. Dot size is proportional to the gene ratio and color corresponds to the p-value of enrichment. The top five GO terms in each group are visualized. C Heatmap showing average scaled mean expression counts at each time point of selected genes in the three overlap groups
Fig. 4
Fig. 4
DNA methylation analysis and integration of omics layers. A Schematic workflow. B Number of hypermethylated (dark) and hypomethylated (light) positions in remission (green) and non-remission (blue) patients at each time point after therapy induction obtained from the pairwise analysis of the discovery cohort. Negative numbers are used to show the number of hypomethylated positions. C Venn diagram showing the number of DMPs in remission and non-remission patients. D Heatmap of DMPs, which are correlated with DEGs, showing scaled mean methylation intensities at each time point in remission and non-remission samples. E Heatmap showing significant enrichment, quantified by odds ratio, of transcription factor binding sites (TFBS) in DMPs that are correlated with DEGs. Selected top TFs are visualized. F Over-representation and under-representation of DNAm-linked DEGs in co-expression modules. The over-/under-representation is quantified as the ratio of the observed and expected number of correlated genes present in each module under the chi-square distribution. G GO terms enriched in DNAm-linked co-expression modules. Dot size is proportional to the gene ratio and color corresponds to the p-value of enrichment
Fig. 5
Fig. 5
Replication of molecular signatures. A, B Comparison of log fold change of DEGs in remission (A) and non-remission (B) patients at weeks 2 (light blue) and 6 (dark blue) between discovery and replication cohorts. C Comparison of DEG-DMP correlation between discovery and replication cohorts. Gray dots represent a significant correlation in the discovery cohort while black dots significant correlation in both cohorts. D Heatmap showing Zsummary scores of baseline co-expression modules from the discovery cohort in remission (green) and non-remission (blue) samples at weeks 2 and 6 of the replication cohort. E Comparison of Zsummary scores of differentially preserved modules in discovery cohort between remission and non-remission samples at weeks 2 (circle) and 6 (triangle) in the discovery (orange) and replication (green) cohorts
Fig. 6
Fig. 6
Feature selection and validation of molecular signatures. A Schematic workflow. B, D Comparison of AUC values of the ROC curves of prediction models constructed using selected baseline (white), week 2 (blue), and combined (pink) features from DEGs, DMPs, and DNAm-DEGs using a random forest approach in IBD (B), CD, and UC (D) samples from the training cohort. C, E, F ROC curves of prediction models constructed using selected features (baseline and week 2 combined) from DEGs, DMPs, DNAm-DEGs, differentially preserved, DNAm-linked, combined modules, and clinical parameters using a random forest approach in IBD (C), CD (E), and UC (F) samples from the training cohort. G ROC curve of prediction model constructed using selected features from DNAm-DEGs in the validation cohort. H Comparison of log fold change between remitters and non-remitters at baseline (white) and week 2 (blue) (left) between training cohort and validation cohorts

References

    1. Hanauer SB, Feagan BG, Lichtenstein GR, et al. Maintenance infliximab for Crohn’s disease: the ACCENT I randomised trial. Lancet. 2002;359:1541–1549. doi: 10.1016/S0140-6736(02)08512-4. - DOI - PubMed
    1. Rutgeerts P, Sandborn WJ, Feagan BG, et al. Infliximab for induction and maintenance therapy for ulcerative colitis. N Engl J Med. 2005;353:2462–2476. doi: 10.1056/nejmoa050516. - DOI - PubMed
    1. Hanauer SB, Sandborn WJ, Rutgeerts P, et al. Human anti-tumor necrosis factor monoclonal antibody (adalimumab) in Crohn’s disease: the CLASSIC-I trial. Gastroenterology. 2006;130:323–333. doi: 10.1053/j.gastro.2005.11.030. - DOI - PubMed
    1. Danese S. New therapies for inflammatory bowel disease: from the bench to the bedside. Gut. 2012;61:918–932. doi: 10.1136/gutjnl-2011-300904. - DOI - PubMed
    1. Ben-Horin S, Kopylov U, Chowers Y. Optimizing anti-TNF treatments in inflammatory bowel disease. Autoimmun. Rev. 2014;13:24–30. doi: 10.1016/j.autrev.2013.06.002. - DOI - PubMed

Publication types