

RNA sequencing of single allergen-specific memory B cells after grass pollen immunotherapy: Two unique cell fates and CD29 as a biomarker for treatment effect
- PMID: 36153670
- PMCID: PMC10952829
- DOI: 10.1111/all.15529
RNA sequencing of single allergen-specific memory B cells after grass pollen immunotherapy: Two unique cell fates and CD29 as a biomarker for treatment effect
Abstract
Background: Sublingual immunotherapy (SLIT) for grass pollen allergy can modify the natural history of allergic rhinitis and is associated with increased allergen-specific IgG4 . IgG4 competitively inhibits functional IgE on the surface of effector cells, such as mast cells and basophils, from binding to allergens. To further understand the important role memory B-cell (Bmem) responses play in mediating the beneficial effects of SLIT, we assessed changes in allergen-specific Bmem subsets induced by SLIT for grass pollen allergy.
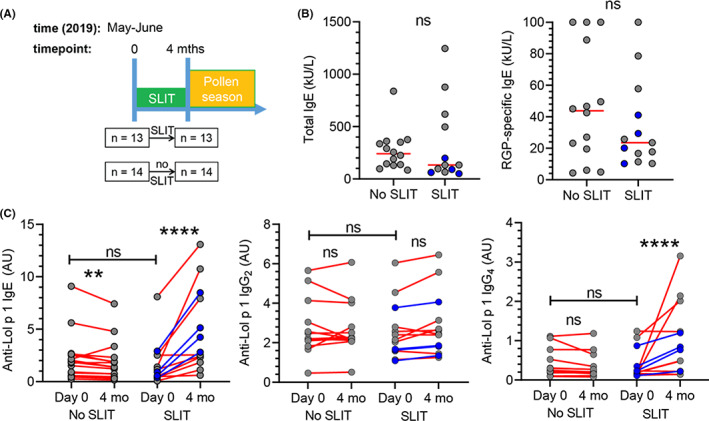
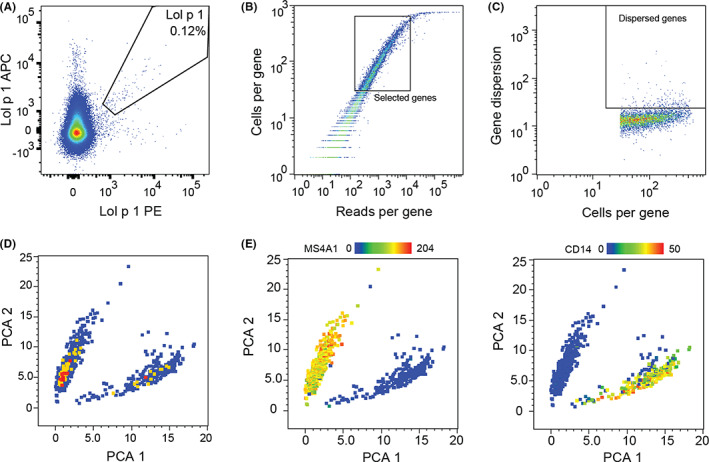
Methods: Blood samples were collected twice outside the pollen season from twenty-seven patients with sensitization to ryegrass pollen (RGP; Lolium perenne) and seasonal rhinoconjunctivitis. Thirteen received 4-month pre-seasonal SLIT for grass pollen allergy, and 14 received standard pharmacotherapy only. Single-cell RNA sequencing was performed on FACS-purified Lol p 1-specific Bmem before and after SLIT from four patients, and significant genes were validated by flow cytometry on the total cohort.
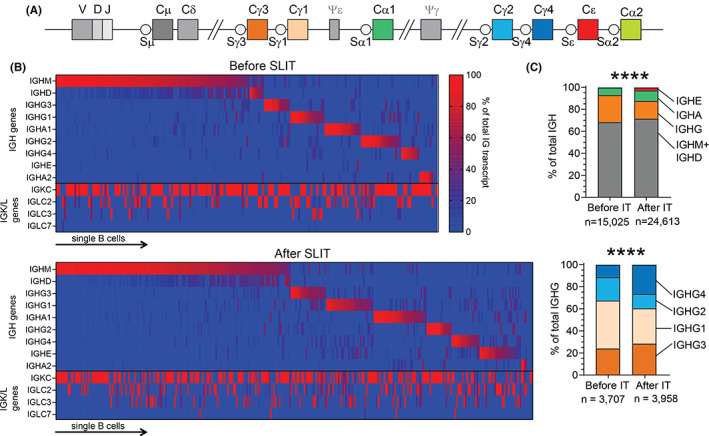
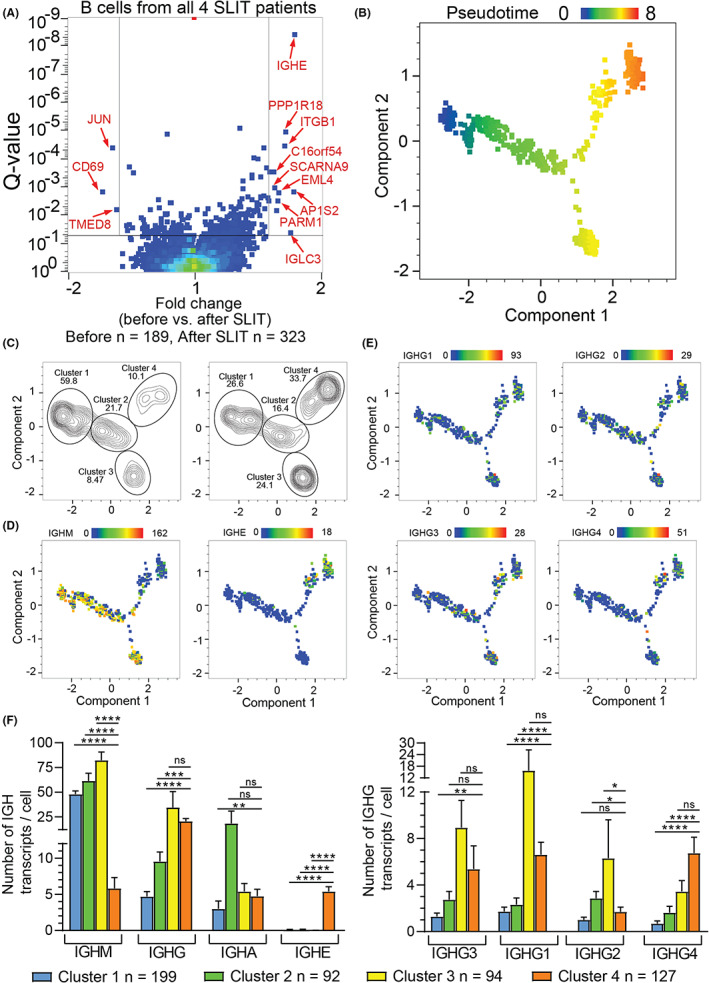
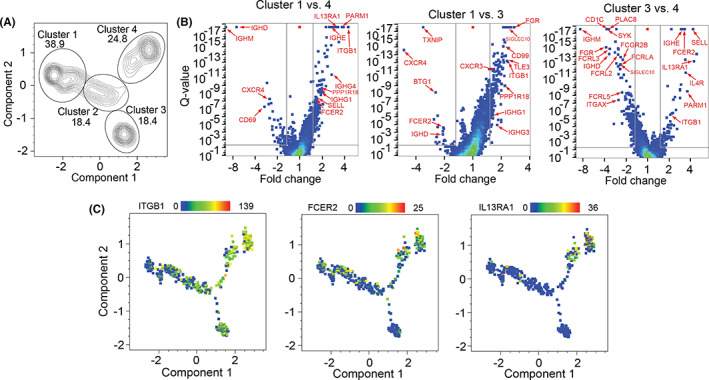
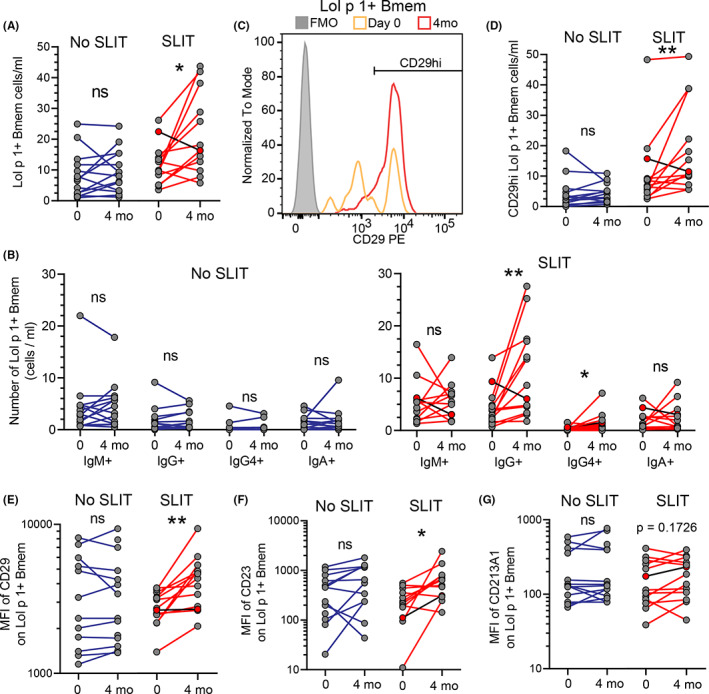
Results: Four months of SLIT increased RGP-specific IgE and IgG4 in serum and induced two Lol p 1-specific Bmem subsets with unique transcriptional profiles. Both subsets had upregulated expression of beta 1 integrin ITGB1 (CD29), whereas IGHE (IgE), IGHG4 (IgG4 ), FCER2 (CD23), and IL13RA1 were upregulated in one subset. There was an increase in the proportion of Lol p 1+ Bmem expressing surface IgG4 , CD23, and CD29 after SLIT.
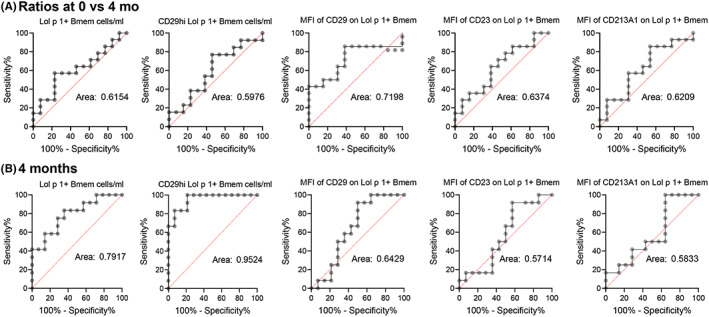
Conclusions: A clinically successful 4 months course of SLIT for grass pollen allergy induces two transcriptionally unique Bmem fates. Associated changes in surface-expressed proteins on these Bmem subsets can be used as early biomarkers for treatment effects.
Keywords: allergen immunotherapy; biomarkers; grass pollen allergy; memory B cells; transcriptomics.
© 2022 The Authors. Allergy published by European Academy of Allergy and Clinical Immunology and John Wiley & Sons Ltd.
Conflict of interest statement
MCvZ, REO’H, and CIM are inventors on a patent application related to this work. All the other authors declare that they have no relevant conflicts of interest.
Figures
Similar articles
-
Induction of IgG2 and IgG4 B-cell memory following sublingual immunotherapy for ryegrass pollen allergy.Allergy. 2020 May;75(5):1121-1132. doi: 10.1111/all.14073. Epub 2019 Nov 4. Allergy. 2020. PMID: 31587307 Free PMC article.
-
Pretreatment IgE sensitization patterns determine the molecular profile of the IgG4 response during updosing of subcutaneous immunotherapy with timothy grass pollen extract.J Allergy Clin Immunol. 2016 Feb;137(2):562-70. doi: 10.1016/j.jaci.2015.05.023. Epub 2015 Jun 30. J Allergy Clin Immunol. 2016. PMID: 26141262 Clinical Trial.
-
Immunological comparison of allergen immunotherapy tablet treatment and subcutaneous immunotherapy against grass allergy.Clin Exp Allergy. 2014 Mar;44(3):417-28. doi: 10.1111/cea.12241. Clin Exp Allergy. 2014. PMID: 24734285 Clinical Trial.
-
Heterogeneity of antibody responses among clinical responders during grass pollen sublingual immunotherapy.Clin Exp Allergy. 2013 Dec;43(12):1362-73. doi: 10.1111/cea.12187. Clin Exp Allergy. 2013. PMID: 24261946
-
Nasal allergen-neutralizing IgG4 antibodies block IgE-mediated responses: Novel biomarker of subcutaneous grass pollen immunotherapy.J Allergy Clin Immunol. 2019 Mar;143(3):1067-1076. doi: 10.1016/j.jaci.2018.09.039. Epub 2018 Nov 14. J Allergy Clin Immunol. 2019. PMID: 30445057
Cited by
-
Expansion of phenotypically modified type 2 memory B cells after allergen immunotherapy.Allergy. 2025 Mar;80(3):867-869. doi: 10.1111/all.16320. Epub 2024 Sep 13. Allergy. 2025. PMID: 39268605 Free PMC article. No abstract available.
-
CD23+IgG1+ memory B cells are poised to switch to pathogenic IgE production in food allergy.Sci Transl Med. 2024 Feb 7;16(733):eadi0673. doi: 10.1126/scitranslmed.adi0673. Epub 2024 Feb 7. Sci Transl Med. 2024. PMID: 38324641 Free PMC article.
-
Changes in and Potential Mechanisms of Circulating IgA+CD27-Class-Switched Memory B Cells in Patients With Allergic Rhinitis.J Asthma Allergy. 2025 Jan 22;18:69-83. doi: 10.2147/JAA.S501775. eCollection 2025. J Asthma Allergy. 2025. PMID: 39867643 Free PMC article.
-
Whence and wherefore IgE?Immunol Rev. 2024 Sep;326(1):48-65. doi: 10.1111/imr.13373. Epub 2024 Jul 23. Immunol Rev. 2024. PMID: 39041740 Review.
-
A study of specific immunoglobulin G4 expression in allergic rhinitis and its value in assessing efficacy and in predicting prognosis of sublingual immunotherapy.Kaohsiung J Med Sci. 2025 Jan;41(1):e12916. doi: 10.1002/kjm2.12916. Epub 2024 Dec 30. Kaohsiung J Med Sci. 2025. PMID: 39739782 Free PMC article.
References
-
- García‐Mozo H. Poaceae pollen as the leading aeroallergen worldwide: a review. Allergy. 2017;72:1849‐1858. - PubMed
-
- Blaiss MS, Hammerby E, Robinson S, Kennedy‐Martin T, Buchs S. The burden of allergic rhinitis and allergic rhinoconjunctivitis on adolescents: a literature review. Ann Allergy Asthma Immunol. 2018;121:43‐52. - PubMed
-
- Nathan RA. The burden of allergic rhinitis. Allergy Asthma Proc. 2007;28:3‐9. - PubMed
-
- Schatz M. A survey of the burden of allergic rhinitis in the USA. Allergy. 2007;62:9‐16. - PubMed
-
- Schoenwetter WF, Dupclay L, Appajosyula S, Botteman MF, Pashos CL. Economic impact and quality‐of‐life burden of allergic rhinitis. Curr Med Res Opin. 2004;20:305‐317. - PubMed
Publication types
MeSH terms
Substances
LinkOut - more resources
Full Text Sources
Other Literature Sources
Medical
Miscellaneous
