. 2023 Jan;35(1):e14469.
doi: 10.1111/nmo.14469. Epub 2022 Sep 25.

Comparison of acid-lowering drugs for endoscopy negative reflux disease: Systematic review and network Meta-Analysis

Affiliations

Comparison of acid-lowering drugs for endoscopy negative reflux disease: Systematic review and network Meta-Analysis

Brigida Barberio et al. Neurogastroenterol Motil. 2023 Jan.

Abstract

Background: The comparative efficacy and safety of medical therapies for gastro-esophageal reflux symptoms in endoscopy-negative reflux disease is unclear. We conducted a network meta-analysis to evaluate efficacy and safety of proton pump inhibitors (PPIs), histamine-2-receptor antagonists, potassium-competitive acid blockers (PCABs), and alginates in patients with endoscopy-negative reflux disease.

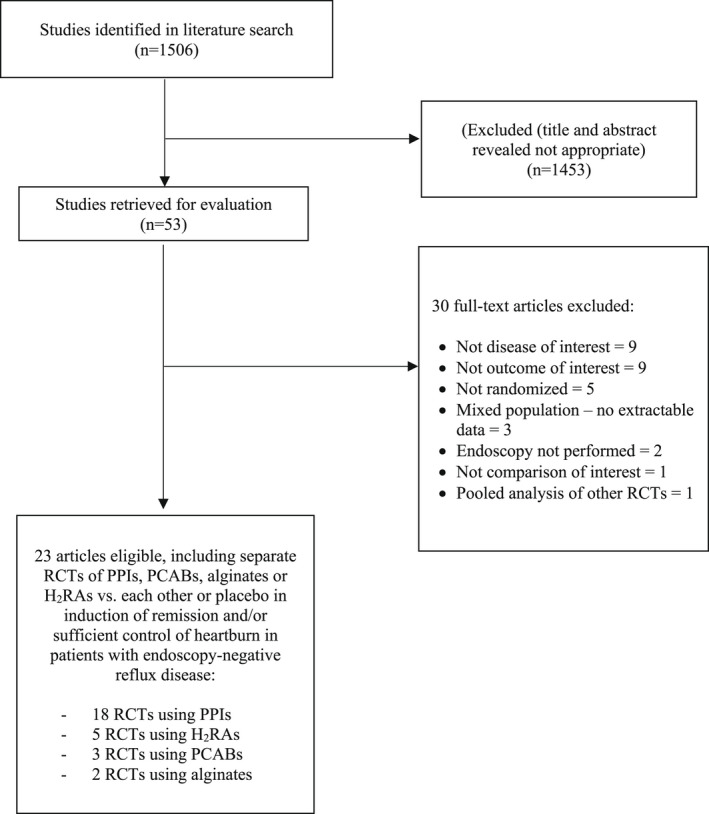
Methods: We searched MEDLINE, EMBASE, EMBASE Classic, and the Cochrane central register of controlled trials from inception to February 1, 2022. We included randomized controlled trials (RCTs) comparing efficacy of all drugs versus each other, or versus a placebo, in adults with endoscopy-negative reflux disease. Results were reported as pooled relative risks with 95% confidence intervals to summarize effect of each comparison tested, with treatments ranked according to P-score.

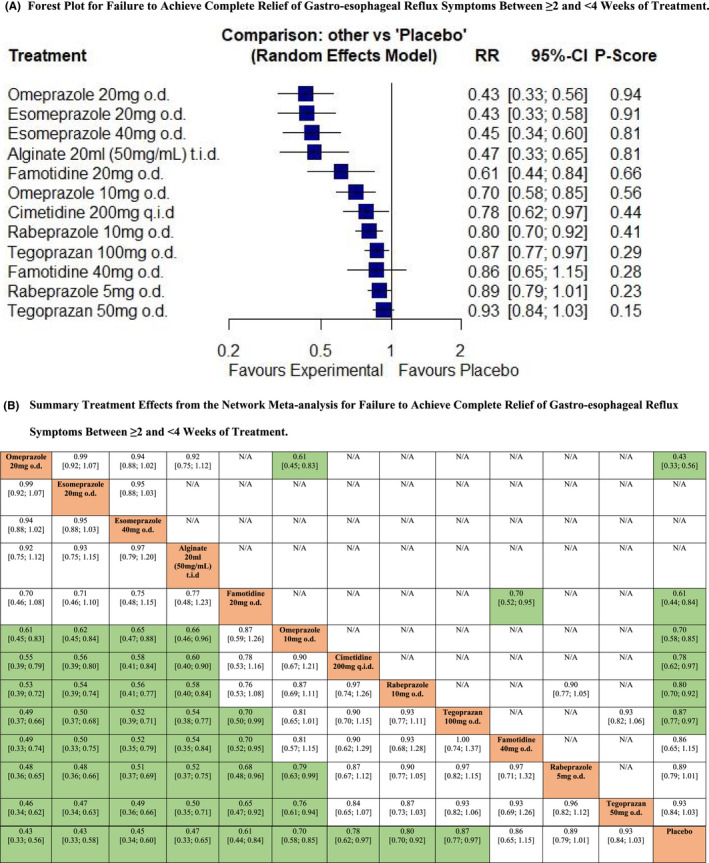
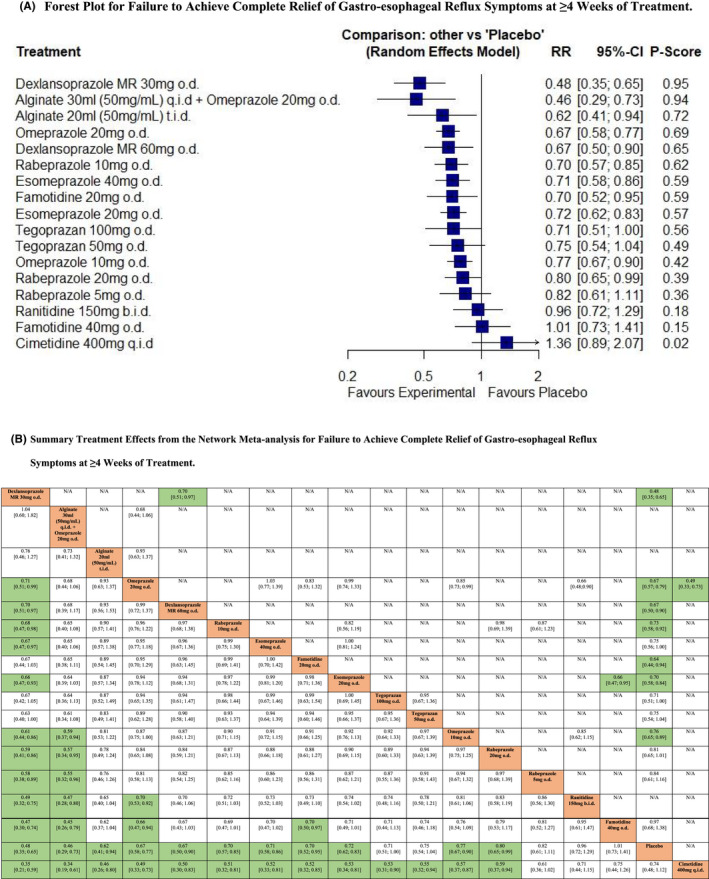
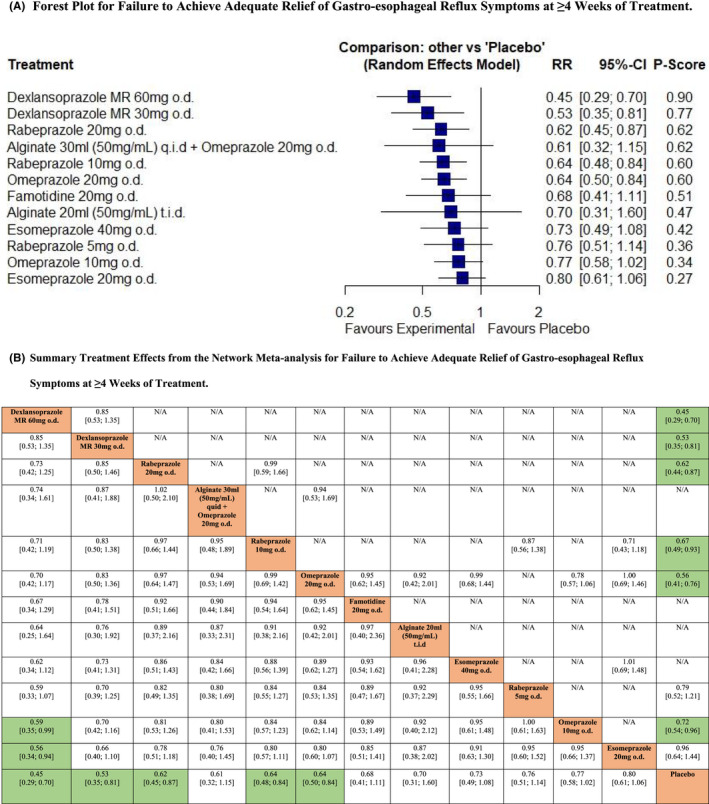
Key results: We identified 23 RCTs containing 10,735 subjects with endoscopy-negative reflux disease. Based on failure to achieve complete relief of symptoms between ≥2 and <4 weeks, omeprazole 20 mg o.d. (P-score 0.94) ranked first, with esomeprazole 20 mg o.d. or 40 mg o.d. ranked second and third. In achieving adequate relief, only rabeprazole 10 mg o.d. was significantly more efficacious than placebo. For failure to achieve complete relief at ≥4 weeks, dexlansoprazole 30 mg o.d. (P-score 0.95) ranked first, with 30 ml alginate q.i.d. combined with omeprazole 20 mg o.d., and 30 ml alginate t.i.d. second and third. In terms of failure to achieve adequate relief at ≥4 weeks, dexlansoprazole 60 mg o.d. ranked first (P-score 0.90), with dexlansoprazole 30 mg o.d. and rabeprazole 20 mg o.d. second and third. All drugs were safe and well-tolerated.

Conclusions & inferences: Our results confirm superiority of PPIs compared with most other drugs in treating endoscopy-negative reflux disease. Future RCTs should aim to better classify patients with endoscopy-negative reflux disease, and to establish the role of alginates and PCABs in achieving symptom relief in both the short- and long-term.

Keywords: alginate; endoscopy-negative reflux disease; histamine-2-receptor antagonist; potassium-competitive acid blocker; proton pump inhibitor.


Conflict of interest statement

Brigida Barberio: None. Pierfrancesco Visaggi: None. Edoardo V Savarino: None. Nicola de Bortoli: None. Christopher J. Black: None. Alexander C. Ford: None. Guarantor of the article: EVS is guarantor.

Figures

FIGURE 1
FIGURE 1
Flow diagram of assessment of studies identified in the network meta‐analysis.
FIGURE 2
FIGURE 2
Network meta‐analysis of likelihood of failure to achieve complete relief of gastro‐esophageal reflux symptoms between ≥2 and <4 weeks of treatment. (A) Forest plot for failure to achieve complete relief of gastro‐esophageal reflux symptoms between ≥2 and <4 weeks of treatment. Treatments are reported in order of efficacy ranking according to P‐score. The P‐score is the probability of each treatment being ranked as best in terms of efficacy in the network. (B) Summary treatment effects from the network meta‐analysis for failure to achieve complete relief of gastro‐esophageal reflux symptoms between ≥2 and <4 weeks of treatment. League table of pairwise comparisons in the network meta‐analysis for the relative risk of failure to achieve complete relief of gastro‐esophageal reflux symptoms between ≥2 and <4 weeks of treatment. Relative risk with 95% confidence intervals in parentheses. Comparisons, column versus row, should be read from left to right, and are ordered relative to their overall efficacy. The treatment in the top left position is ranked as best after the network meta‐analysis of direct and indirect effects. Boxes highlighted in green indicate significant differences. Direct comparisons are provided above the drug labels, and indirect comparisons are below. N/A, not applicable, no RCTs making direct comparisons.
FIGURE 3
FIGURE 3
Network meta‐analysis of likelihood of failure to achieve adequate relief of gastro‐esophageal reflux symptoms between ≥2 and <4 weeks of treatment. (A) Forest plot for failure to achieve adequate relief of gastro‐esophageal reflux symptoms between ≥2 and <4 weeks of treatment. Treatments are reported in order of efficacy ranking according to P‐score. The P‐score is the probability of each treatment being ranked as best in terms of efficacy in the network. (B) Summary treatment effects from the network meta‐analysis for failure to achieve adequate relief of gastro‐esophageal reflux symptoms between ≥2 and <4 weeks of treatment. League table of pairwise comparisons in the network meta‐analysis for the relative risk of failure to achieve adequate relief of gastro‐esophageal reflux symptoms between ≥2 and <4 weeks of treatment. Relative risk with 95% confidence intervals in parentheses. Comparisons, column versus row, should be read from left to right, and are ordered relative to their overall efficacy. The treatment in the top left position is ranked as best after the network meta‐analysis of direct and indirect effects. Boxes highlighted in green indicate significant differences. Direct comparisons are provided above the drug labels, and indirect comparisons are below. N/A, not applicable, no RCTs making direct comparisons
FIGURE 4
FIGURE 4
Network meta‐analysis of likelihood of failure to achieve complete relief of gastro‐esophageal reflux symptoms at ≥4 weeks of treatment. (A) Forest plot for failure to achieve complete relief of gastro‐esophageal reflux symptoms at ≥4 weeks of treatment. Treatments are reported in order of efficacy ranking according to P‐score. The P‐score is the probability of each treatment being ranked as best in terms of efficacy in the network. (B) Summary treatment effects from the network meta‐analysis for failure to achieve complete relief of gastro‐esophageal reflux symptoms at ≥4 weeks of treatment. League table of pairwise comparisons in the network meta‐analysis for the relative risk of failure to achieve complete relief of gastro‐esophageal reflux symptoms at ≥4 weeks of treatment. Relative risk with 95% confidence intervals in parentheses. Comparisons, column versus row, should be read from left to right, and are ordered relative to their overall efficacy. The treatment in the top left position is ranked as best after the network meta‐analysis of direct and indirect effects. Boxes highlighted in green indicate significant differences. Direct comparisons are provided above the drug labels, and indirect comparisons are below. N/A, not applicable, no RCTs making direct comparisons
FIGURE 5
FIGURE 5
Network meta‐analysis of likelihood of failure to achieve adequate relief of gastro‐esophageal reflux symptoms at ≥4 weeks of treatment. (A) Forest plot for failure to achieve adequate relief of gastro‐esophageal reflux symptoms at ≥4 weeks of treatment. Treatments are reported in order of efficacy ranking according to P‐score. The P‐score is the probability of each treatment being ranked as best in terms of efficacy in the network. (B) Summary treatment effects from the network meta‐analysis for failure to achieve adequate relief of gastro‐esophageal reflux symptoms at ≥4 weeks of treatment. League table of pairwise comparisons in the network meta‐analysis for the relative risk of failure to achieve adequate relief of gastro‐esophageal reflux symptoms at ≥4 weeks of treatment. Relative risk with 95% confidence intervals in parentheses. Comparisons, column versus row, should be read from left to right, and are ordered relative to their overall efficacy. The treatment in the top left position is ranked as best after the network meta‐analysis of direct and indirect effects. Boxes highlighted in green indicate significant differences. Direct comparisons are provided above the drug labels, and indirect comparisons are below. N/A, not applicable, no RCTs making direct comparisons.

References

    1. Vakil N, Van Zanten SV, Kahrilas P, et al. The Montreal definition and classification of gastroesophageal reflux disease: a global evidence‐based consensus. Am J Gastroenterol. 2006;101:1900‐1920. - PubMed
    1. Becher A, Dent J. Systematic review: ageing and gastro‐oesophageal reflux disease symptoms, oesophageal function and reflux oesophagitis. Aliment Pharmacol Ther. 2011;33:442‐454. - PubMed
    1. Hungin APS, Raghunath AS, Wiklund I. Beyond heartburn: a systematic review of the extra‐oesophageal spectrum of reflux‐induced disease. Fam Pract. 2005;22:591‐603. - PubMed
    1. Richter JE, Rubenstein JH. Presentation and epidemiology of gastroesophageal reflux disease. Gastroenterology. 2018;154:267‐276. - PMC - PubMed
    1. Eusebi LH, Telese A, Cirota GG, et al. Systematic review with meta‐analysis: risk factors for Barrett's oesophagus in individuals with gastro‐oesophageal reflux symptoms. Aliment Pharmacol Ther. 2021;53:968‐976. - PubMed

Publication types