

The pH Robustness of Bacterial Sensing
- PMID: 36154178
- PMCID: PMC9600550
- DOI: 10.1128/mbio.01650-22
The pH Robustness of Bacterial Sensing
Abstract
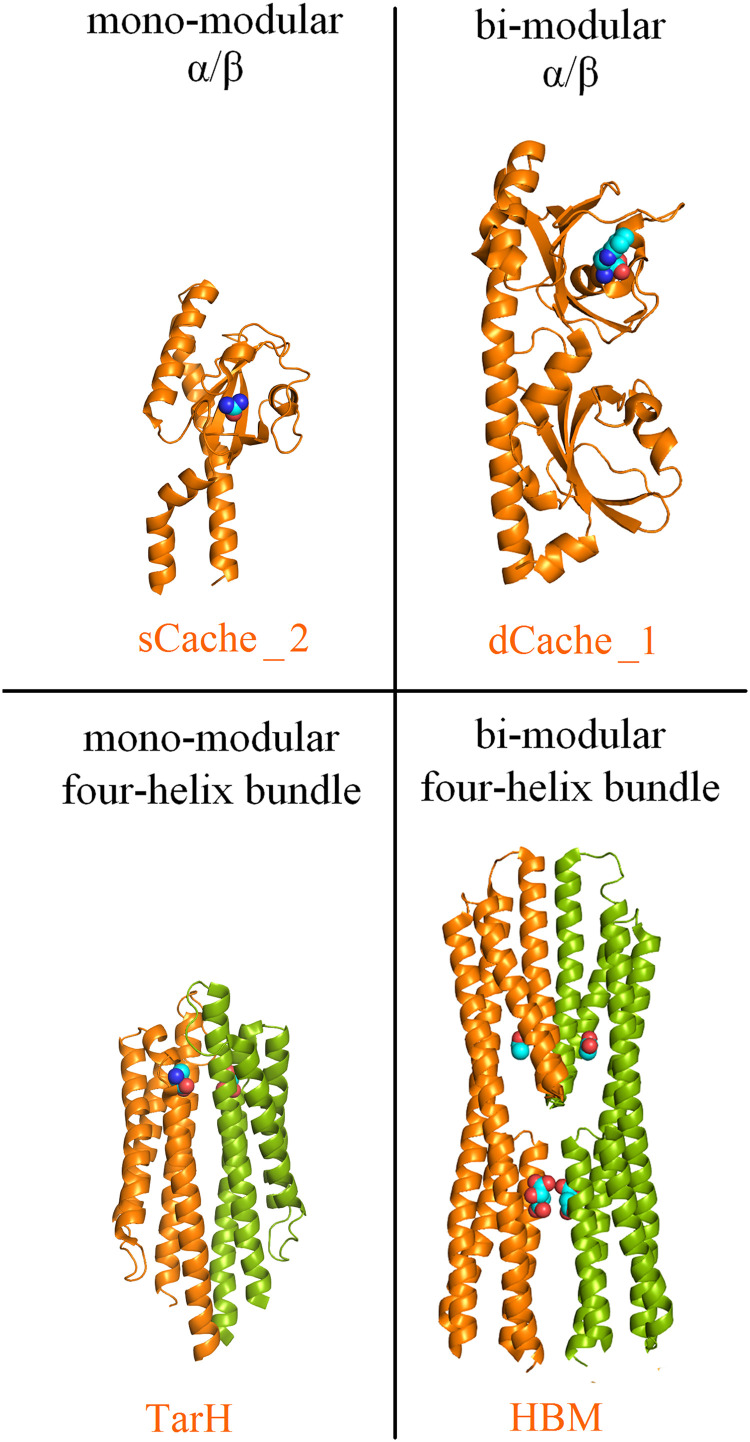
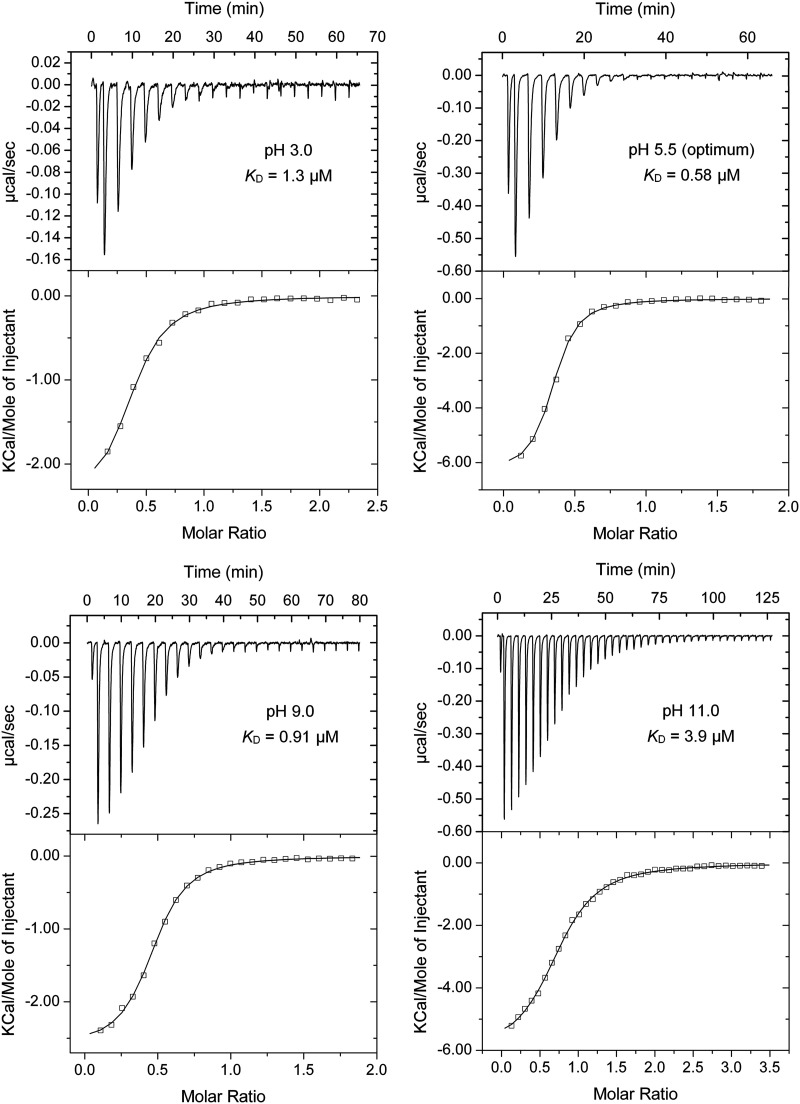
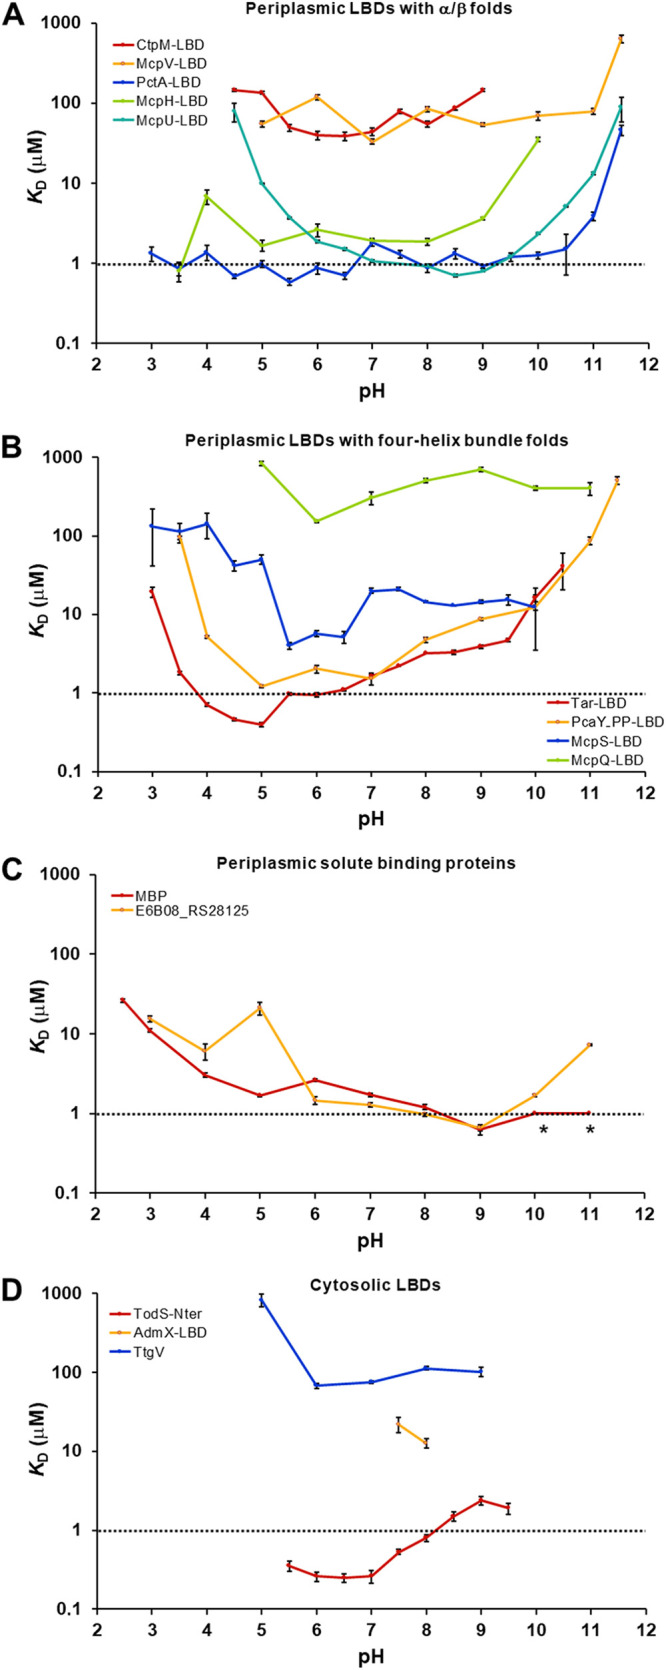
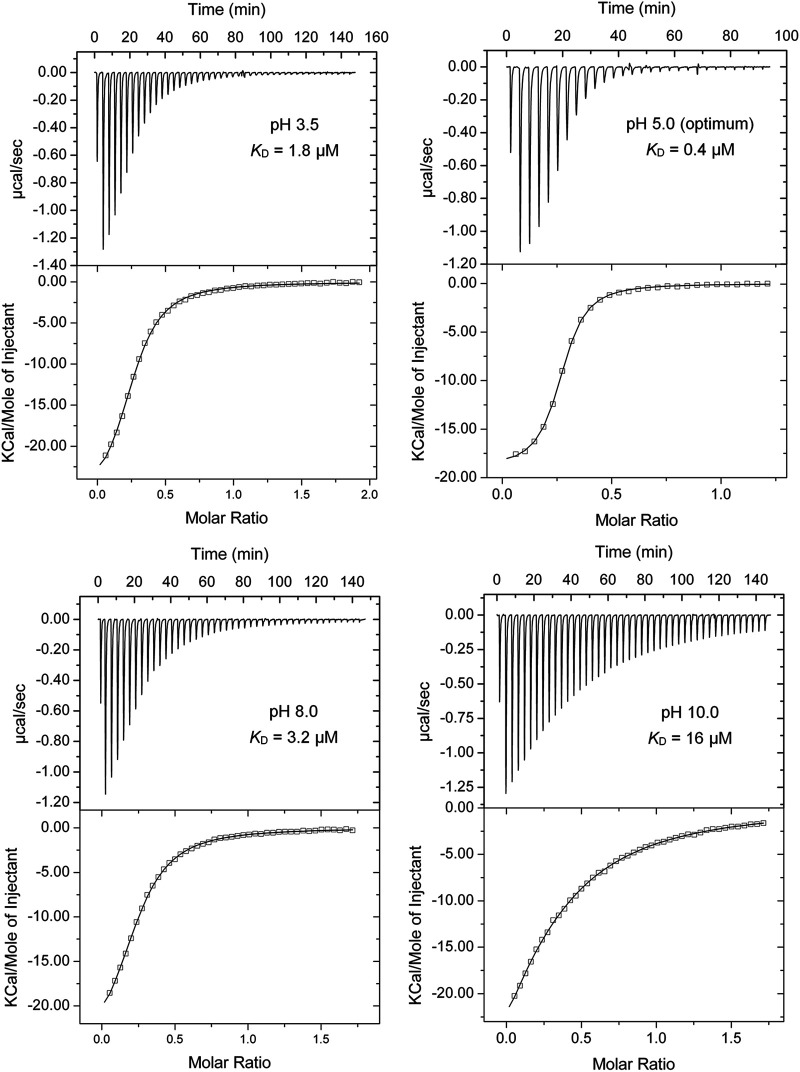
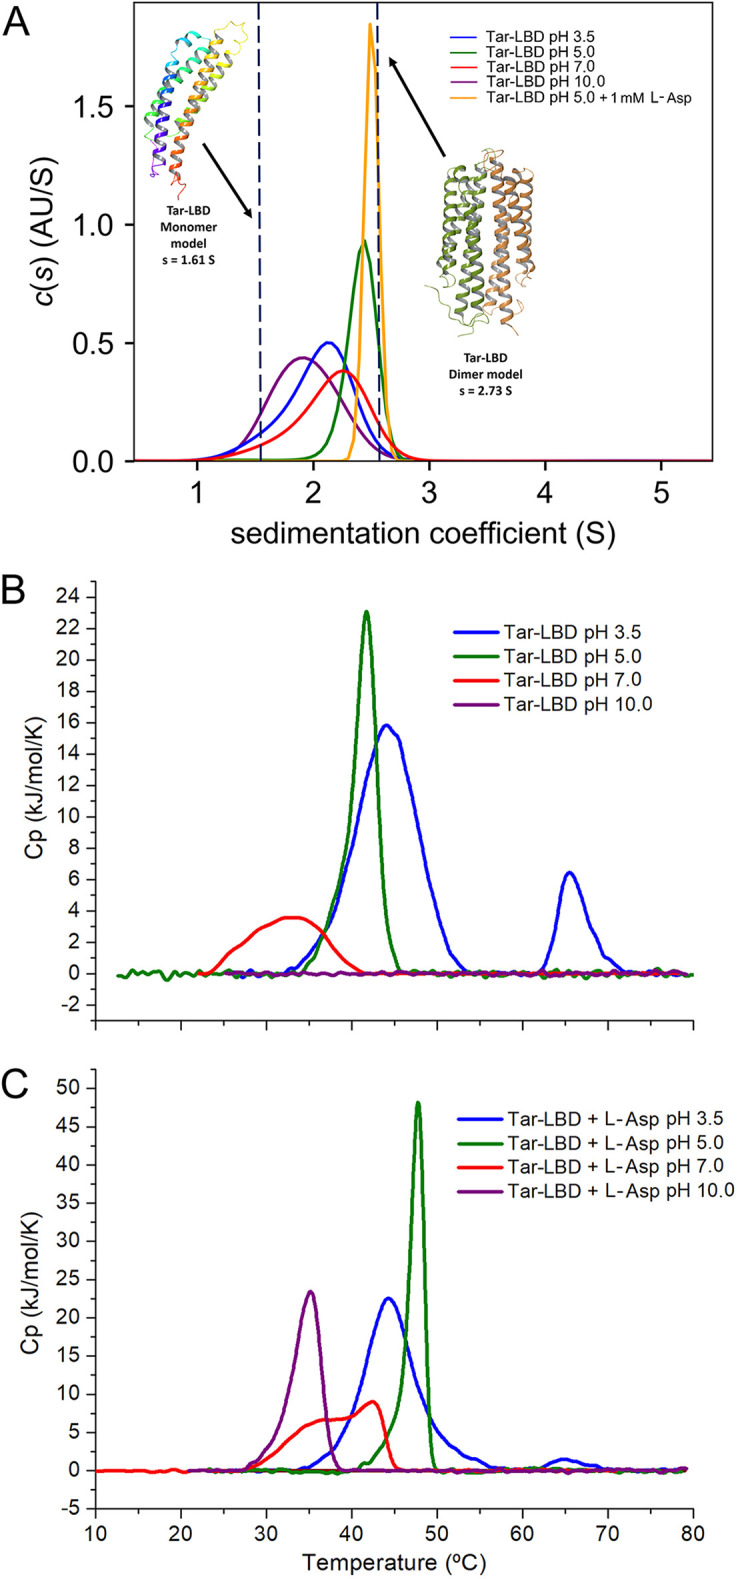
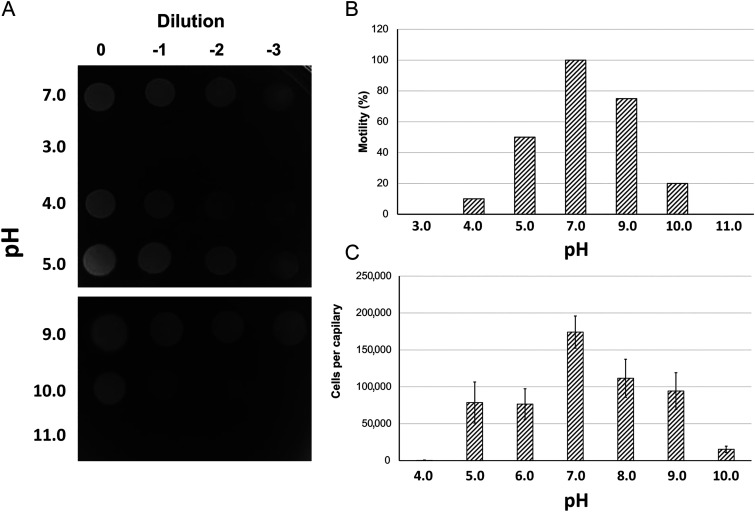
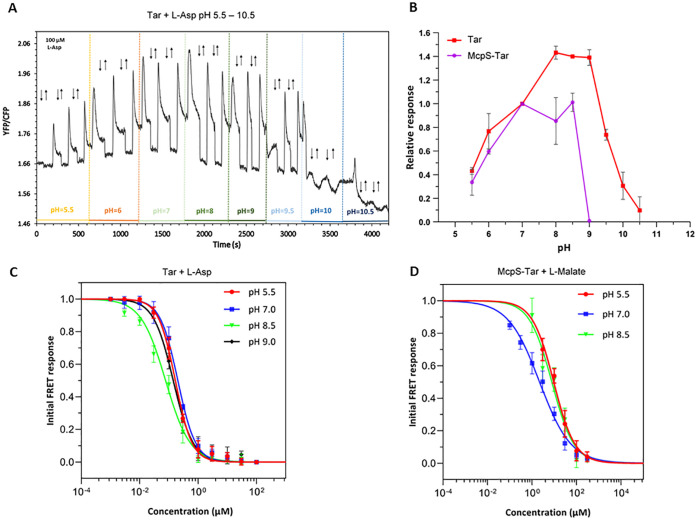
Bacteria have evolved many different signal transduction systems to sense and respond to changing environmental conditions. Signal integration is mainly achieved by signal recognition at extracytosolic ligand-binding domains (LBDs) of receptors. Hundreds of different LBDs have been reported, and our understanding of their sensing properties is growing. Receptors must function over a range of environmental pH values, but there is little information available on the robustness of sensing as a function of pH. Here, we have used isothermal titration calorimetry to determine the pH dependence of ligand recognition by nine LBDs that cover all major LBD superfamilies, of periplasmic solute-binding proteins, and cytosolic LBDs. We show that periplasmic LBDs recognize ligands over a very broad pH range, frequently stretching over eight pH units. This wide pH range contrasts with a much narrower pH response range of the cytosolic LBDs analyzed. Many LBDs must be dimeric to bind ligands, and analytical ultracentrifugation studies showed that the LBD of the Tar chemoreceptor forms dimers over the entire pH range tested. The pH dependences of Pseudomonas aeruginosa motility and chemotaxis were bell-shaped and centered at pH 7.0. Evidence for pH robustness of signaling in vivo was obtained by Förster Resonance Energy Transfer (FRET) measurements of the chemotaxis pathway responses in Escherichia coli. Bacteria have evolved several strategies to cope with extreme pH, such as periplasmic chaperones for protein refolding. The intrinsic pH resistance of periplasmic LBDs appears to be another strategy that permits bacteria to survive under adverse conditions. IMPORTANCE Demonstration of the pH robustness of extracytoplasmic sensing reveals a previously undescribed evolutionary mechanism that enables bacteria to monitor environmental changes under changing conditions. This mechanism includes the maintenance of the dimeric state of four-helixbundle ligand-binding domains (LBDs). The construction of biosensors is a rapidly growing field of research, and their use to monitor the progression of the COVID-19 pandemic has impressively demonstrated their usefulness. LBDs represent an enormous reservoir of binding modules that can be used to create novel biosensors. Among ligands recognized by LBDs are neurotransmitters, hormones, and quorum-sensing signals. The demonstration that extracytosolic LBDs bind their signals over a wide range of pH values will facilitate the design of biosensors that function under highly variable conditions of acidity and alkalinity.
Keywords: bacterial adaptation; pH; pH robustness; receptors; sensing; sensor domains; signal transduction.
Conflict of interest statement
The authors declare no conflict of interest.
Figures
Similar articles
-
Sensory Repertoire of Bacterial Chemoreceptors.Microbiol Mol Biol Rev. 2017 Oct 25;81(4):e00033-17. doi: 10.1128/MMBR.00033-17. Print 2017 Dec. Microbiol Mol Biol Rev. 2017. PMID: 29070658 Free PMC article. Review.
-
High-Throughput Screening to Identify Chemoreceptor Ligands.Methods Mol Biol. 2018;1729:291-301. doi: 10.1007/978-1-4939-7577-8_23. Methods Mol Biol. 2018. PMID: 29429099
-
The Molecular Mechanism of Nitrate Chemotaxis via Direct Ligand Binding to the PilJ Domain of McpN.mBio. 2019 Feb 19;10(1):e02334-18. doi: 10.1128/mBio.02334-18. mBio. 2019. PMID: 30782655 Free PMC article.
-
Structure of a double CACHE chemoreceptor ligand-binding domain from Pseudomonas syringae provides insights into the basis of proline recognition.Biochem Biophys Res Commun. 2021 Apr 16;549:194-199. doi: 10.1016/j.bbrc.2021.02.090. Epub 2021 Mar 12. Biochem Biophys Res Commun. 2021. PMID: 33721671
-
Identification of ligands for bacterial sensor proteins.Curr Genet. 2016 Feb;62(1):143-7. doi: 10.1007/s00294-015-0528-4. Epub 2015 Oct 28. Curr Genet. 2016. PMID: 26511375 Review.
Cited by
-
Enhancement of acid tolerance of Escherichia coli by introduction of molecule chaperone CbpA from extremophile.World J Microbiol Biotechnol. 2023 Apr 13;39(6):158. doi: 10.1007/s11274-023-03613-4. World J Microbiol Biotechnol. 2023. PMID: 37046107
-
The dCache Domain of the Chemoreceptor Tlp1 in Campylobacter jejuni Binds and Triggers Chemotaxis toward Formate.mBio. 2023 Jun 27;14(3):e0356422. doi: 10.1128/mbio.03564-22. Epub 2023 Apr 13. mBio. 2023. PMID: 37052512 Free PMC article.
-
Structural and functional diversity of sensor domains in bacterial transmembrane receptors.Trends Microbiol. 2025 Jul;33(7):796-809. doi: 10.1016/j.tim.2025.02.019. Epub 2025 Mar 21. Trends Microbiol. 2025. PMID: 40121131 Review.
-
Diverse Sensory Repertoire of Paralogous Chemoreceptors Tlp2, Tlp3, and Tlp4 in Campylobacter jejuni.Microbiol Spectr. 2022 Dec 21;10(6):e0364622. doi: 10.1128/spectrum.03646-22. Epub 2022 Nov 14. Microbiol Spectr. 2022. PMID: 36374080 Free PMC article.
-
Environment signal dependent biocontainment systems for engineered organisms: Leveraging triggered responses and combinatorial systems.Synth Syst Biotechnol. 2024 Dec 20;10(2):356-364. doi: 10.1016/j.synbio.2024.12.005. eCollection 2025 Jun. Synth Syst Biotechnol. 2024. PMID: 39830078 Free PMC article. Review.
References
Publication types
MeSH terms
Substances
LinkOut - more resources
Full Text Sources
Medical
Molecular Biology Databases
