

Human Plasma Proteome During Normal Pregnancy
- PMID: 36154181
- PMCID: PMC10445406
- DOI: 10.1021/acs.jproteome.2c00391
Human Plasma Proteome During Normal Pregnancy
Abstract
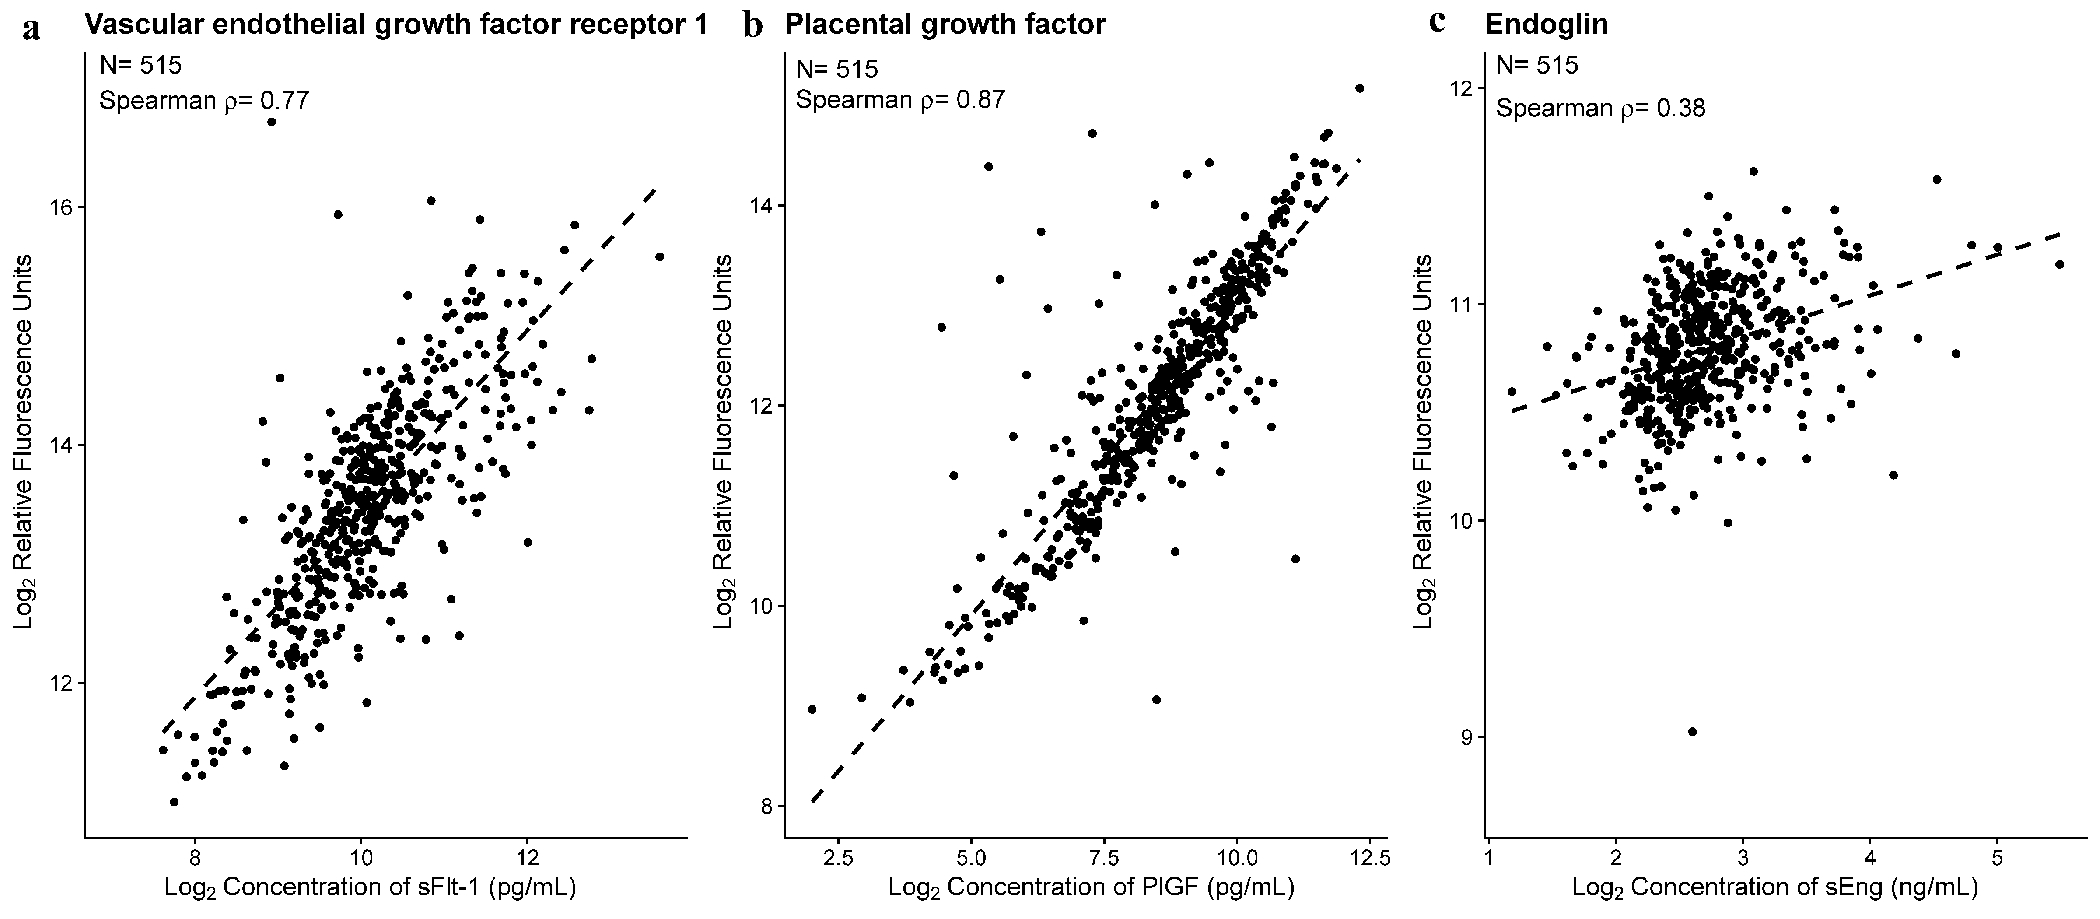
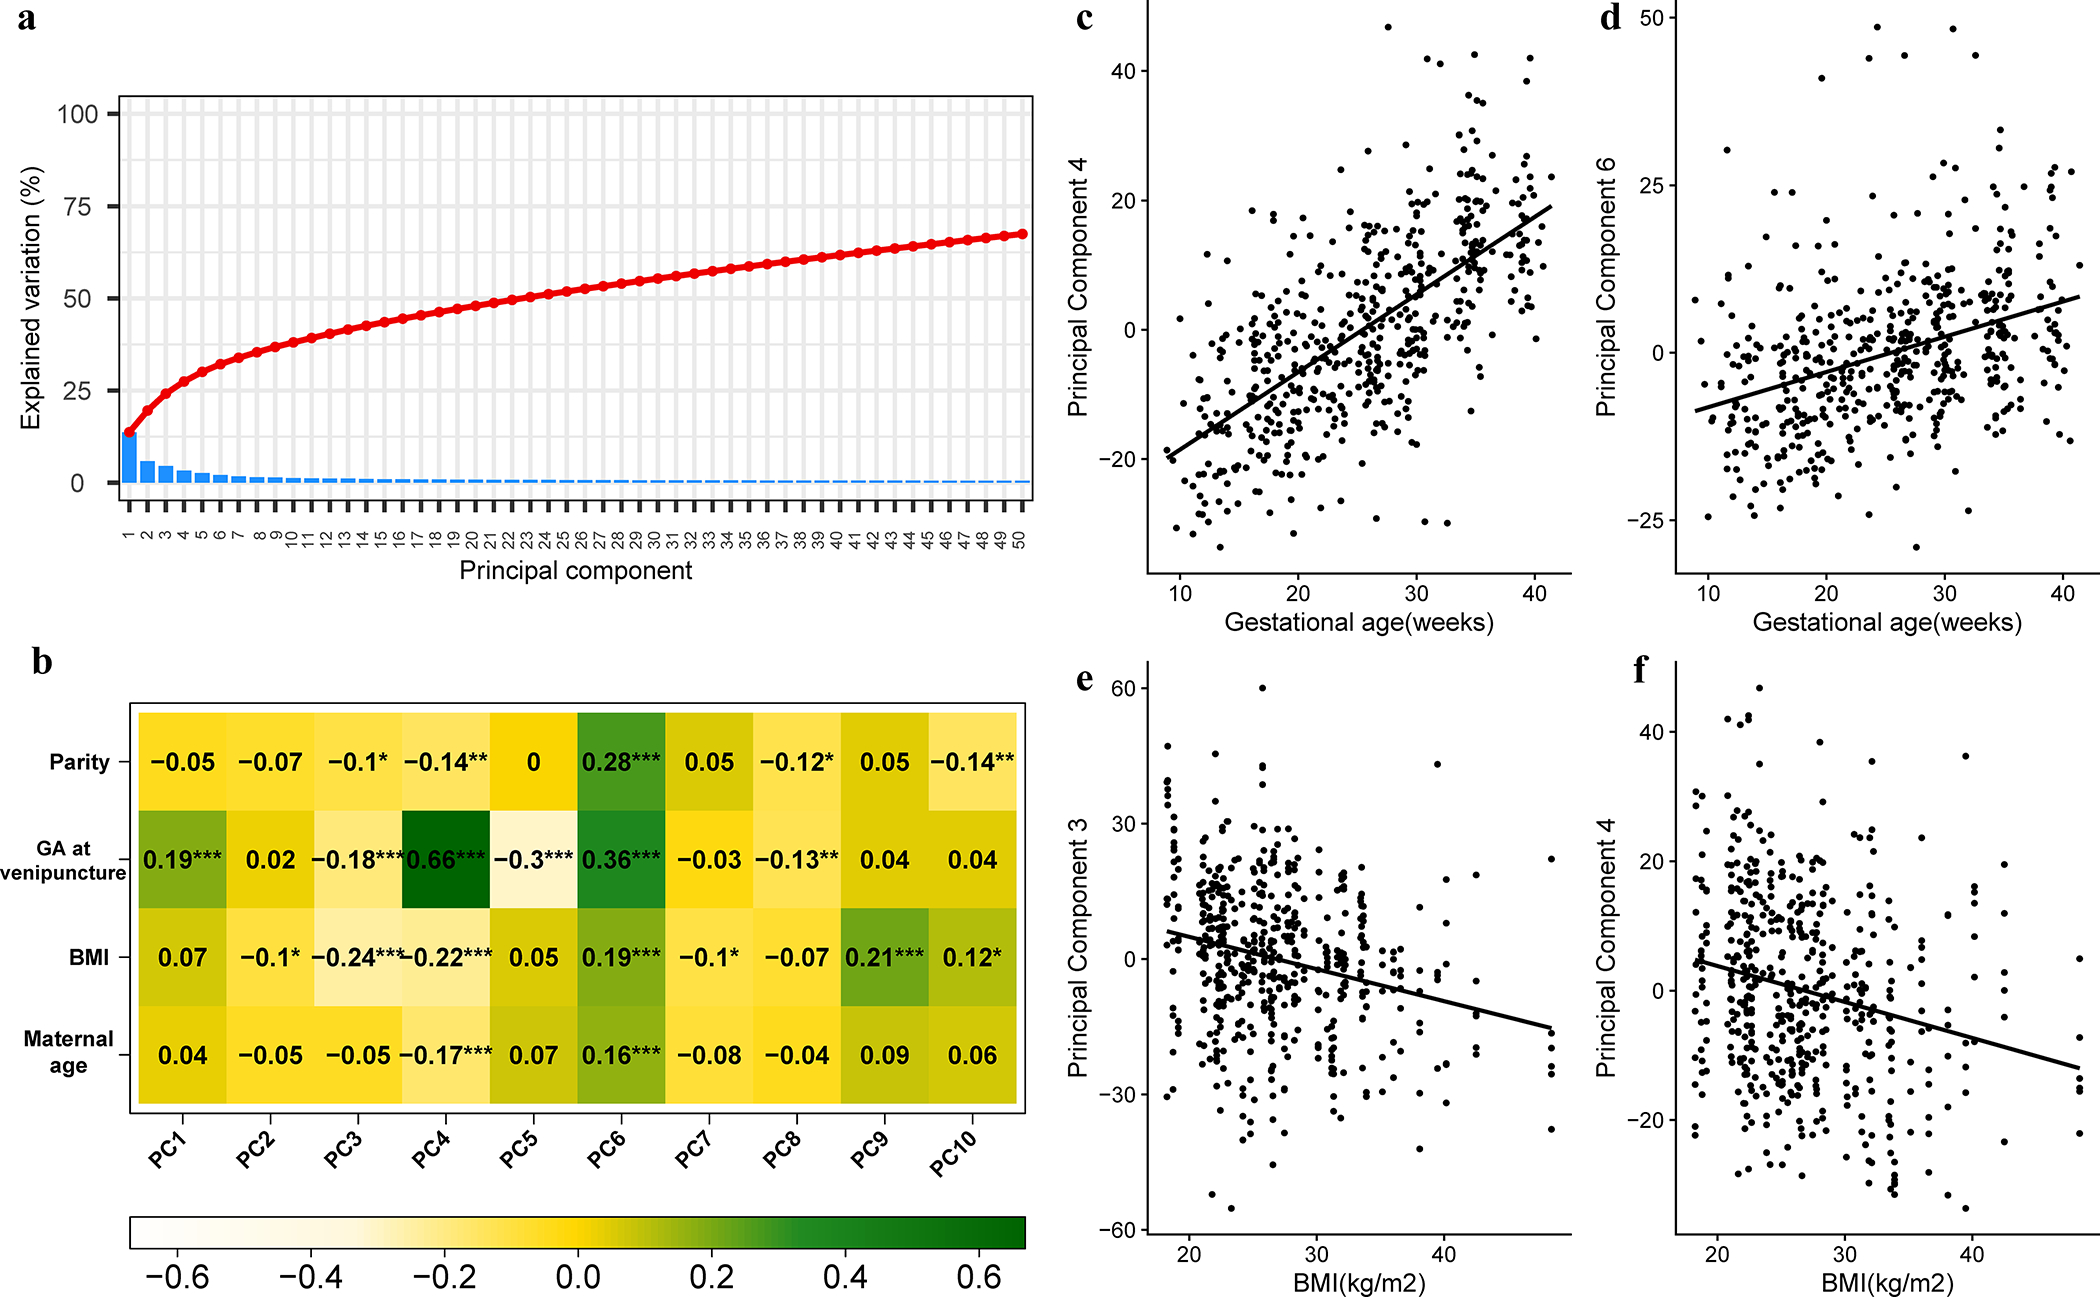
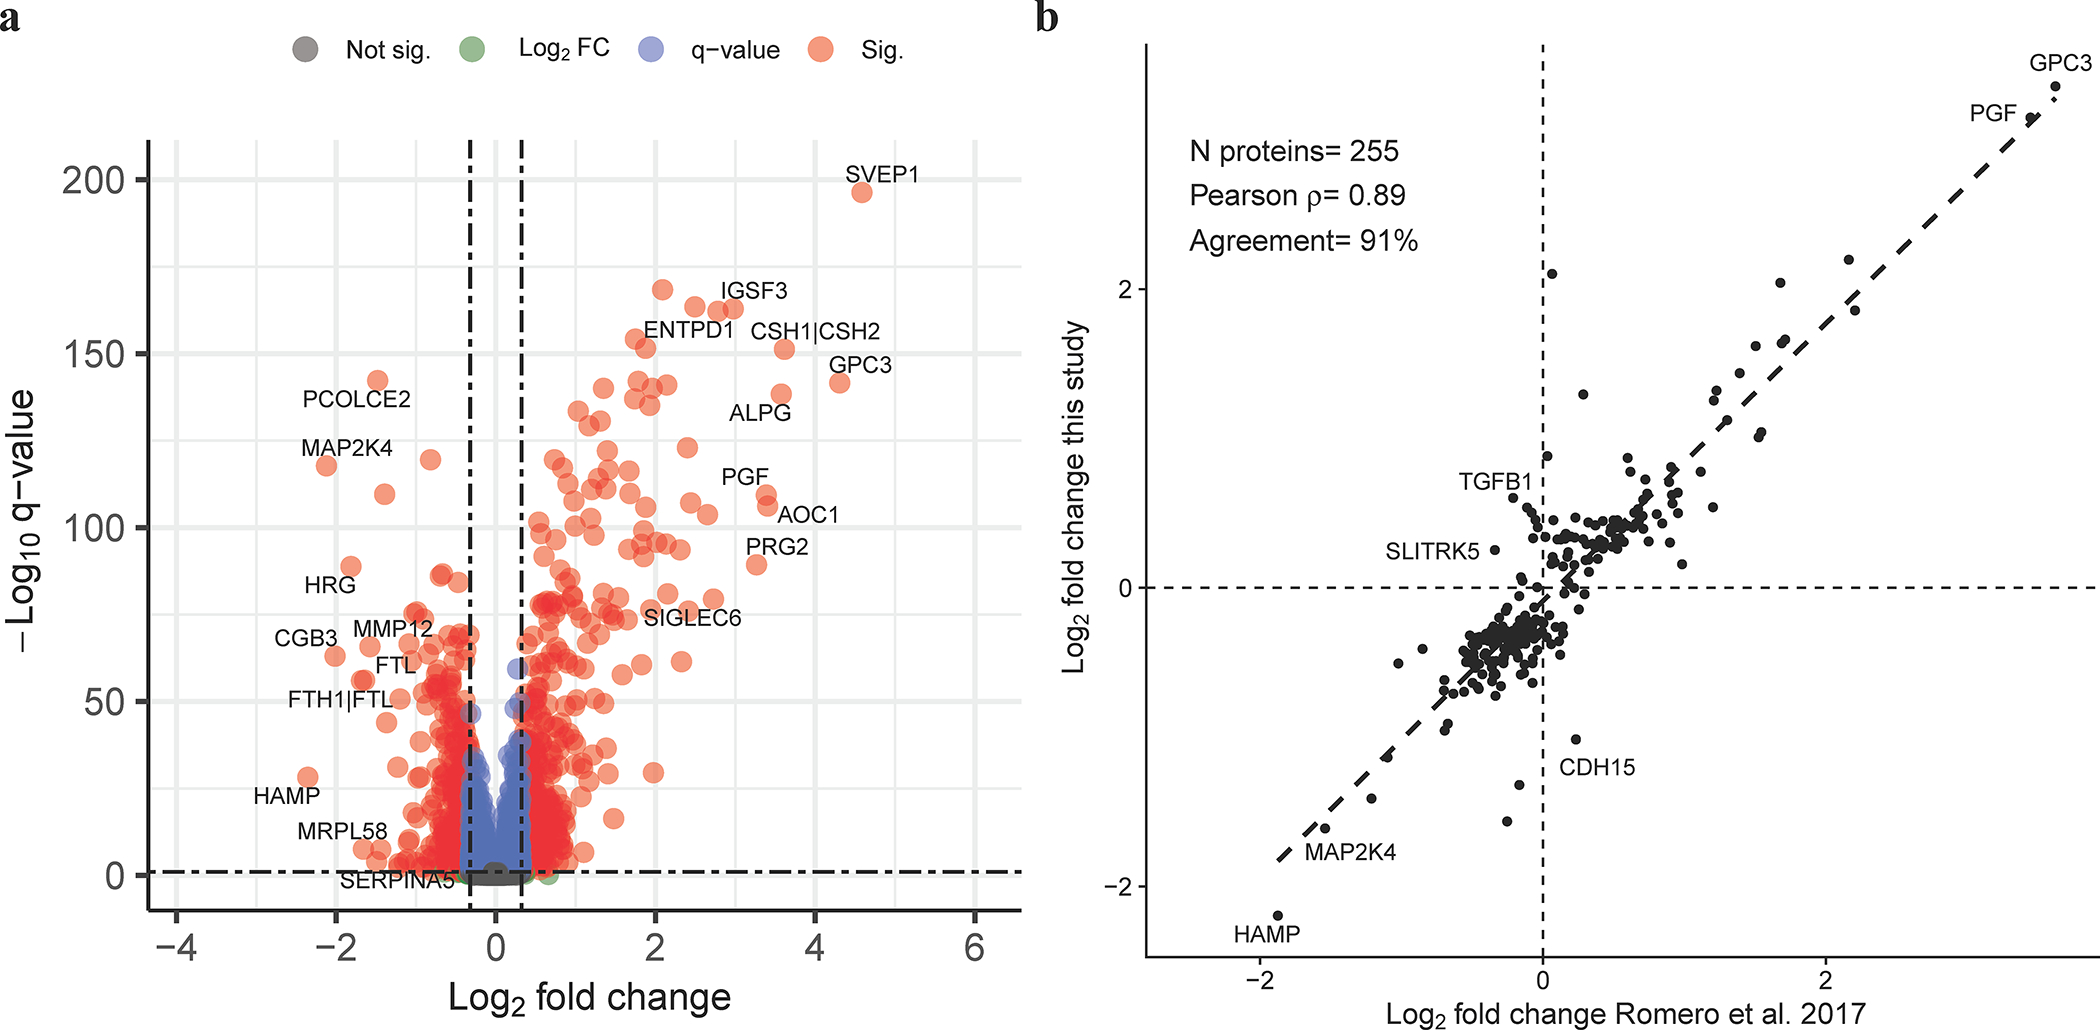
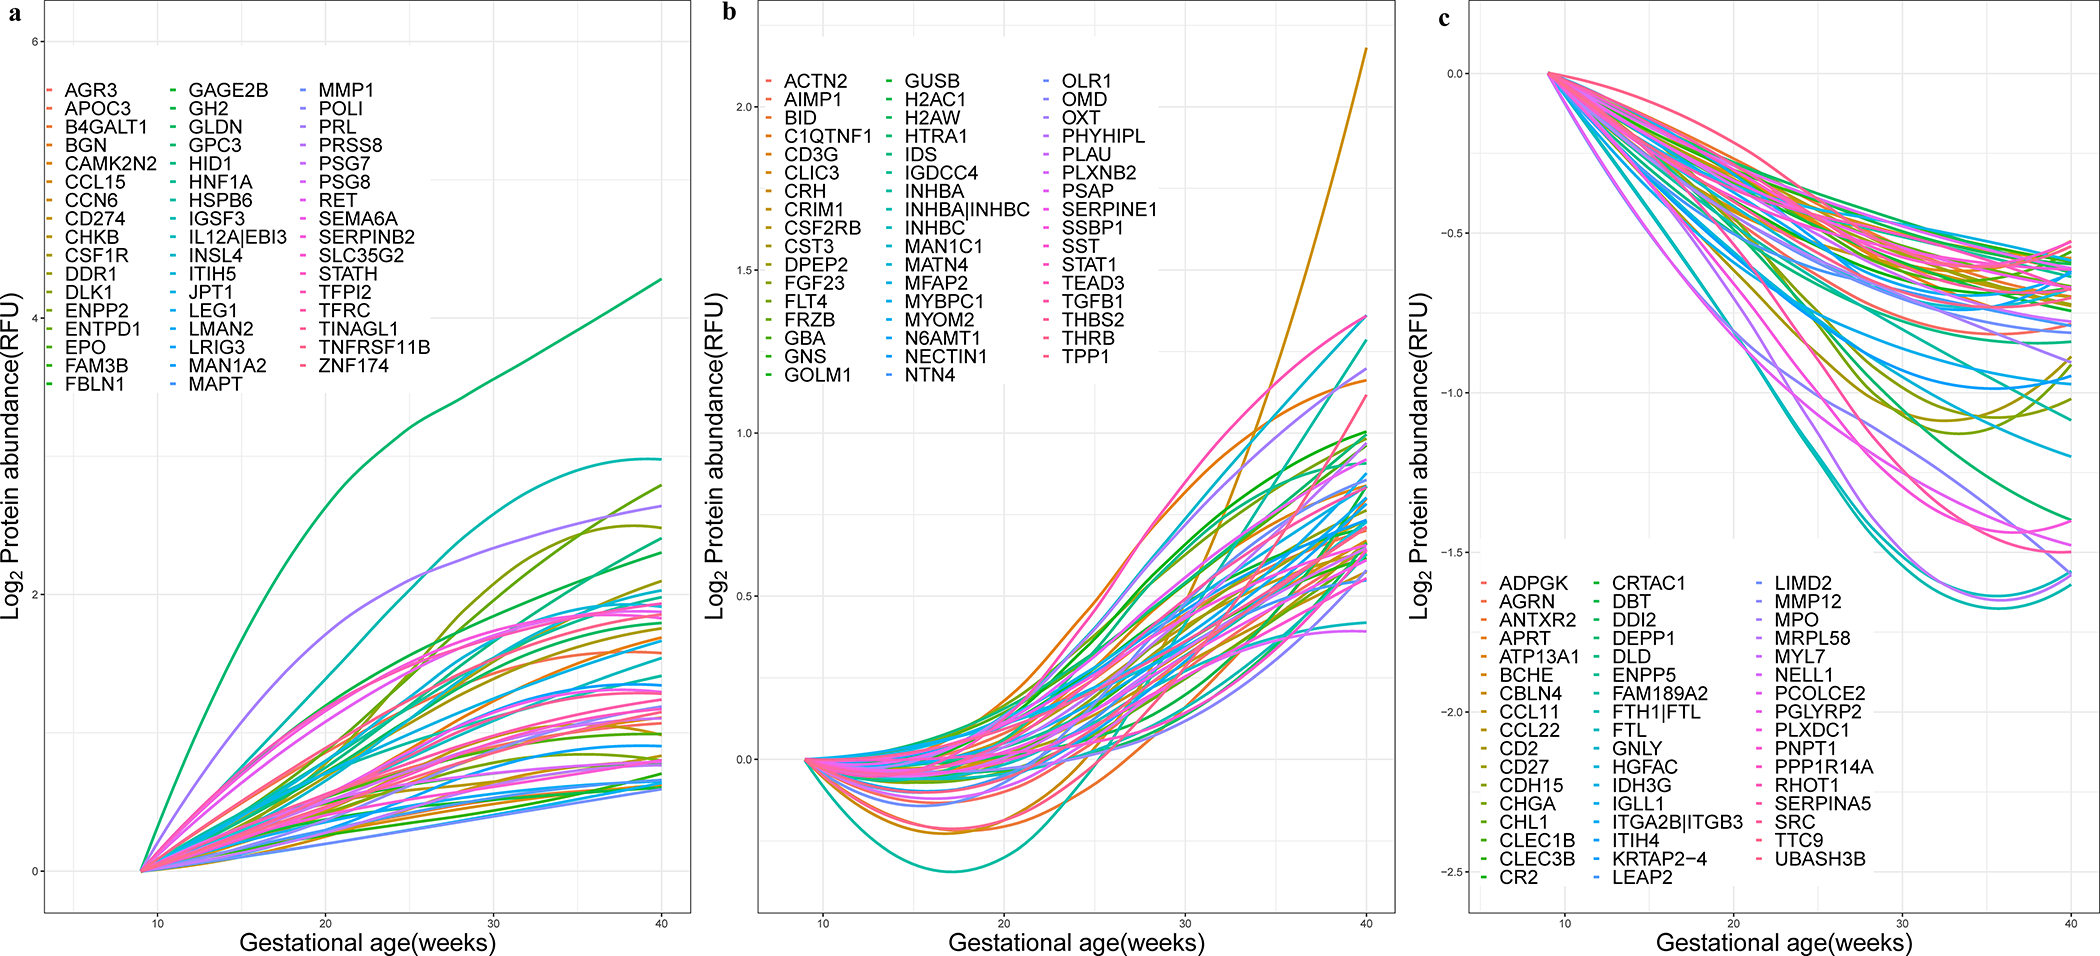
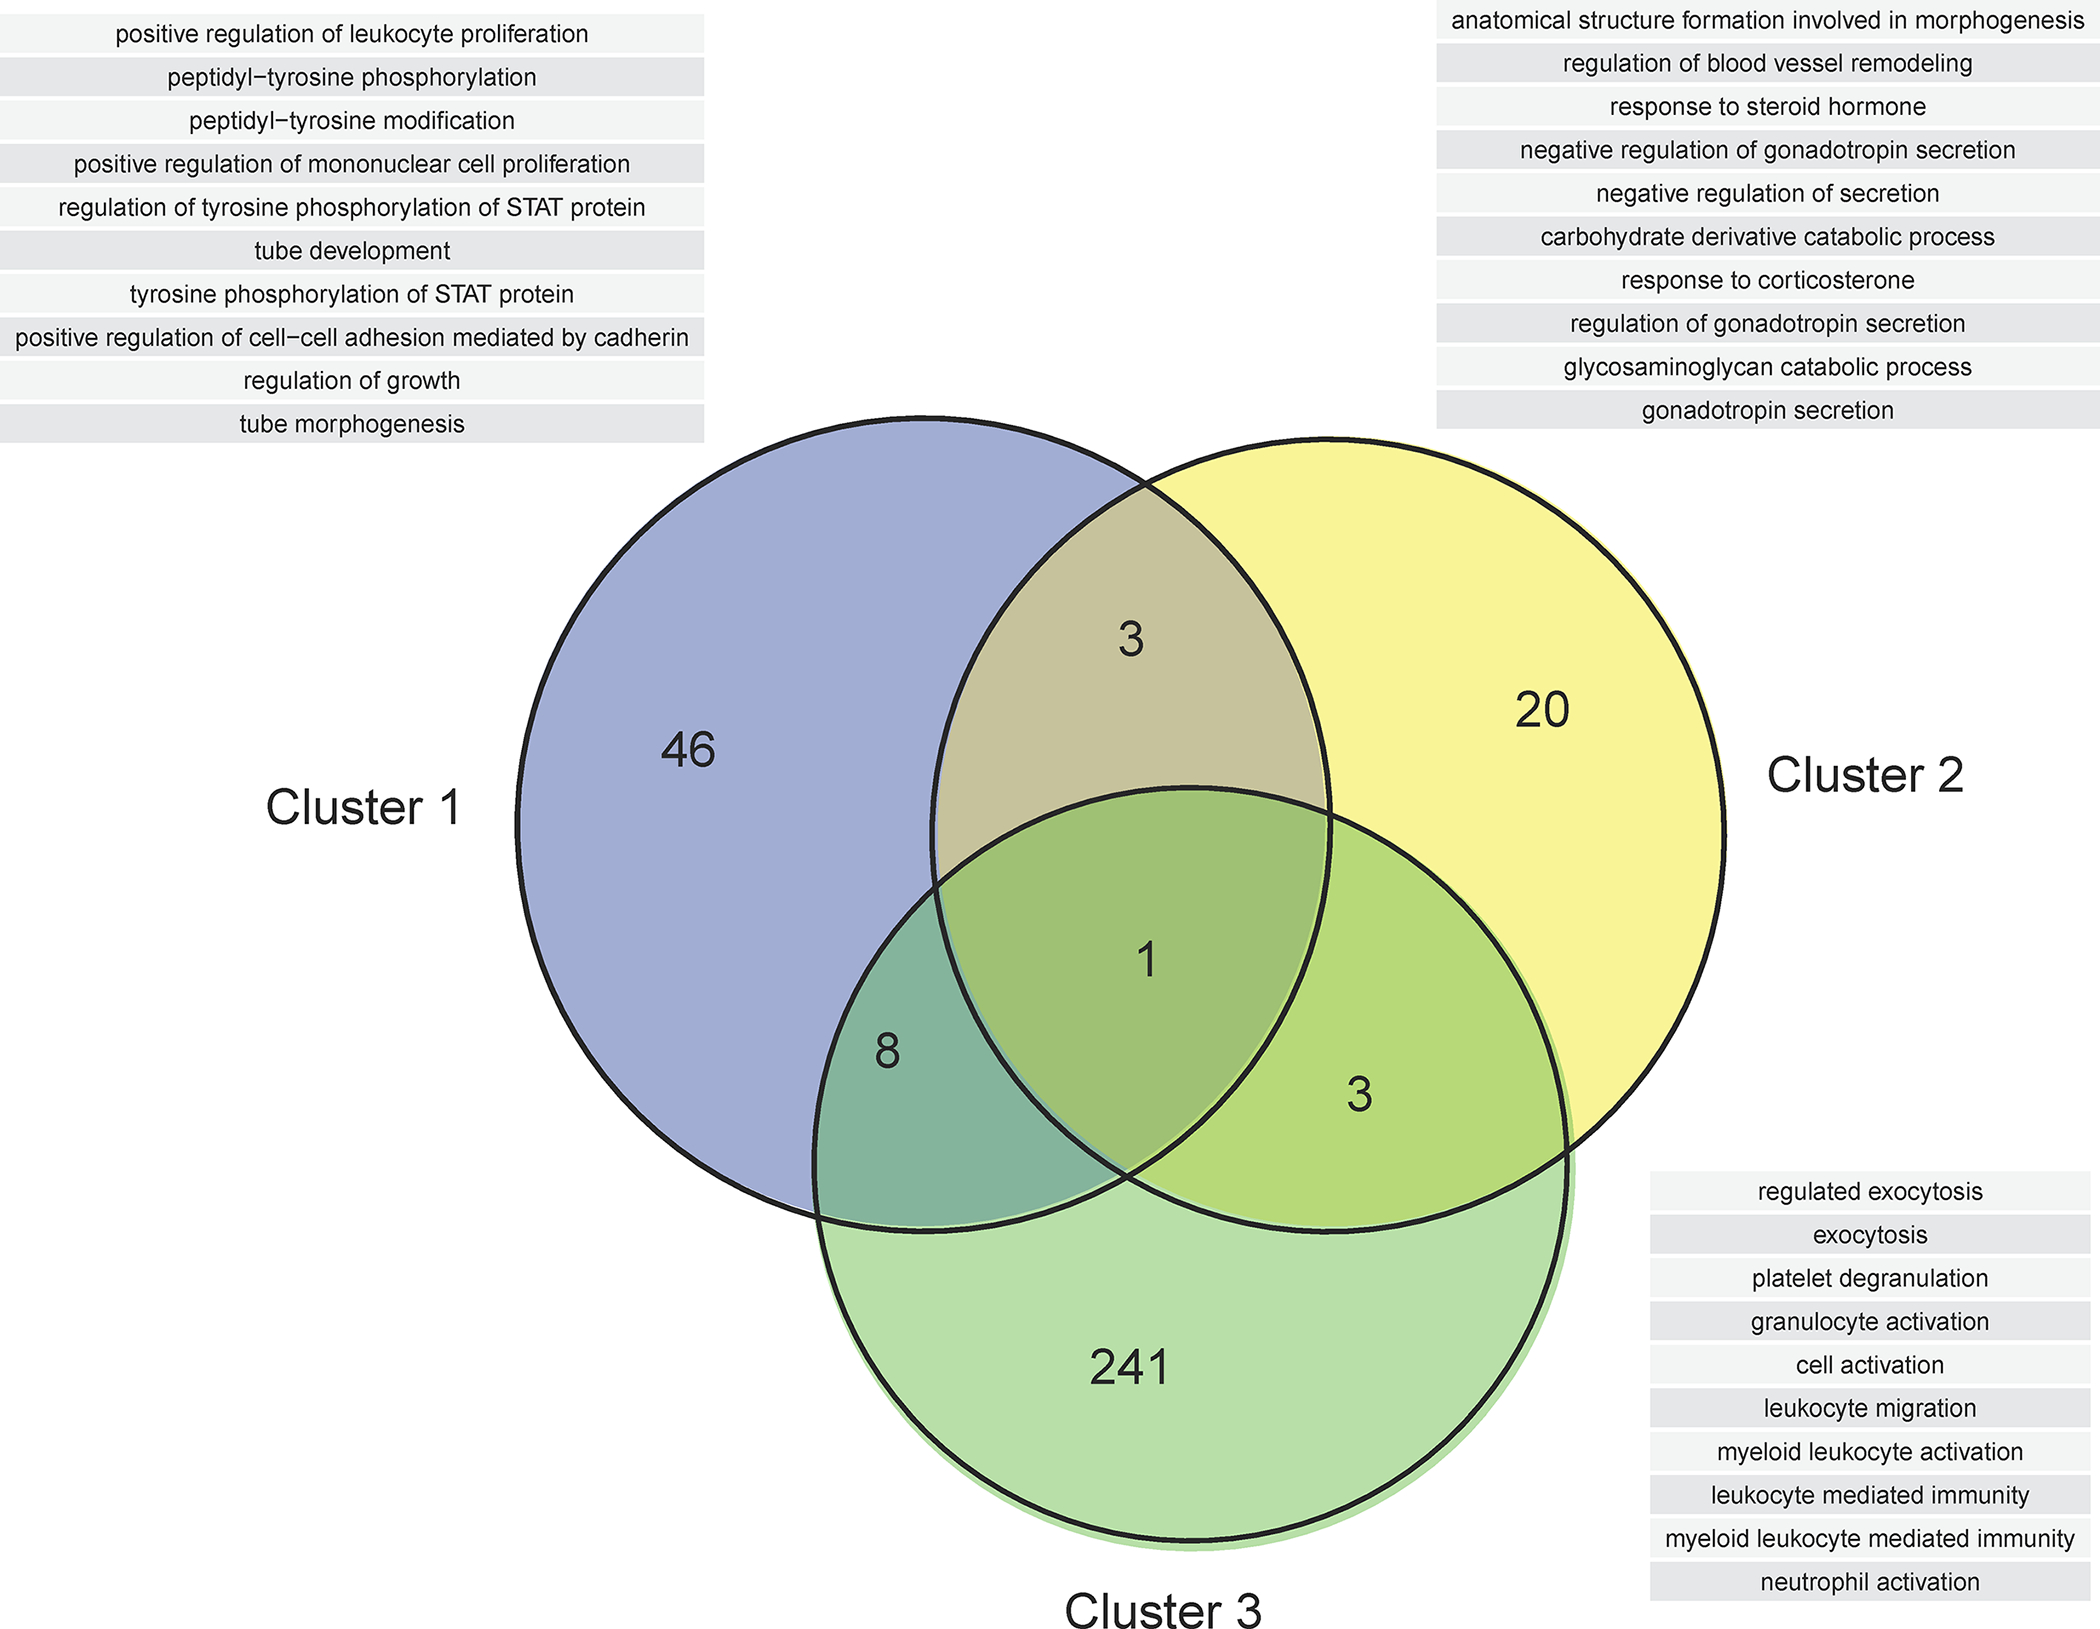
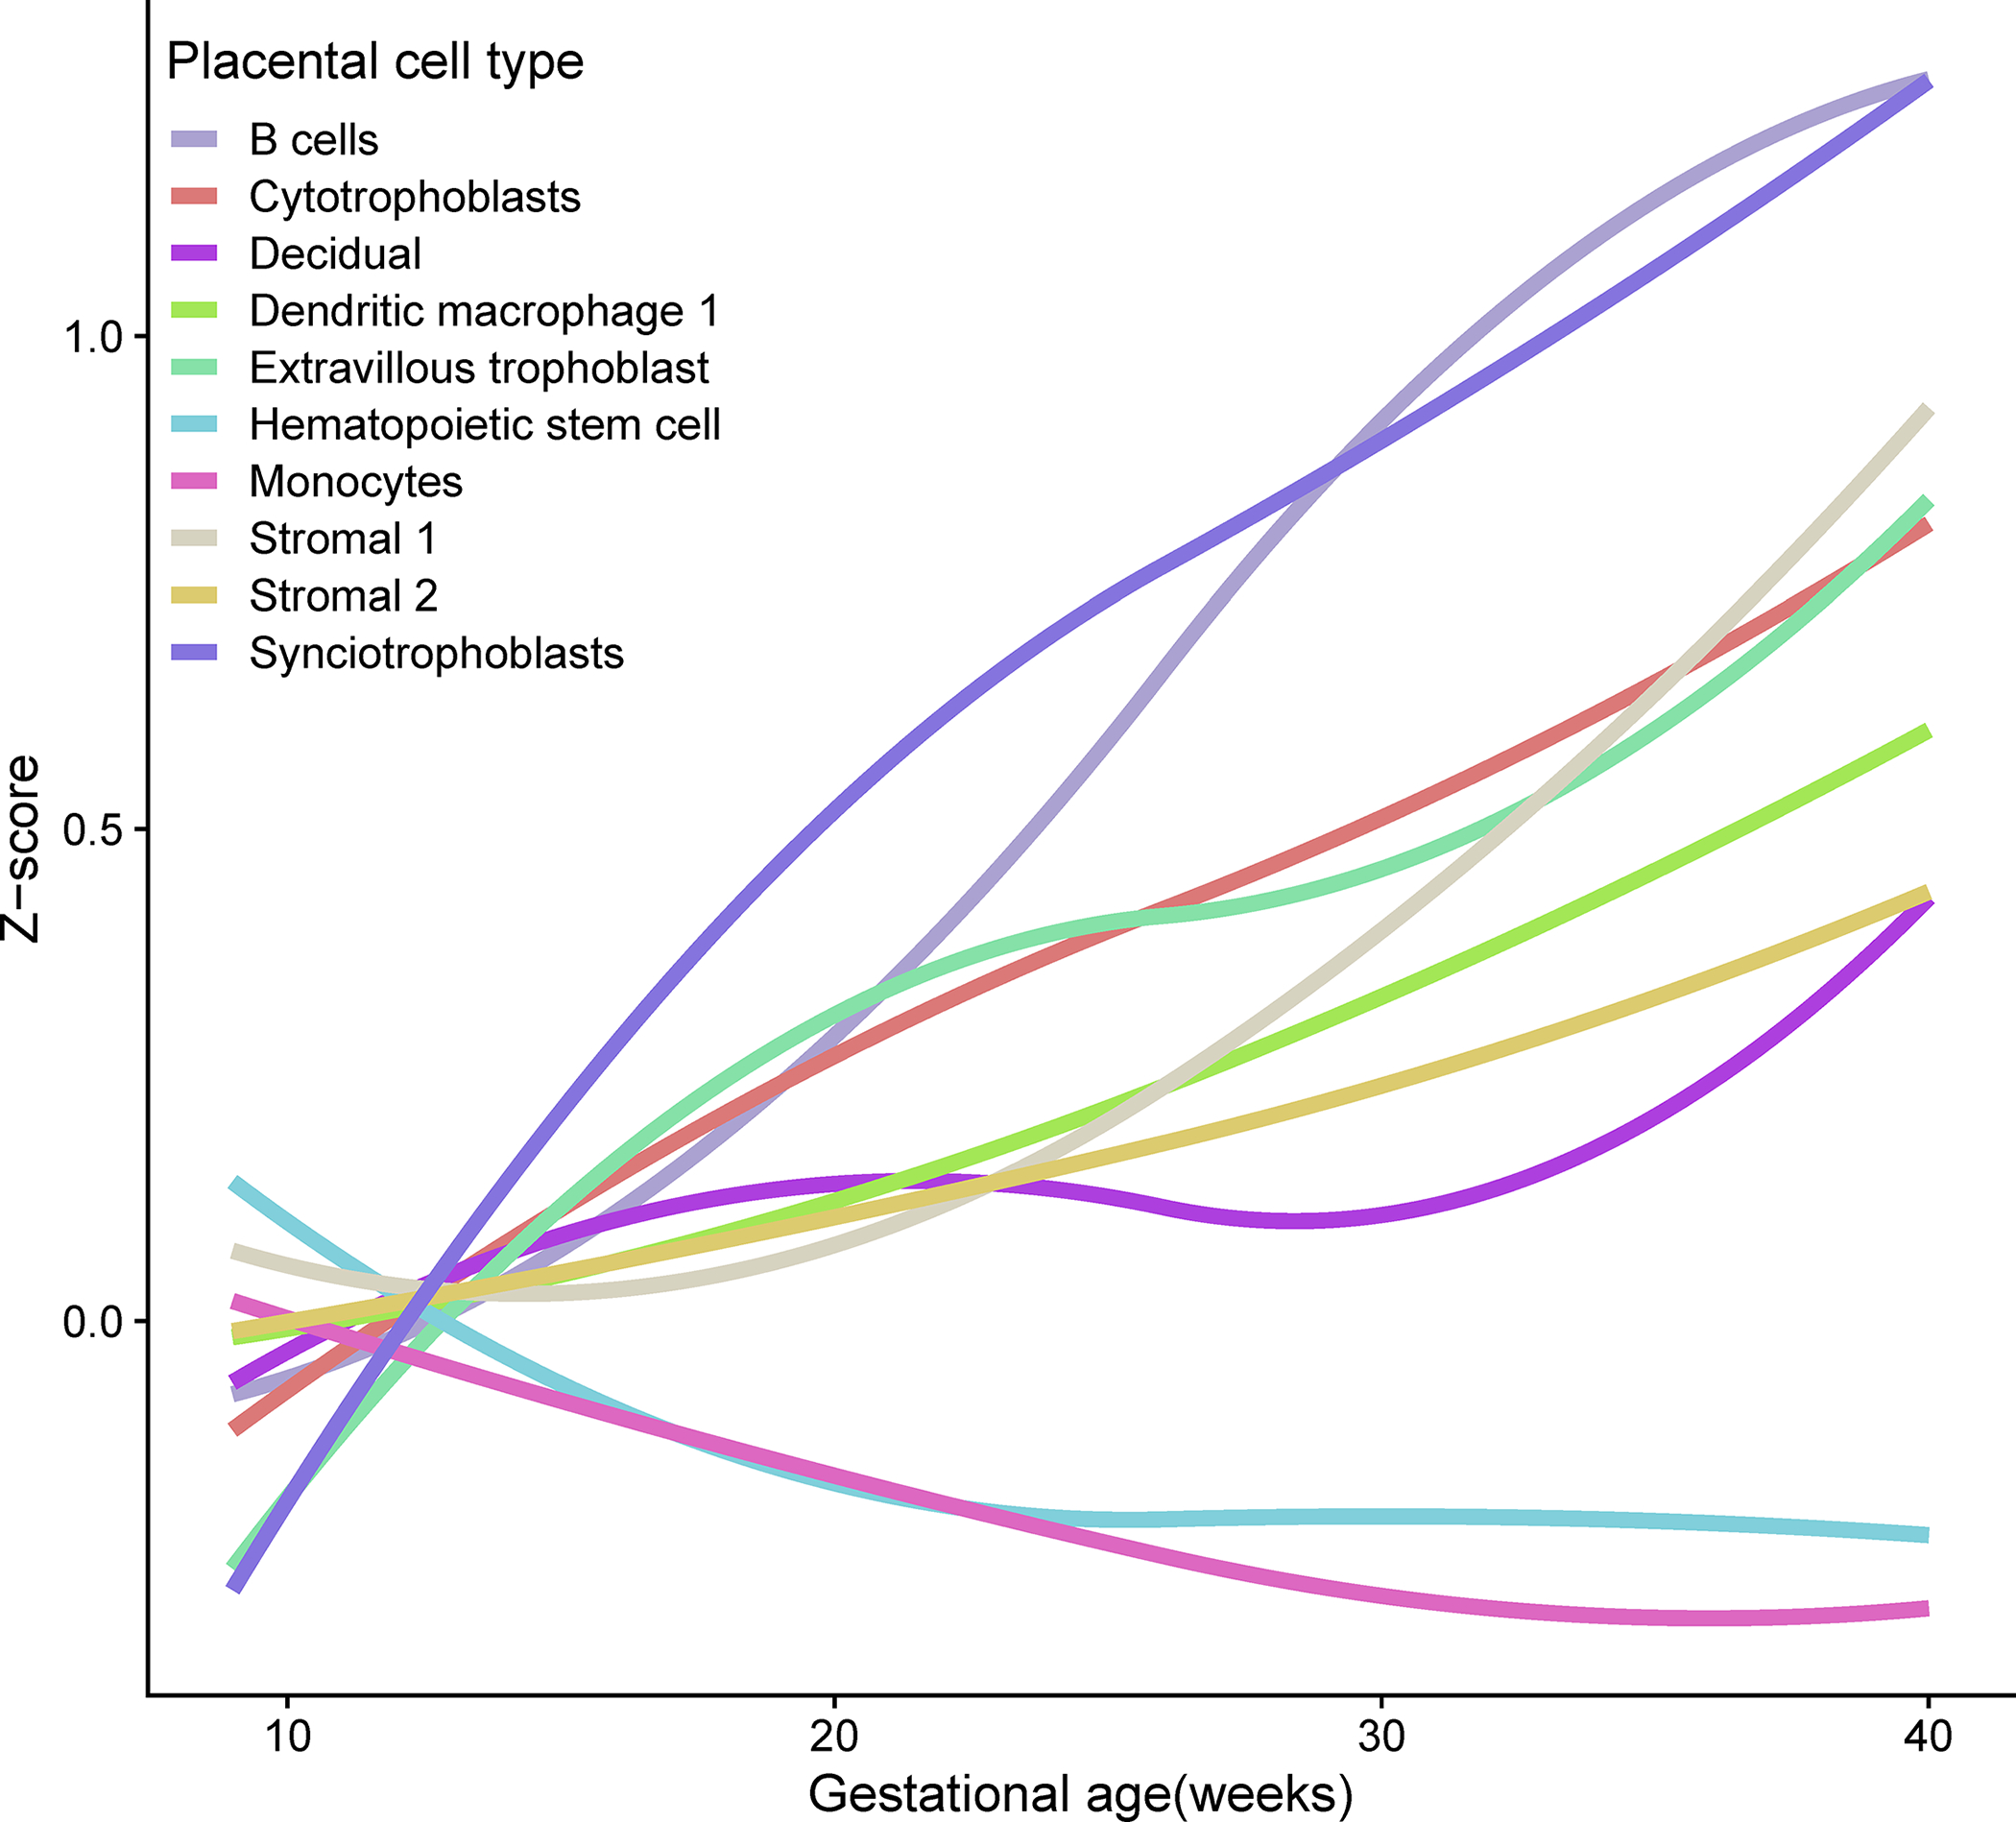
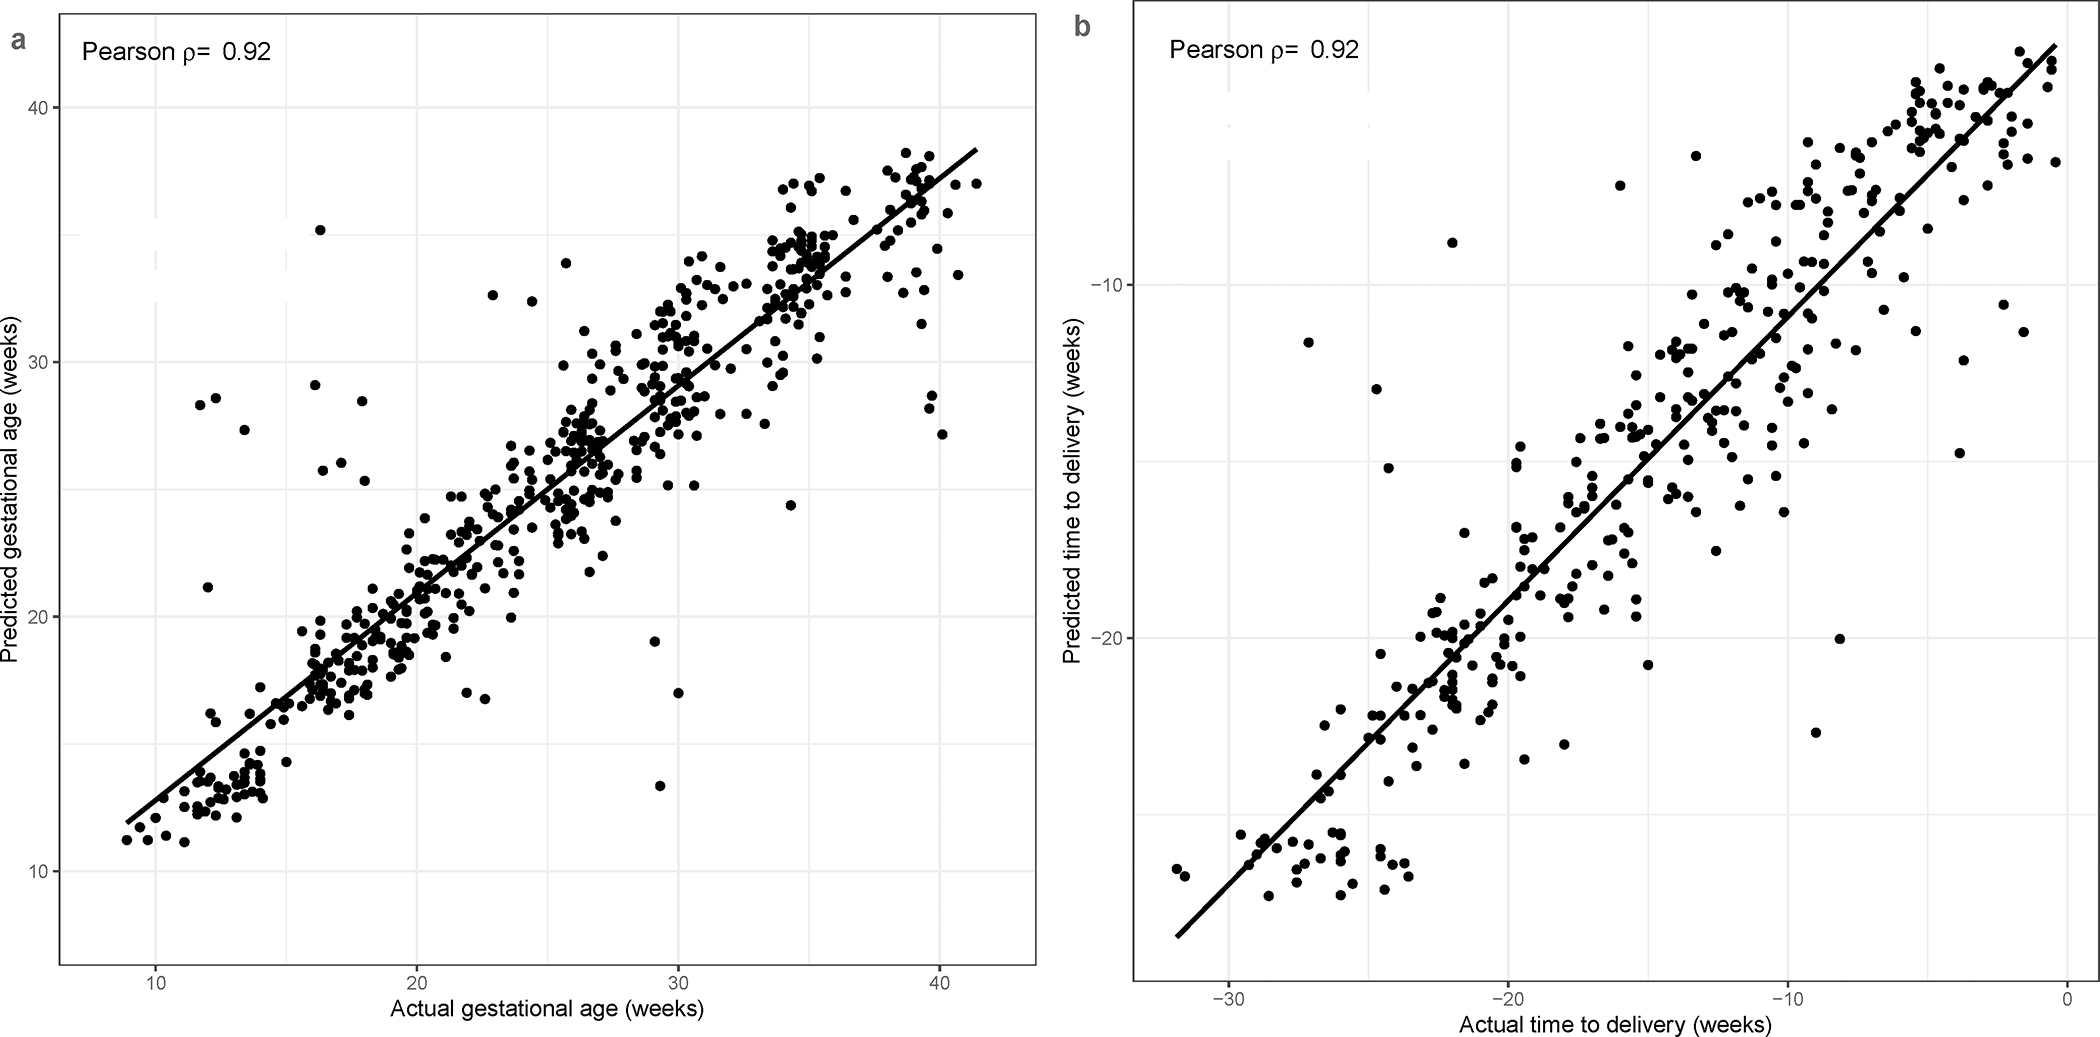
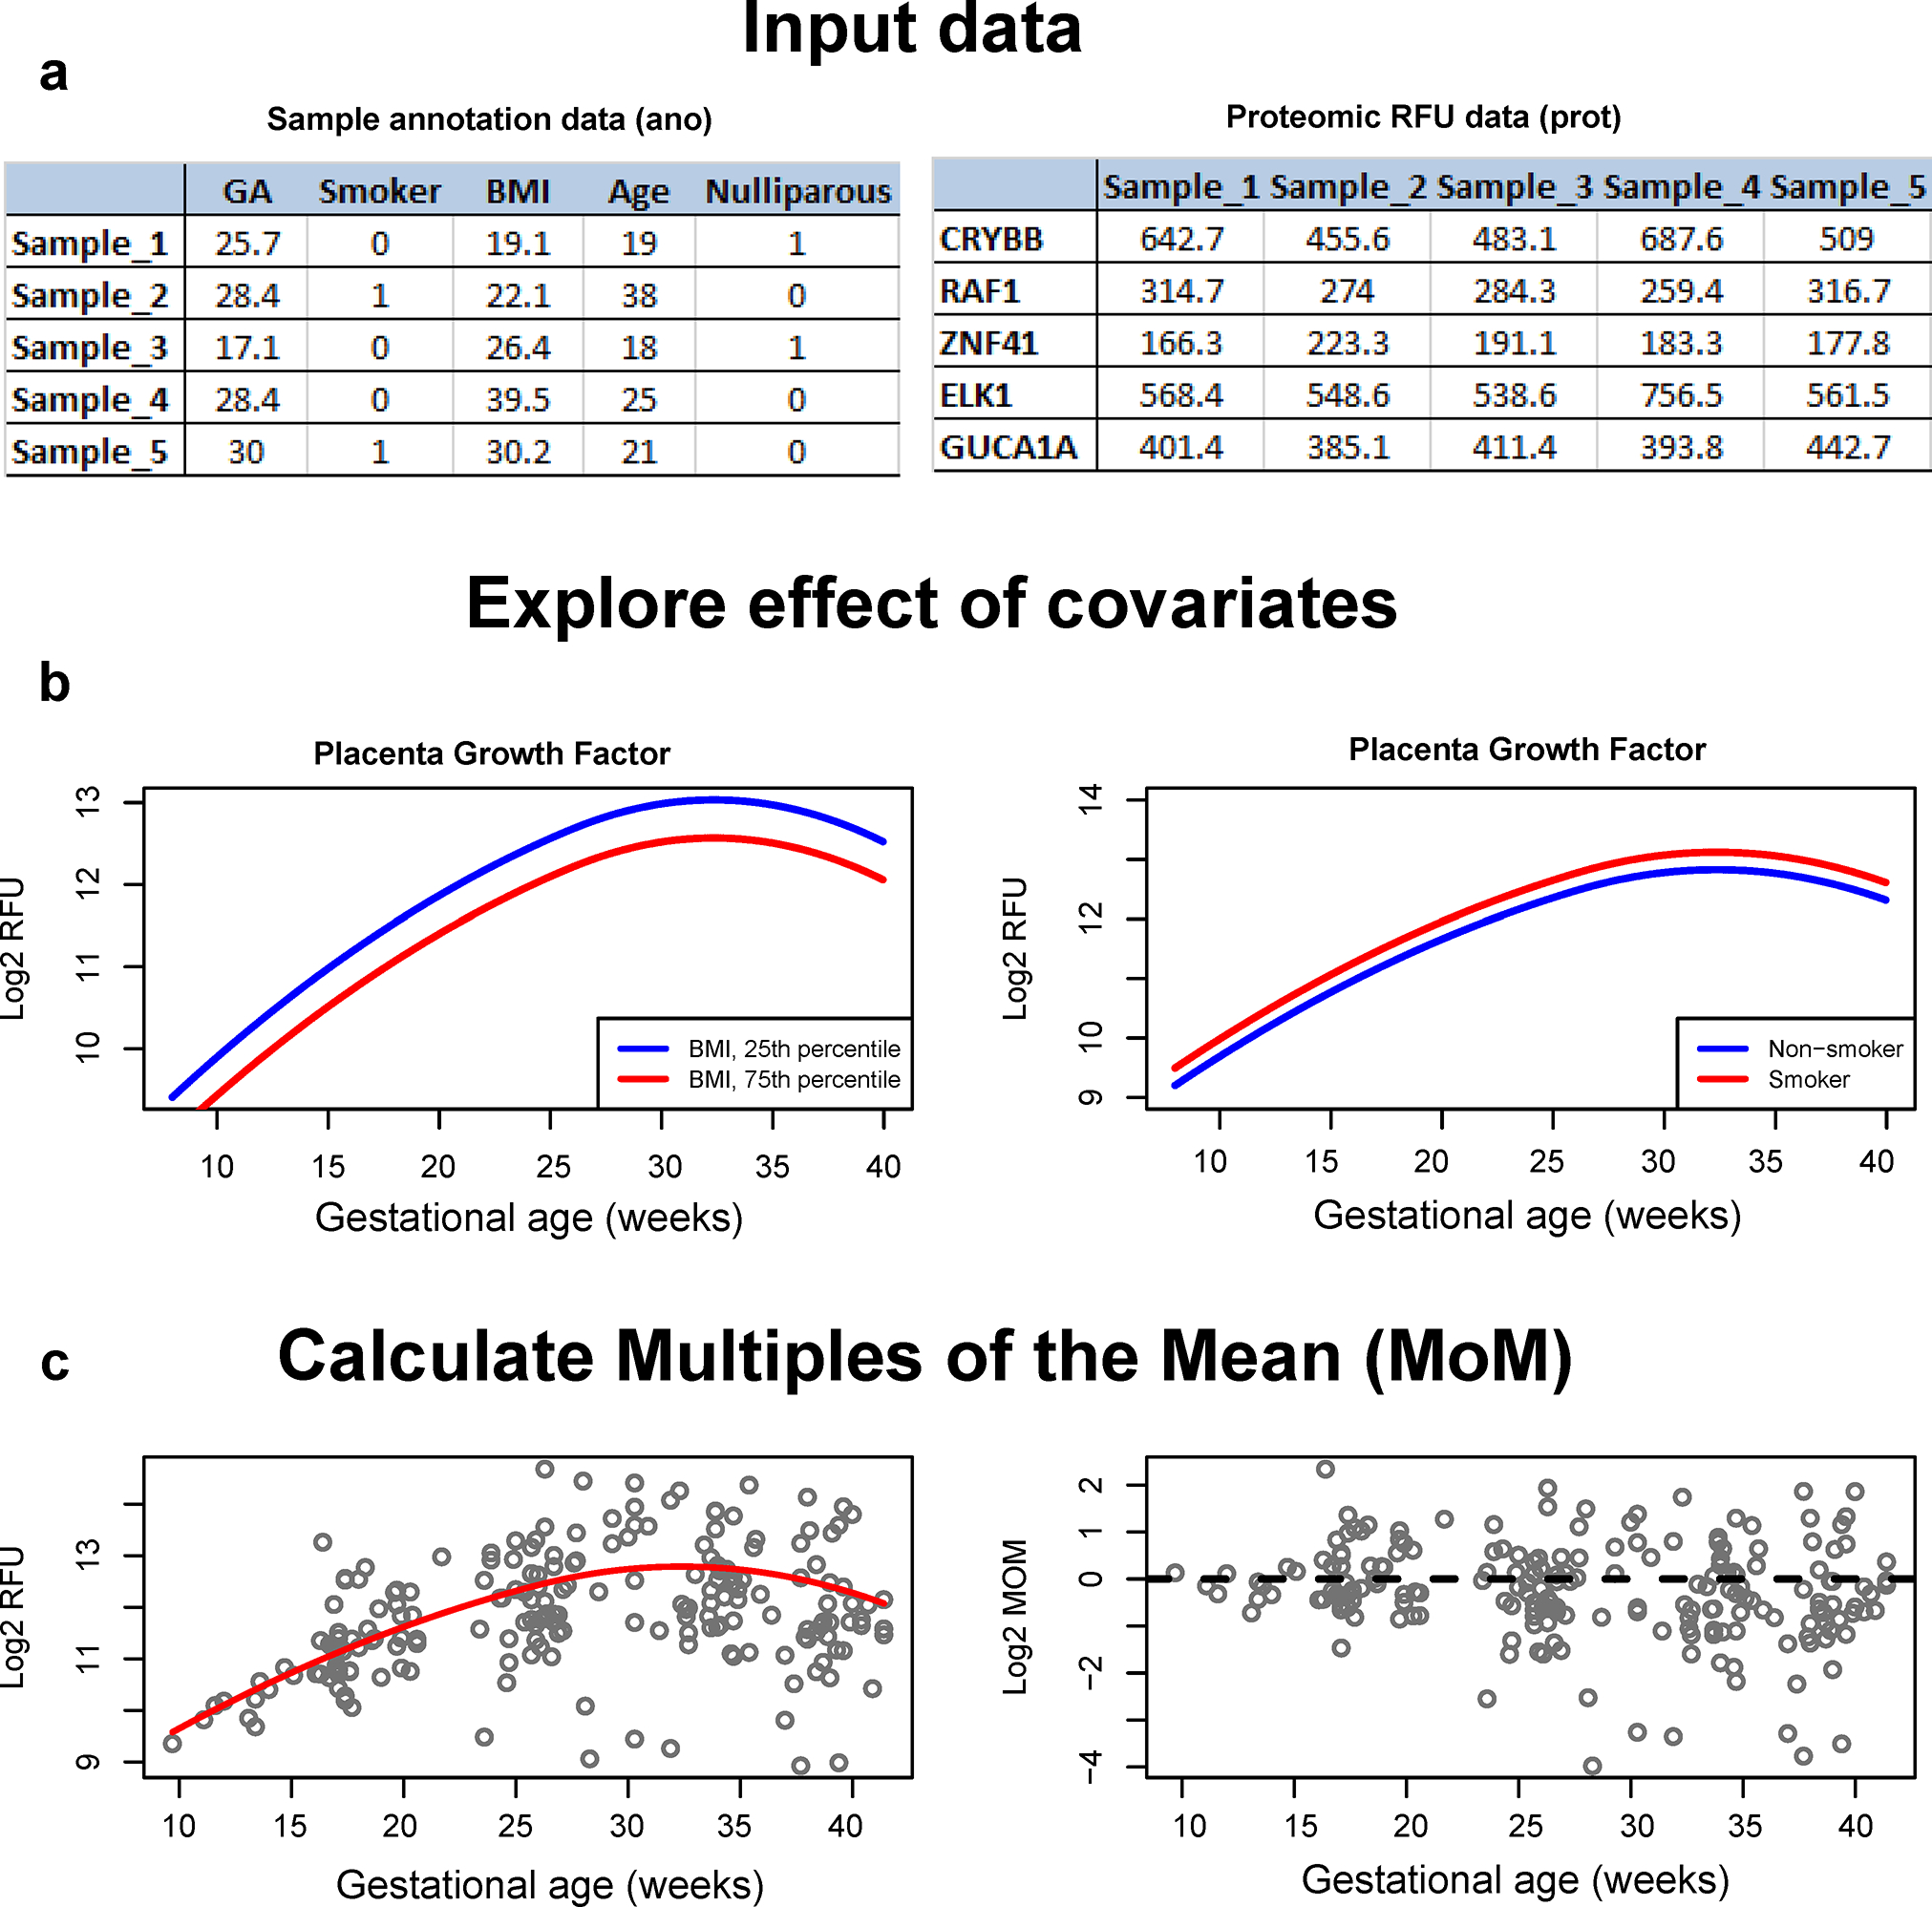
The human plasma proteome is underexplored despite its potential value for monitoring health and disease. Herein, using a recently developed aptamer-based platform, we profiled 7288 proteins in 528 plasma samples from 91 normal pregnancies (Gene Expression Omnibus identifier GSE206454). The coefficient of variation was <20% for 93% of analytes (median 7%), and a cross-platform correlation for selected key angiogenic and anti-angiogenic proteins was significant. Gestational age was associated with changes in 953 proteins, including highly modulated placenta- and decidua-specific proteins, and they were enriched in biological processes including regulation of growth, angiogenesis, immunity, and inflammation. The abundance of proteins corresponding to RNAs specific to populations of cells previously described by single-cell RNA-Seq analysis of the placenta was highly modulated throughout gestation. Furthermore, machine learning-based prediction of gestational age and of time from sampling to term delivery compared favorably with transcriptomic models (mean absolute error of 2 weeks). These results suggested that the plasma proteome may provide a non-invasive readout of placental cellular dynamics and serve as a blueprint for investigating obstetrical disease.
Keywords: aptamer; biomarker; machine learning; proteomic standards; single-cell RNA signature.
Conflict of interest statement
The authors declare no conflicts of interest.
Figures
Similar articles
-
A proteomic clock of human pregnancy.Am J Obstet Gynecol. 2018 Mar;218(3):347.e1-347.e14. doi: 10.1016/j.ajog.2017.12.208. Epub 2017 Dec 24. Am J Obstet Gynecol. 2018. PMID: 29277631
-
The maternal plasma proteome changes as a function of gestational age in normal pregnancy: a longitudinal study.Am J Obstet Gynecol. 2017 Jul;217(1):67.e1-67.e21. doi: 10.1016/j.ajog.2017.02.037. Epub 2017 Mar 3. Am J Obstet Gynecol. 2017. PMID: 28263753 Free PMC article.
-
The amniotic fluid proteome changes with gestational age in normal pregnancy: a cross-sectional study.Sci Rep. 2022 Jan 12;12(1):601. doi: 10.1038/s41598-021-04050-9. Sci Rep. 2022. PMID: 35022423 Free PMC article.
-
Current approaches and developments in transcript profiling of the human placenta.Hum Reprod Update. 2020 Nov 1;26(6):799-840. doi: 10.1093/humupd/dmaa028. Hum Reprod Update. 2020. PMID: 33043357 Free PMC article. Review.
-
Obstetrical complications associated with abnormal maternal serum markers analytes.J Obstet Gynaecol Can. 2008 Oct;30(10):918-932. doi: 10.1016/S1701-2163(16)32973-5. J Obstet Gynaecol Can. 2008. PMID: 19038077 Review. English, French.
Cited by
-
Comparative predictive power of serum vs plasma proteomic signatures in feto-maternal medicine.AJOG Glob Rep. 2023 Jun 12;3(3):100244. doi: 10.1016/j.xagr.2023.100244. eCollection 2023 Aug. AJOG Glob Rep. 2023. PMID: 37456144 Free PMC article.
-
The emerging Janus face of SVEP1 in development and disease.Trends Mol Med. 2023 Nov;29(11):939-950. doi: 10.1016/j.molmed.2023.08.002. Epub 2023 Sep 4. Trends Mol Med. 2023. PMID: 37673700 Free PMC article. Review.
-
Exploring structured molecular landscape from single-cell multi-omics data by an explainable multimodal model.iScience. 2024 Nov 2;27(12):111131. doi: 10.1016/j.isci.2024.111131. eCollection 2024 Dec 20. iScience. 2024. PMID: 39618495 Free PMC article.
-
Deciphering maternal-fetal cross-talk in the human placenta during parturition using single-cell RNA sequencing.Sci Transl Med. 2024 Jan 10;16(729):eadh8335. doi: 10.1126/scitranslmed.adh8335. Epub 2024 Jan 10. Sci Transl Med. 2024. PMID: 38198568 Free PMC article.
-
Pregnancy-specific responses to COVID-19 revealed by high-throughput proteomics of human plasma.Commun Med (Lond). 2023 Apr 4;3(1):48. doi: 10.1038/s43856-023-00268-y. Commun Med (Lond). 2023. PMID: 37016066 Free PMC article.
References
-
- Gomez-Lopez N; Romero R; Galaz J; Bhatti G; Done B; Miller D; Ghita C; Motomura K; Farias-Jofre M; Jung E; Pique-Regi R; Hassan SS; Chaiworapongsa T; Tarca AL, Transcriptome changes in maternal peripheral blood during term parturition mimic perturbations preceding spontaneous preterm birthdagger. Biol Reprod 2022, 106 (1), 185–199. - PMC - PubMed
-
- Heng YJ; Pennell CE; McDonald SW; Vinturache AE; Xu J; Lee MW; Briollais L; Lyon AW; Slater DM; Bocking AD; de Koning L; Olson DM; Dolan SM; Tough SC; Lye SJ, Maternal Whole Blood Gene Expression at 18 and 28 Weeks of Gestation Associated with Spontaneous Preterm Birth in Asymptomatic Women. PLoS One 2016, 11 (6), e0155191. - PMC - PubMed
-
- Tarca AL; Pataki BA; Romero R; Sirota M; Guan Y; Kutum R; Gomez-Lopez N; Done B; Bhatti G; Yu T; Andreoletti G; Chaiworapongsa T; Consortium DPBPC; Hassan SS; Hsu CD; Aghaeepour N; Stolovitzky G; Csabai I; Costello JC, Crowdsourcing assessment of maternal blood multi-omics for predicting gestational age and preterm birth. Cell Rep Med 2021, 2 (6), 100323. - PMC - PubMed
Publication types
MeSH terms
Substances
Grants and funding
LinkOut - more resources
Full Text Sources
Molecular Biology Databases
