

Hepatic AMPK signaling dynamic activation in response to REDOX balance are sentinel biomarkers of exercise and antioxidant intervention to improve blood glucose control
- PMID: 36155132
- PMCID: PMC9645808
- DOI: 10.7554/eLife.79939
Hepatic AMPK signaling dynamic activation in response to REDOX balance are sentinel biomarkers of exercise and antioxidant intervention to improve blood glucose control
Abstract
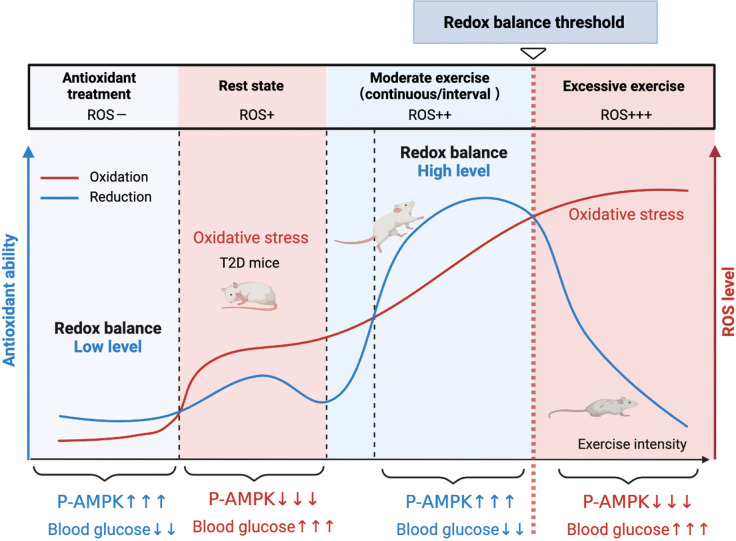
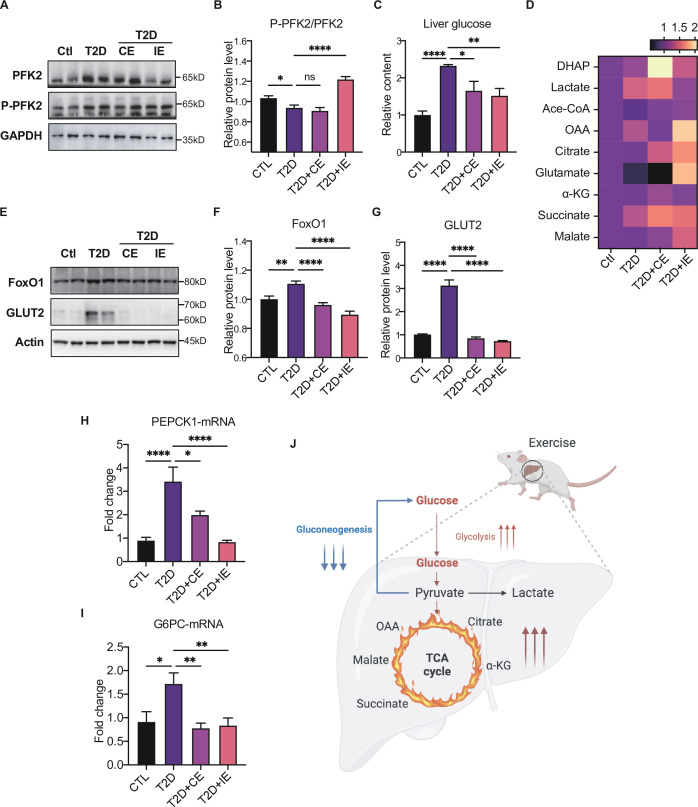
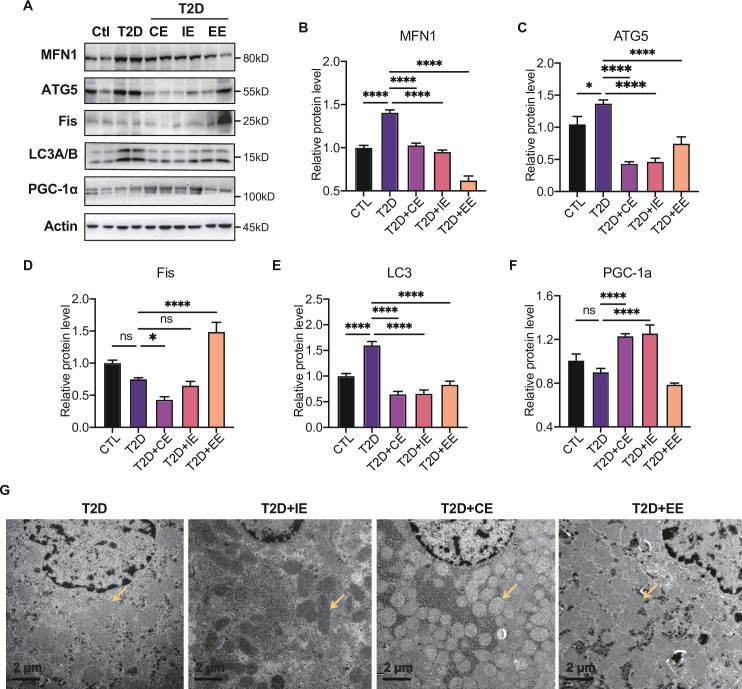
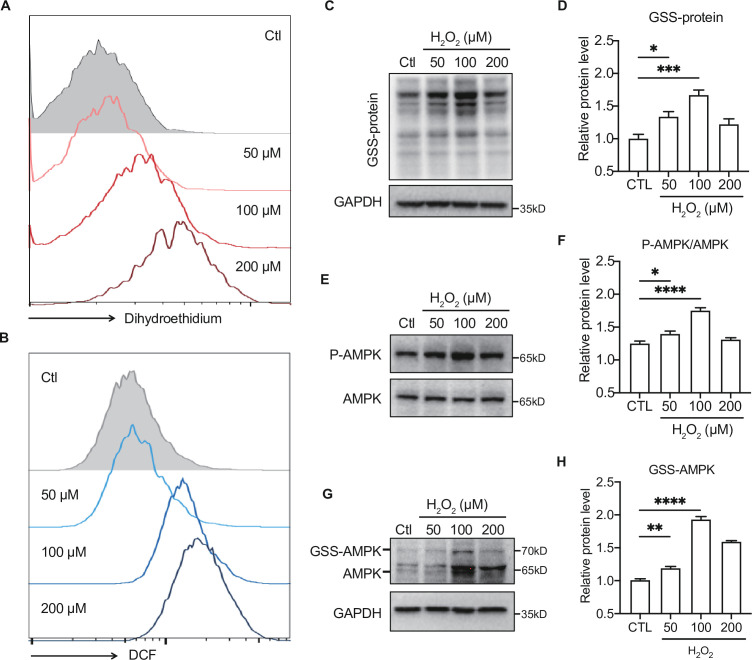
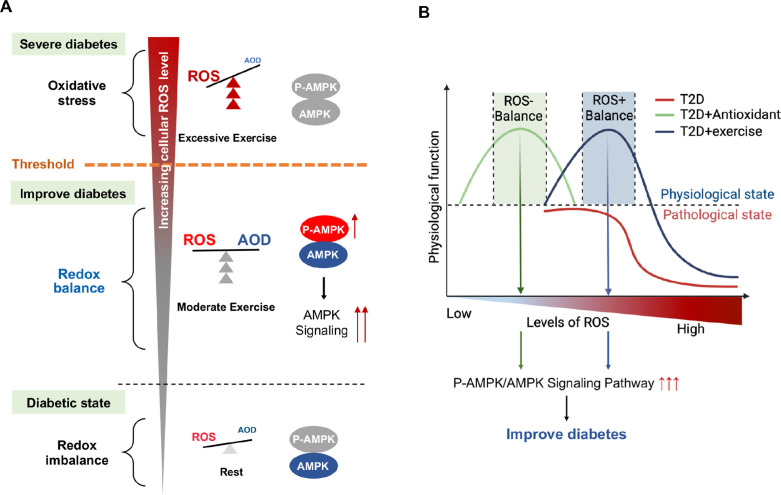
Antioxidant intervention is considered to inhibit reactive oxygen species (ROS) and alleviate hyperglycemia. Paradoxically, moderate exercise can produce ROS to improve diabetes. The exact redox mechanism of these two different approaches remains largely unclear. Here, by comparing exercise and antioxidant intervention on type 2 diabetic rats, we found moderate exercise upregulated compensatory antioxidant capability and reached a higher level of redox balance in the liver. In contrast, antioxidant intervention achieved a low-level redox balance by inhibiting oxidative stress. Both of these two interventions could promote glucose catabolism and inhibit gluconeogenesis through activation of hepatic AMP-activated protein kinase (AMPK) signaling; therefore, ameliorating diabetes. During exercise, different levels of ROS generated by exercise have differential regulations on the activity and expression of hepatic AMPK. Moderate exercise-derived ROS promoted hepatic AMPK glutathionylation activation. However, excessive exercise increased oxidative damage and inhibited the activity and expression of AMPK. Overall, our results illustrate that both exercise and antioxidant intervention improve blood glucose control in diabetes by promoting redox balance, despite different levels of redox state(s). These results indicate that the AMPK signaling activation, combined with oxidative damage markers, could act as sentinel biomarkers, reflecting the threshold of redox balance that is linked to effective glucose control in diabetes. These findings provide theoretical evidence for the precise management of diabetes by antioxidants and exercise.
Keywords: AMPK; biochemistry; chemical biology; exercise; rat; redox balance.
Plain language summary
Molecules known as reactive oxygen species or ROS play vital roles in healthy cells. However, ROS can act as a double-edged sword: if their levels become too high, they can be harmful and interfere with many physiological processes. Indeed, diabetes, high blood pressure and many other chronic diseases are associated with imbalances in the levels of ROS in the body. To counter high ROS levels, cells have antioxidant mechanisms that reduce the excess ROS in the cell and keep the ‘redox’ (from reduction and oxidation) balance of the cell. Exercise and antioxidant nutritional supplements have attracted much attention as drug-free interventions for diabetes. Both strategies alter the levels of ROS in the body, with exercise increasing the levels of ROS, and antioxidant supplements reducing them. Individuals with diabetes and other metabolic health issues have different ROS levels depending on the severity of the disease, age, genetics and other factors, leading to different redox states in their cells. Thus, approaches that can accurately evaluate the redox balance status of individuals are necessary for clinicians to identify what types of exercise and antioxidant supplements are beneficial and which treatments are most appropriate for each patient. Wu, Zhao, Yan, Gao et al. examined the effects of exercise and antioxidant supplements on rats with diabetes, with the aim of identifying molecules – also known as biomarkers – that reflect the bodies’ redox balance. They found that moderate exercise increased the levels of ROS in the liver, which, in turn, compensated by increasing the production of antioxidants to protect against the higher levels of ROS. This resulted in a healthy ‘high-level’ redox balance, in which both ROS and antioxidants levels were high in the rats. On the other hand, giving the rats antioxidant supplements decreased their levels of ROS, leading to a healthy low-level redox balance with low levels of ROS. These findings indicate that regular moderate exercise may be appropriate for people with pre-diabetes symptoms to restore a healthy redox balance. This is because the compensatory antioxidant mechanisms that kick in during exercise may be enough to counteract the excessive levels of ROS in these people. For patients with mild diabetes, exercise, antioxidant supplements, or a combination of both may be appropriate treatment, depending on their levels of ROS. Finally, patients with severe diabetes, who already have high levels of ROS, may benefit from antioxidant supplements to help reduce their excessive levels of ROS. In the future, the biomarkers identified by Wu, Zhao, Yan, Gao et al. may be used to monitor and assess the change in the redox balance status of various populations and guide personalized interventions to maintain health. Additionally, these findings provide a new strategy for precision prevention and treatment of diabetes and other metabolic diseases.
© 2022, Wu, Zhao, Yan et al.
Conflict of interest statement
MW, AZ, XY, HG, CZ, XL, QL, FX, SL, DS No competing interests declared
Figures
Similar articles
-
Glutaredoxins concomitant with optimal ROS activate AMPK through S-glutathionylation to improve glucose metabolism in type 2 diabetes.Free Radic Biol Med. 2016 Dec;101:334-347. doi: 10.1016/j.freeradbiomed.2016.10.007. Epub 2016 Oct 13. Free Radic Biol Med. 2016. PMID: 27743883
-
Mitochondrial biogenesis: pharmacological approaches.Curr Pharm Des. 2014;20(35):5507-9. doi: 10.2174/138161282035140911142118. Curr Pharm Des. 2014. PMID: 24606795
-
Exercise and Metformin Intervention Prevents Lipotoxicity-Induced Hepatocyte Apoptosis by Alleviating Oxidative and ER Stress and Activating the AMPK/Nrf2/HO-1 Signaling Pathway in db/db Mice.Oxid Med Cell Longev. 2022 Sep 9;2022:2297268. doi: 10.1155/2022/2297268. eCollection 2022. Oxid Med Cell Longev. 2022. PMID: 36120597 Free PMC article.
-
Creatine Supplementation, Physical Exercise and Oxidative Stress Markers: A Review of the Mechanisms and Effectiveness.Nutrients. 2021 Mar 6;13(3):869. doi: 10.3390/nu13030869. Nutrients. 2021. PMID: 33800880 Free PMC article. Review.
-
Role of antioxidants in redox regulation of diabetic cardiovascular complications.Curr Pharm Biotechnol. 2010 Dec;11(8):819-36. doi: 10.2174/138920110793262123. Curr Pharm Biotechnol. 2010. PMID: 20874678 Review.
Cited by
-
Signaling metabolite β-aminoisobutyric acid as a metabolic regulator, biomarker, and potential exercise pill.Front Endocrinol (Lausanne). 2023 May 29;14:1192458. doi: 10.3389/fendo.2023.1192458. eCollection 2023. Front Endocrinol (Lausanne). 2023. PMID: 37313446 Free PMC article. Review.
-
Endogenous and Exogenous Antioxidants in Skeletal Muscle Fatigue Development during Exercise.Antioxidants (Basel). 2023 Feb 16;12(2):501. doi: 10.3390/antiox12020501. Antioxidants (Basel). 2023. PMID: 36830059 Free PMC article. Review.
-
Exercise Improves the Coordination of the Mitochondrial Unfolded Protein Response and Mitophagy in Aging Skeletal Muscle.Life (Basel). 2023 Apr 13;13(4):1006. doi: 10.3390/life13041006. Life (Basel). 2023. PMID: 37109535 Free PMC article. Review.
-
Docosahexaenoic Acid Coordinating with Sodium Selenite Promotes Paraptosis in Colorectal Cancer Cells by Disrupting the Redox Homeostasis and Activating the MAPK Pathway.Nutrients. 2024 Jun 1;16(11):1737. doi: 10.3390/nu16111737. Nutrients. 2024. PMID: 38892670 Free PMC article.
-
CPS1-promoted the progression of lung adenocarcinoma via suppressing ammonia induced the activation of ROS/AMPK/P53/LKB1 signaling pathway.Sci Rep. 2025 Aug 12;15(1):29610. doi: 10.1038/s41598-025-14443-9. Sci Rep. 2025. PMID: 40796927 Free PMC article.
References
-
- Ashton T, Rowlands CC, Jones E, Young IS, Jackson SK, Davies B, Peters JR. Electron spin resonance spectroscopic detection of oxygen-centred radicals in human serum following exhaustive exercise. European Journal of Applied Physiology and Occupational Physiology. 1998;77:498–502. doi: 10.1007/s004210050366. - DOI - PubMed
-
- Bhatti JS, Sehrawat A, Mishra J, Sidhu IS, Navik U, Khullar N, Kumar S, Bhatti GK, Reddy PH. Oxidative stress in the pathophysiology of type 2 diabetes and related complications: current therapeutics strategies and future perspectives. Free Radical Biology & Medicine. 2022;184:114–134. doi: 10.1016/j.freeradbiomed.2022.03.019. - DOI - PubMed
Publication types
MeSH terms
Substances
LinkOut - more resources
Full Text Sources
Medical
