. 2023 Feb;164(2):272-288.
doi: 10.1053/j.gastro.2022.09.024. Epub 2022 Sep 23.

Human Gut Microbiota and Its Metabolites Impact Immune Responses in COVID-19 and Its Complications

Affiliations

Human Gut Microbiota and Its Metabolites Impact Immune Responses in COVID-19 and Its Complications

Naoyoshi Nagata et al. Gastroenterology. 2023 Feb.

Abstract

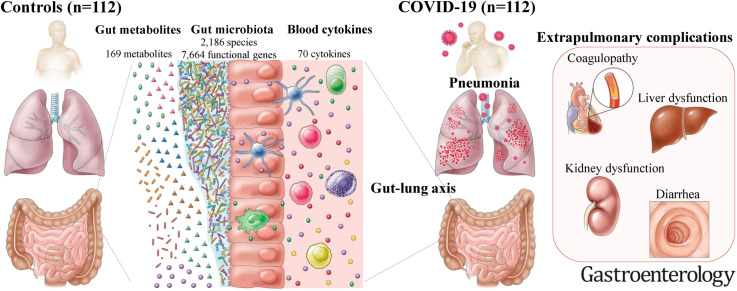
Background & aims: We investigate interrelationships between gut microbes, metabolites, and cytokines that characterize COVID-19 and its complications, and we validate the results with follow-up, the Japanese 4D (Disease, Drug, Diet, Daily Life) microbiome cohort, and non-Japanese data sets.

Methods: We performed shotgun metagenomic sequencing and metabolomics on stools and cytokine measurements on plasma from 112 hospitalized patients with SARS-CoV-2 infection and 112 non-COVID-19 control individuals matched by important confounders.

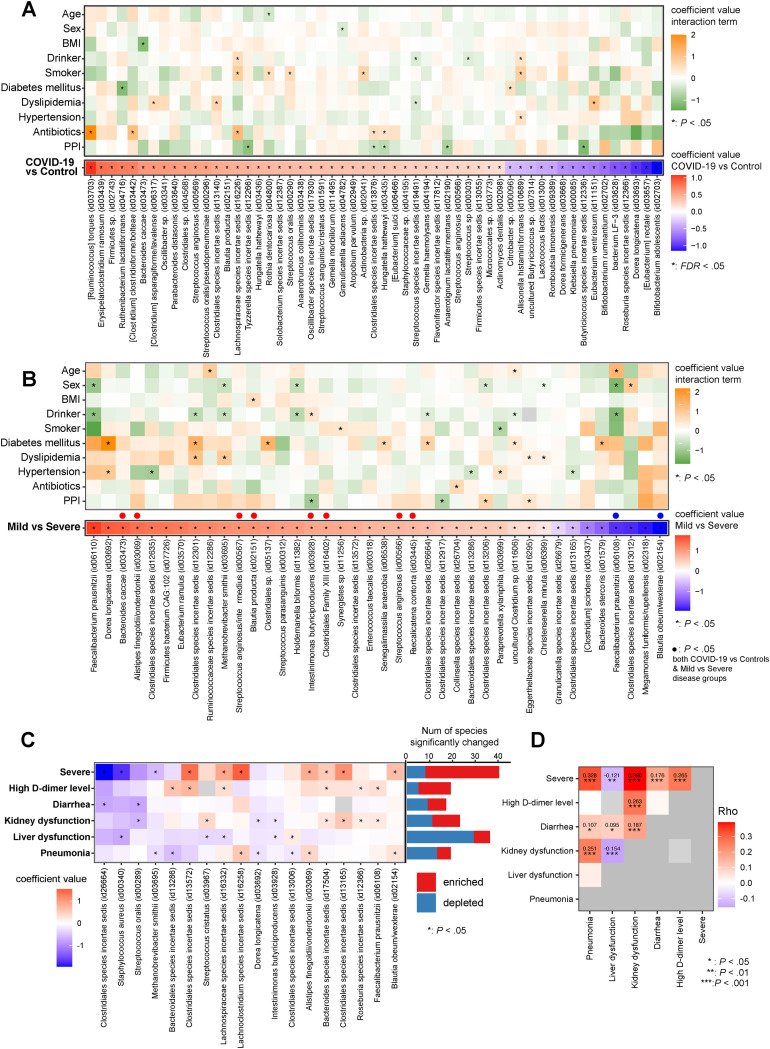
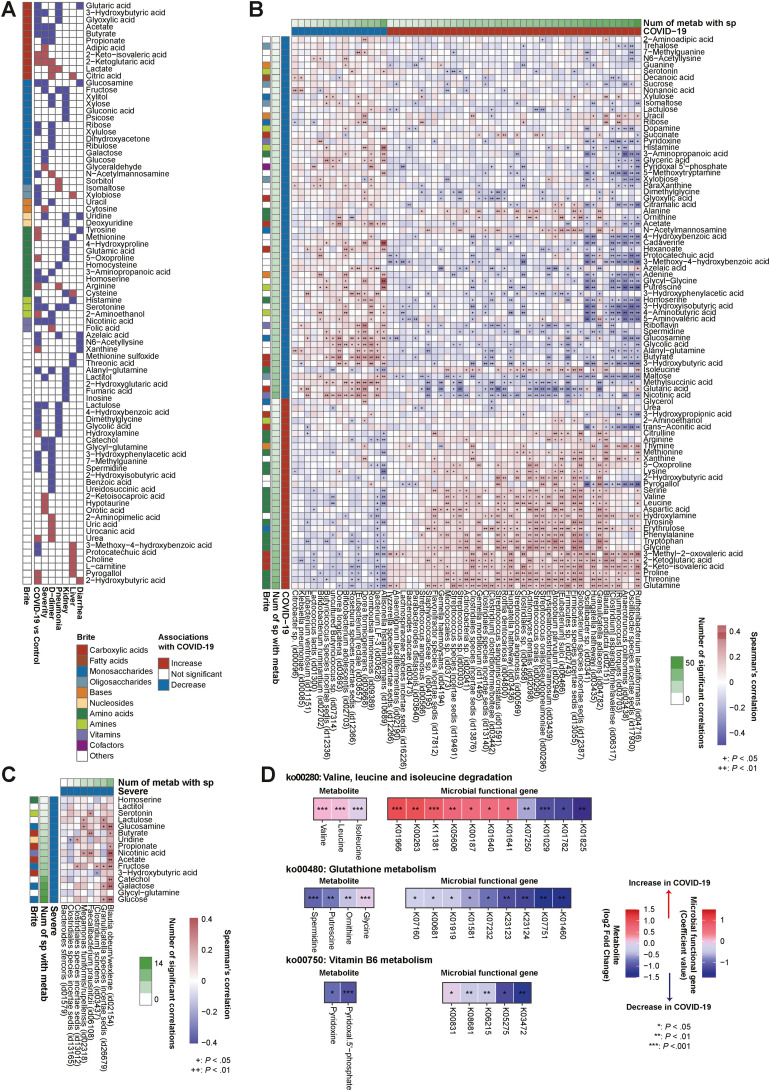
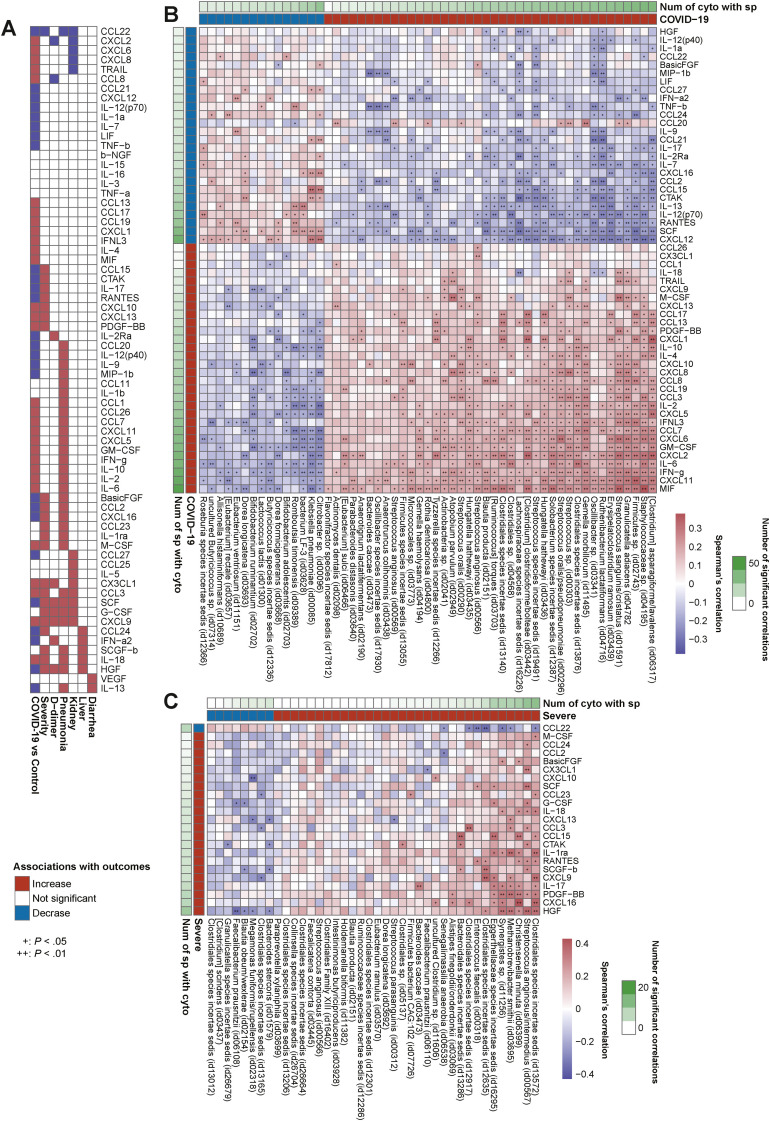
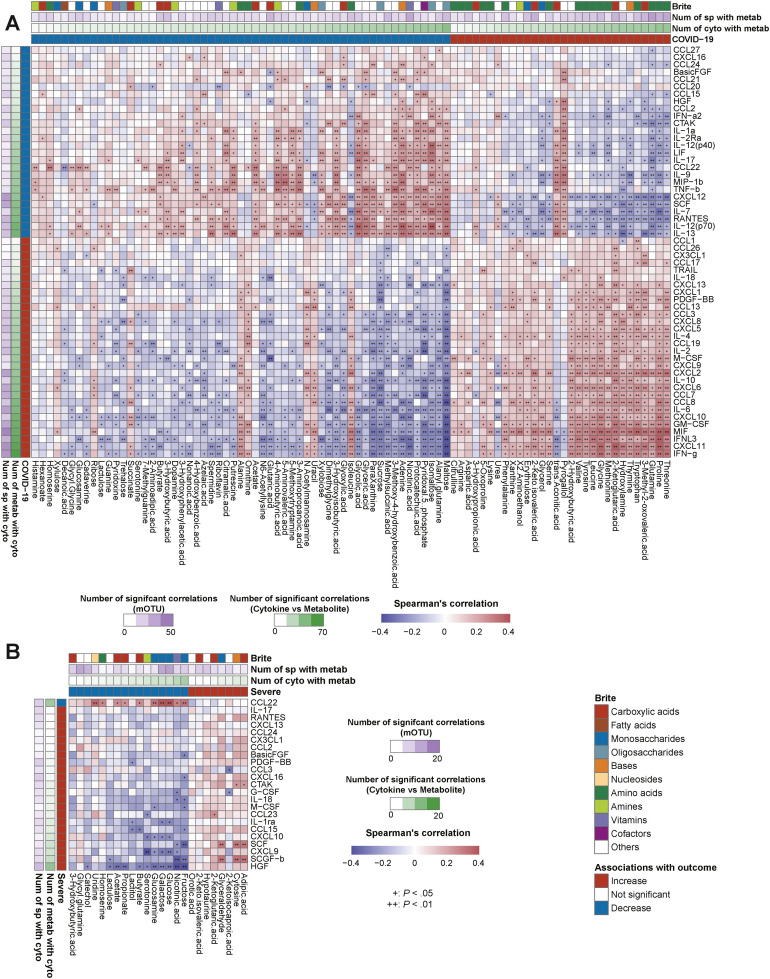
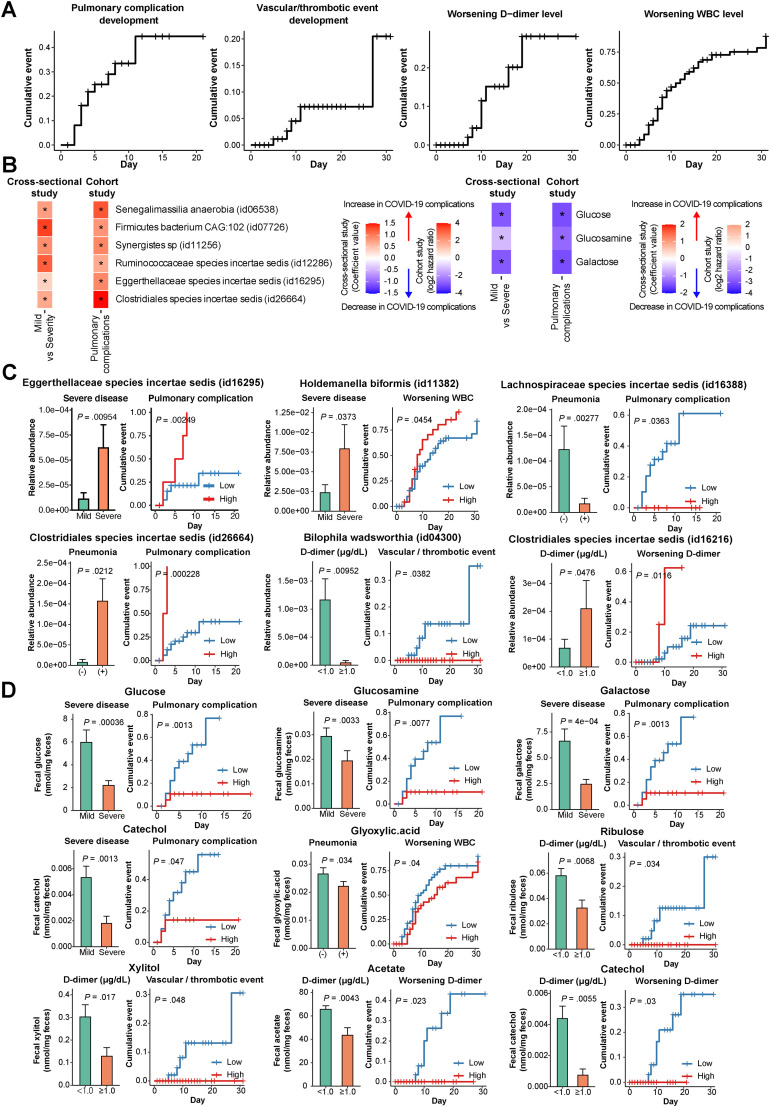
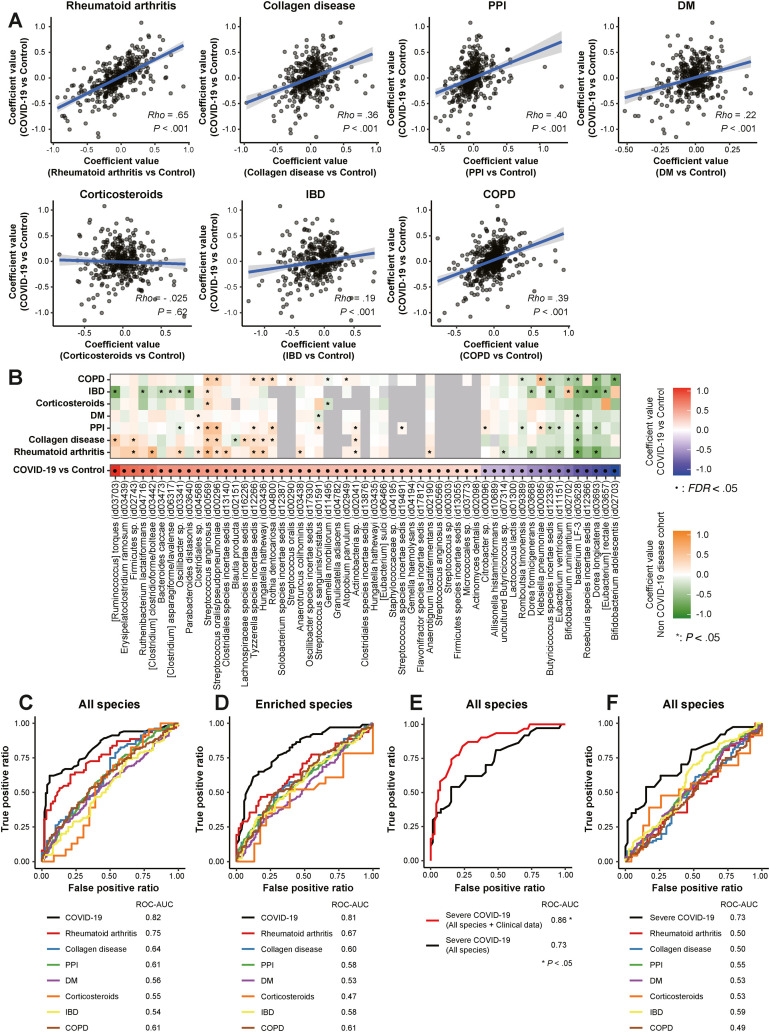
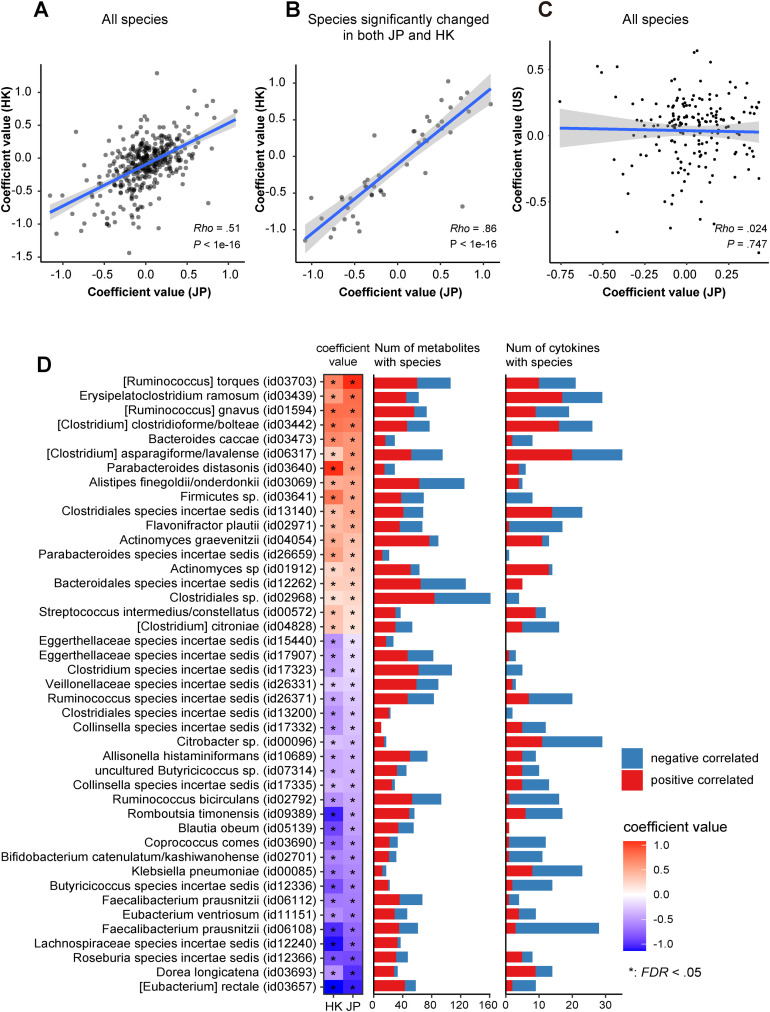
Results: Multiple correlations were found between COVID-19-related microbes (eg, oral microbes and short-chain fatty acid producers) and gut metabolites (eg, branched-chain and aromatic amino acids, short-chain fatty acids, carbohydrates, neurotransmitters, and vitamin B6). Both were also linked to inflammatory cytokine dynamics (eg, interferon γ, interferon λ3, interleukin 6, CXCL-9, and CXCL-10). Such interrelationships were detected highly in severe disease and pneumonia; moderately in the high D-dimer level, kidney dysfunction, and liver dysfunction groups; but rarely in the diarrhea group. We confirmed concordances of altered metabolites (eg, branched-chain amino acids, spermidine, putrescine, and vitamin B6) in COVID-19 with their corresponding microbial functional genes. Results in microbial and metabolomic alterations with severe disease from the cross-sectional data set were partly concordant with those from the follow-up data set. Microbial signatures for COVID-19 were distinct from diabetes, inflammatory bowel disease, and proton-pump inhibitors but overlapping for rheumatoid arthritis. Random forest classifier models using microbiomes can highly predict COVID-19 and severe disease. The microbial signatures for COVID-19 showed moderate concordance between Hong Kong and Japan.

Conclusions: Multiomics analysis revealed multiple gut microbe-metabolite-cytokine interrelationships in COVID-19 and COVID-19related complications but few in gastrointestinal complications, suggesting microbiota-mediated immune responses distinct between the organ sites. Our results underscore the existence of a gut-lung axis in COVID-19.

Keywords: Cytokine Storm; Fecal Metabolome; Gut Microbiome; Gut-Lung Axis.


Figures

None
Graphical abstract
Figure 1
Figure 1
Distinct gut microbial variations in COVID-19 and background factors. (A) Metagenomic data were obtained from COVID-19 patients (n = 103) and control individuals (n = 105). Red and blue in the lower heatmap represent species enriched and depleted between COVID-19 and control individuals (FDR < 0.05, MaAsLin2), respectively. The upper heatmap displays comparative analysis for COVID-19–related microbes between patients’ background factors, and an asterisk indicates microbes significantly interacting in the presence or absence of the factors (P < .05, MaAsLin2 interaction model). If the coefficient in the interaction term is greater than 0 (orange), the microbe’s abundance increases in the presence of the factor. A value less than 0 (green) means the microbe’s abundance decreases in the presence of the factor. (B) The lower heatmap shows the gut species significantly altered between mild and severe COVID-19 patients. Red and blue in the lower heatmap represent species enriched and depleted in the severe COVID-19 group (P < .05, MaAsLin2), respectively. The upper heatmap displays comparative analysis for severe-disease–related microbes between ‘background factors, and an asterisk indicates microbes significantly interacting in the presence or absence of the factors (P < .05, MaAsLin2 interaction model). (C) Association between gut microbiota and COVID-19 complications. We first identified gut microbes that significantly varied with each complication (P < .05, MaAsLin2) (Supplementary Table 7) and then created a heatmap of the microbes that overlap between 2 or more complications. Red and blue in the heatmap represent species enriched and depleted in each complication, respectively. Bar plots attached to the right side of the heatmap represent the number of gut species that were significantly enriched (red)/depleted (blue) between COVID-19 patients who had complications and those who did not. (D) Spearman rho values estimated by correlation analysis for coefficient values for gut species between 2 complications, shown as a heatmap. Red and purple indicate positive and negative correlations between complications, respectively.
Figure 2
Figure 2
Gut microbe and metabolite relationships in COVID-19 and severe disease. (A) Fecal metabolomic data were obtained from COVID-19 patients (n = 112) and control individuals (n = 112). The heatmap shows the fecal metabolites significantly altered between COVID-19 patients and control individuals, patients with mild and severe COVID-19 (n = 112), high– and low–D-dimer groups (n = 94), pneumonia and nonpneumonia groups (n = 112), kidney dysfunction and non–kidney dysfunction groups (n = 111), liver dysfunction and non–liver dysfunction groups (n = 112), and diarrhea and nondiarrhea groups (n = 112). Associations found significant by Wilcoxon rank sum test (FDR < 0.05 in COVID-19 cases and P < .05 in other complications) are colored in red (increased in median) or blue (decreased in median). Fecal metabolites are colored according to KEGG Brite categories. (B) The heatmap shows Spearman correlations between species-level microbiota relative abundance and fecal metabolite concentrations associated with COVID-19 patients and control individuals. Species (n = 208 cases) and fecal metabolites (n = 224 cases) for this analysis were selected through the MaAsLin2 model and Wilcoxon rank sum test, respectively. The vertical heatmap on the left displaying shades of green shows the number of gut species with significant correlations to gut metabolites, and the horizontal heatmap at the top of the figure displaying shades of green shows the number of gut metabolites with significant correlations to gut species. The gut species and metabolites are ordered by their numbers of significant correlations. (C) The heatmap shows Spearman correlations between the species-level microbiota relative abundance and fecal metabolite concentrations altered between patients with mild and severe COVID-19. Species (n = 103 cases) and fecal metabolites (n = 112 cases) for this analysis were selected through MaAsLin2 analysis (P < .05) and Wilcoxon rank sum test (P < .05), respectively. Overall correlations are displayed in Supplementary Figure 4A. Of these, we selected and showed correlations between depleted species and depleted fecal metabolites in severe COVID-19 cases. The vertical heatmap on the left displaying shades of green shows the number of gut species with significant correlations to gut metabolites, and the horizontal heatmap at the top of the figure displaying shades of green shows the number of gut metabolites with significant correlations to gut species. Species and metabolites are ordered by their numbers of significant correlations. (D) The heatmap shows significantly altered gut metabolites and their corresponding KOs in representative KEGG pathways. We selected KEGG pathways belonging to the metabolites and KOs that were significantly associated with COVID-19. Among selected pathways, those with consistent signatures in KO genes and metabolites are shown in this heatmap. Num, number; sp, species.
Figure 3
Figure 3
Gut microbiota and blood cytokine relationships in COVID-19 and severe disease. (A) Plasma cytokine analysis was performed in COVID-19 patients (n = 70) and control individuals (n = 109). The heatmap shows the cytokines that were significantly altered between COVID-19 and control individuals, patients with mild and severe COVID-19 (n = 70), high– and low–D-dimer level groups (n = 60), pneumonia and nonpneumonia groups (n = 70), kidney dysfunction and non–kidney dysfunction groups (n = 69), liver dysfunction and non–liver dysfunction groups (n = 70), and diarrhea and nondiarrhea groups (n = 70). Associations found significant by Wilcoxon rank sum test (FDR < 0.05 in COVID-19 cases and P < .05 in other complications) are colored in red (increased in median) or blue (decreased in median). (B) The heatmap shows Spearman correlations between the species-level microbiota relative abundance and plasma cytokine concentrations associated with COVID-19 patients and control individuals. Species (n = 208 cases) and cytokines (n = 179 cases) for this analysis were selected through the MaAsLin2 model and Wilcoxon rank sum test, respectively, with multiple testing corrections (FDR < 0.05). The vertical heatmap on the left displaying shades of green shows the number of gut species with significant correlations to cytokines, and the vertical heatmap at the top of the figure displaying shades of green shows the number of cytokines with significant correlations to gut species. Species and cytokines are ordered by their numbers of significant correlations. (C) The heatmap shows Spearman correlations between the species-level microbiota relative abundance and plasma cytokine concentrations altered between mild and severe COVID-19 cases. Species (n = 103 cases) and cytokines (n = 70 cases) for this analysis were selected through the MaAsLin2 model (P < .05) and Wilcoxon rank sum test (P < .05), respectively. Species and cytokines are ordered by their numbers of significant correlations.
Figure 4
Figure 4
Gut metabolite and blood cytokine relationships in COVID-19 and severe disease. (A) The heatmap shows Spearman correlations between the plasma cytokine and fecal metabolite concentrations associated with COVID-19 patients and control individuals. Cytokines (n = 179 cases) and fecal metabolites (n = 224 cases) for this analysis were selected through Wilcoxon rank sum test with multiple testing corrections (FDR < 0.05). The vertical heatmap on the left displaying shades of green shows the number of gut metabolites with significant correlations to cytokines, and the horizontal heatmap at the top of the figure displaying shades of green shows the number of cytokines with significant correlations to gut metabolites. The vertical heatmap on the left displaying shades of purple shows the number of gut species with significant correlations to cytokines, and the horizontal heatmap at the top of the figure displaying shades of purple shows the number of gut species with significant correlations to gut metabolites. The cytokines and metabolites are ordered by their numbers of significant correlations in the given column or row, and metabolites are colored according to KEGG Brite categories. (B) The heatmap shows Spearman correlations between the plasma cytokine and fecal metabolite concentrations altered between mild and severe cases. Cytokines (n = 70 cases) and fecal metabolites (n = 112 cases) for this analysis were selected through Wilcoxon rank sum test (P < .05). The vertical heatmap on the left displaying shades of green shows the number of gut metabolites with significant correlations to cytokines, and the horizontal heatmap at the top of the figure displaying shades of green shows the number of cytokines with significant correlations to gut metabolites. The vertical heatmap on the left displaying shades of purple shows the number of gut species with significant correlations to cytokines, and the horizontal heatmap at the top of the figure displaying shades of purple shows the number of gut species with significant correlations to gut metabolites. Metab, metabolites; cyto, cytokines.
Figure 5
Figure 5
Survival analysis and its concordance with cross-sectional analysis in patients with COVID-19. (A) The Kaplan-Meier method was used to estimate the cumulative incidence of pulmonary complications (n = 41), cardiovascular/thrombotic events (n = 111), worsening D-dimer level (n = 91), and worsening WBC level (n = 112). Definitions, inclusion and exclusion criteria, and follow-up of each cohort are described in the Supplementary Methods, Methods, and Supplementary Table 1. (B) The heatmaps show the concordance of gut microbial signatures between the cross-sectional study (red) and the cohort study (green). The left heatmap depicts 7 microbes enriched in severe COVID-19 in the cross-sectional study (red, MaAslin2, Figure 1B). In the cohort study, patients with high abundances of 6 microbes (id06538, id07726, id11256, id12286, id16295, and id26664) showed higher hazard ratios (HRs) for pulmonary complication development than those with low abundances (orange). Patients with high abundances of a microbe (id11382) showed higher HRs for worsening WBC level (green) in the cohort study. The right heatmap displays 3 metabolites (glucose, glucosamine, and galactose) depleted in severe COVID-19 in the cross-sectional study (purple, Wilcoxon rank sum test) (Figure 2A). In the cohort study, patients with low abundances of the metabolites showed higher HRs for pulmonary complication development than those with low abundances (green). (C) The concordance of gut microbial signatures between the cross-sectional study (left bar) and the cohort study (right bar). The left bar represents the differences in abundances of gut microbes between COVID-19–related complications such as mild vs severe disease, pneumonia on computed tomography (CT) negative vs positive, and D-dimer level < 1.0 (μg/mL) vs ≥ 1.0. Comparison analysis was selected through MaAlsin2 (Figure 1B and Supplementary Table 7). Kaplan-Meier curves (right) show that patients with high or low abundances of the microbes were at higher risk of development of pulmonary complications, cardiovascular/thrombotic events, worsening D-dimer level, and worsening WBC level. Comparison analysis was selected through log-rank tests. (D) The concordance of gut metabolite alterations between the cross-sectional study (left bar) and the cohort study (right bar). The left bar chart represents the differences in abundances of gut metabolites between COVID-19–related complications such as mild vs severe disease, pneumonia on CT negative vs positive, and D-dimer level < 1.0 (μg/mL) vs ≥ 1.0. Comparison analysis was selected through the Wilcoxon rank sum test (Figure 2A). Kaplan-Meier curves (right) show that patients with high or low abundances of the metabolites were at higher risk of development of pulmonary complication, cardiovascular/thrombotic events, and worsening D-dimer level. Comparison analysis was selected through log-rank tests.
Figure 6
Figure 6
Microbial signatures predicting COVID-19 and their specificity. (A) Concordance values for gut species between COVID-19 and 6 other disease data sets were calculated by Spearman rank correlation coefficient. Non–COVID-19 conditions included (1) patients with RA (n = 62) and healthy individuals (n = 62), (2) patients with collagen disease (n = 80) and healthy individuals (n = 80), (3) patients using PPIs (n = 387) and healthy individuals (n = 387), (4) patients with DM (n = 200) and healthy individuals (n = 200), (5) patients using corticosteroids (n = 23) and healthy individuals (n = 23), (6) patients with IBD (n = 124) and healthy individuals (n = 124), and (7) patients with COPD (n = 124) and healthy individuals (n = 124). The percentage of those aged ≥65 years, male, and with a BMI of ≥25 kg/m2 were equal between the 7 disease and healthy group pairs (Supplementary Table 4). Coefficient values for each microbial signature between COVID-19 and control individuals (MaAsLin2, x-axis) and between each disease and healthy control individuals (MaAsLin2, y-axis) are represented in a scatter. (B) Characteristics of gut microbial signatures for COVID-19 and several diseases. The left heatmap depicts 30 enriched species (red) and 25 depleted ones (blue) significantly altered between COVID-19 and control individuals (FDR < 0.05) (Figure 1A). The right heatmap shows species significantly (P < .05, MaAsLin2) enriched (orange) and depleted (green) between 7 disease patients and healthy control individuals . (C) Random forest classifiers constructing microbial models trained using all species (501 species) predicting COVID-19 and their application to non–COVID-19 diseases. The COVID-19 predictive model was compared to models predicting 7 diseases that were applied using the same microbes identified in the COVID-19 model, respectively. The AUC was estimated by random forest classifier. (D) Random forest classifiers constructing microbial models trained on species significantly enriched (101 species, P < .05, MaAsLin2) predicting COVID-19 and their application to non–COVID-19 diseases. (E) Random forest classifiers construct microbial models predicting severe COVID-19. The AUC was estimated by random forest classifier. The prediction models were trained using all species (488 species) in mild vs severe COVID-19 (P < .05, MaAsLin2). The basic severe COVID-19 predictive microbial model was compared to the model using microbiomes and known clinical risk factors for severe disease, such as age >65 years, sex, BMI of >25 kg/m2, the number of comorbidities, and the number of drugs taken, as well as the laboratory data of lactate dehydrogenase (LDH) (U/L) and WBC/mm3 at admission. (F) The basic severe COVID-19 predictive model compared to models predicting 7 diseases applied using the same microbes identified in the severe COVID-19 model. ROC, receiver operating characteristic.
Figure 7
Figure 7
Validation of microbial signatures for COVID-19 in Japan with Hong Kong and the United States. (A) A scatterplot showing coefficient values for gut microbial signatures for COVID-19 identified in Japan (JP) (x-axis) and Hong Kong (HK) (y-axis), respectively. Coefficient values of 501 gut microbial alterations were estimated from MaAsLin2 between COVID-19 and control individuals. Concordance values for gut species for COVID-19 between Japan and Hong Kong were calculated by Spearman rank correlation coefficient. (B) A scatterplot depicting 47 species significantly (P < .05) altered in COVID-19 in both the and Hong Kong cohorts. (C) A scatterplot showing coefficient values for gut microbial signatures for severe COVID-19 identified in Japan (x-axis) and the United States (y-axis), respectively. (D) The left heatmap depicts 43 microbes, 18 enriched (red) and 25 depleted (blue), in COVID-19 that overlapped between Japan and Hong Kong among the 156 species characterized in COVID-19 in the Japanese cohort (P < .05, FDR < 0.16, MaAsLin2). The bar plot represents the number of cytokines and metabolites in the Japanese cohort that were significantly (P < .05, Spearman) correlated with the 43 species. The number of positive and negative correlations is represented in red and blue, respectively.

References

    1. Wang J., Jiang M., Chen X., et al. Cytokine storm and leukocyte changes in mild versus severe SARS-CoV-2 infection: review of 3939 COVID-19 patients in China and emerging pathogenesis and therapy concepts. J Leukoc Biol. 2020;108:17–41. - PMC - PubMed
    1. Gupta A., Madhavan M.V., Sehgal K., et al. Extrapulmonary manifestations of COVID-19. Nat Med. 2020;26:1017–1032. - PMC - PubMed
    1. Zheng D., Liwinski T., Elinav E. Interaction between microbiota and immunity in health and disease. Cell Res. 2020;30:492–506. - PMC - PubMed
    1. Zuo T., Zhang F., Lui G.C.Y., et al. Alterations in gut microbiota of patients with COVID-19 during time of hospitalization. Gastroenterology. 2020;159:944–955. - PMC - PubMed
    1. Gu S., Chen Y., Wu Z., et al. Alterations of the gut microbiota in patients with coronavirus disease 2019 or H1N1 influenza. Clin Infect Dis. 2020;71:2669–2678. - PMC - PubMed

Publication types