

Cerebrospinal Fluid Sphingomyelins in Alzheimer's Disease, Neurodegeneration, and Neuroinflammation
- PMID: 36155504
- PMCID: PMC9809197
- DOI: 10.3233/JAD-220349
Cerebrospinal Fluid Sphingomyelins in Alzheimer's Disease, Neurodegeneration, and Neuroinflammation
Erratum in
-
Erratum to: Cerebrospinal Fluid Sphingomyelins in Alzheimer's Disease, Neurodegeneration, and Neuroinflammation.J Alzheimers Dis. 2023;91(3):1229. doi: 10.3233/JAD-229019. J Alzheimers Dis. 2023. PMID: 36710713 No abstract available.
Abstract
Background: Sphingomyelin (SM) levels have been associated with Alzheimer's disease (AD), but the association direction has been inconsistent and research on cerebrospinal fluid (CSF) SMs has been limited by sample size, breadth of SMs examined, and diversity of biomarkers available.
Objective: Here, we seek to build on our understanding of the role of SM metabolites in AD by studying a broad range of CSF SMs and biomarkers of AD, neurodegeneration, and neuroinflammation.
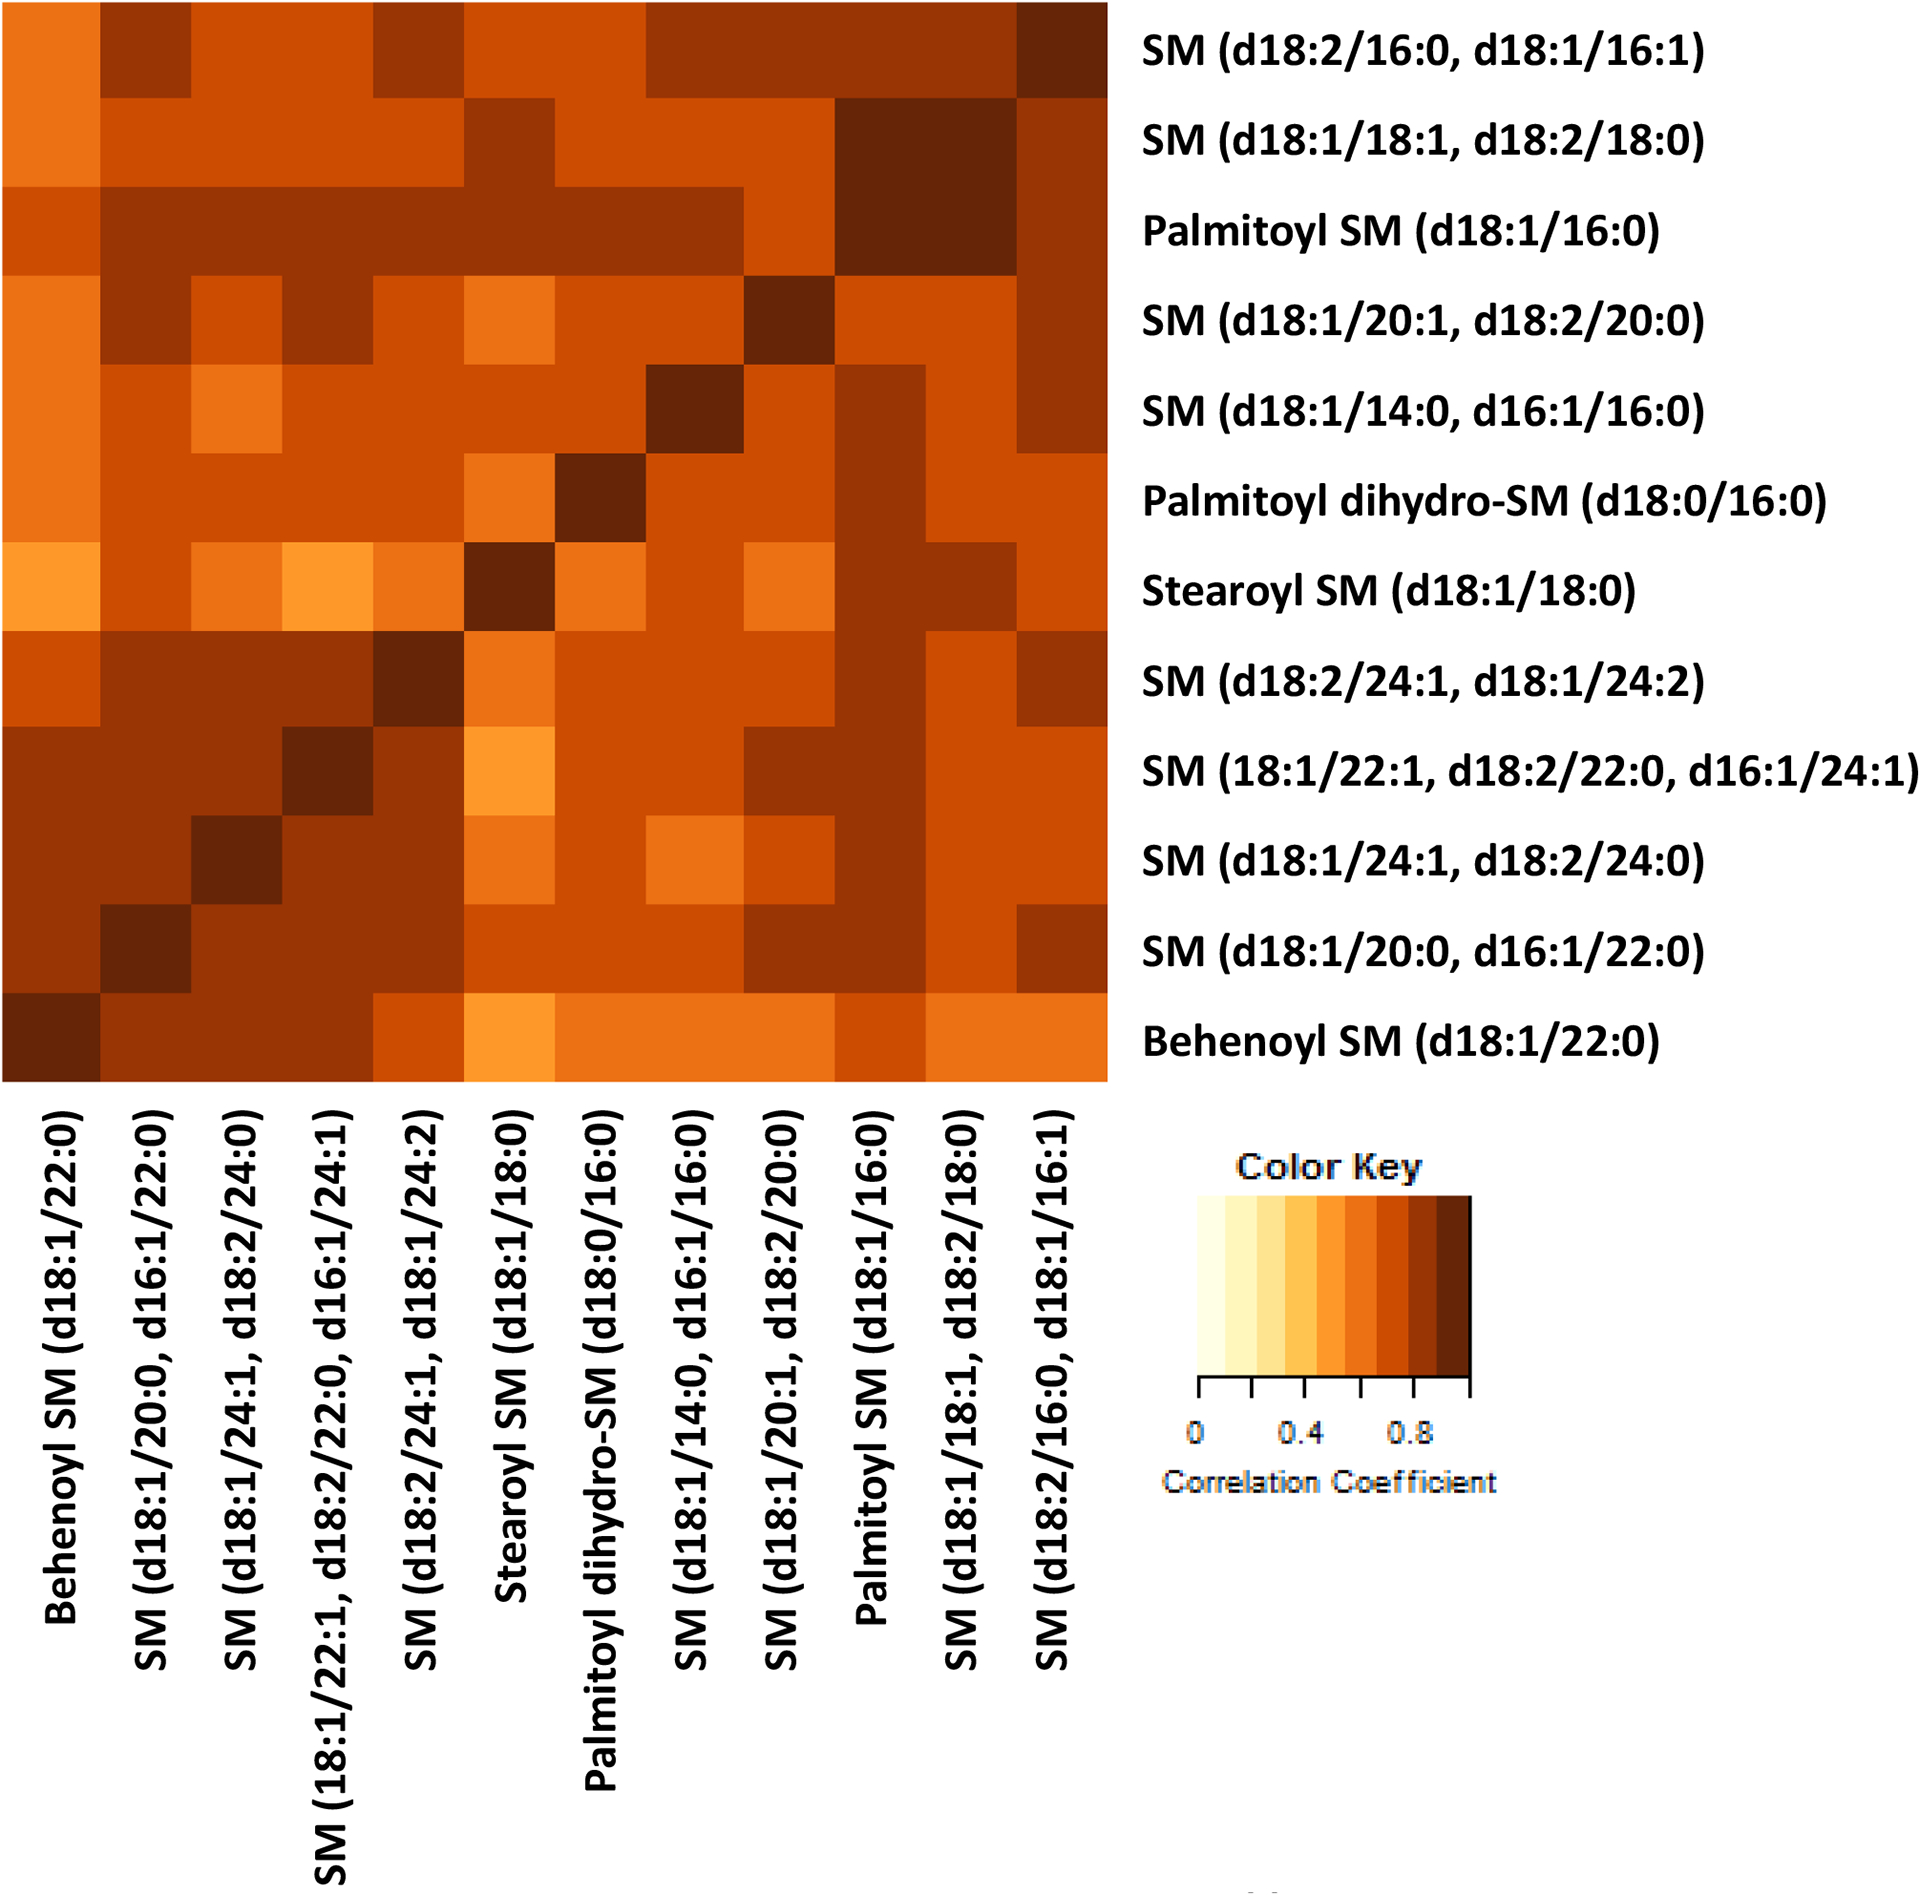
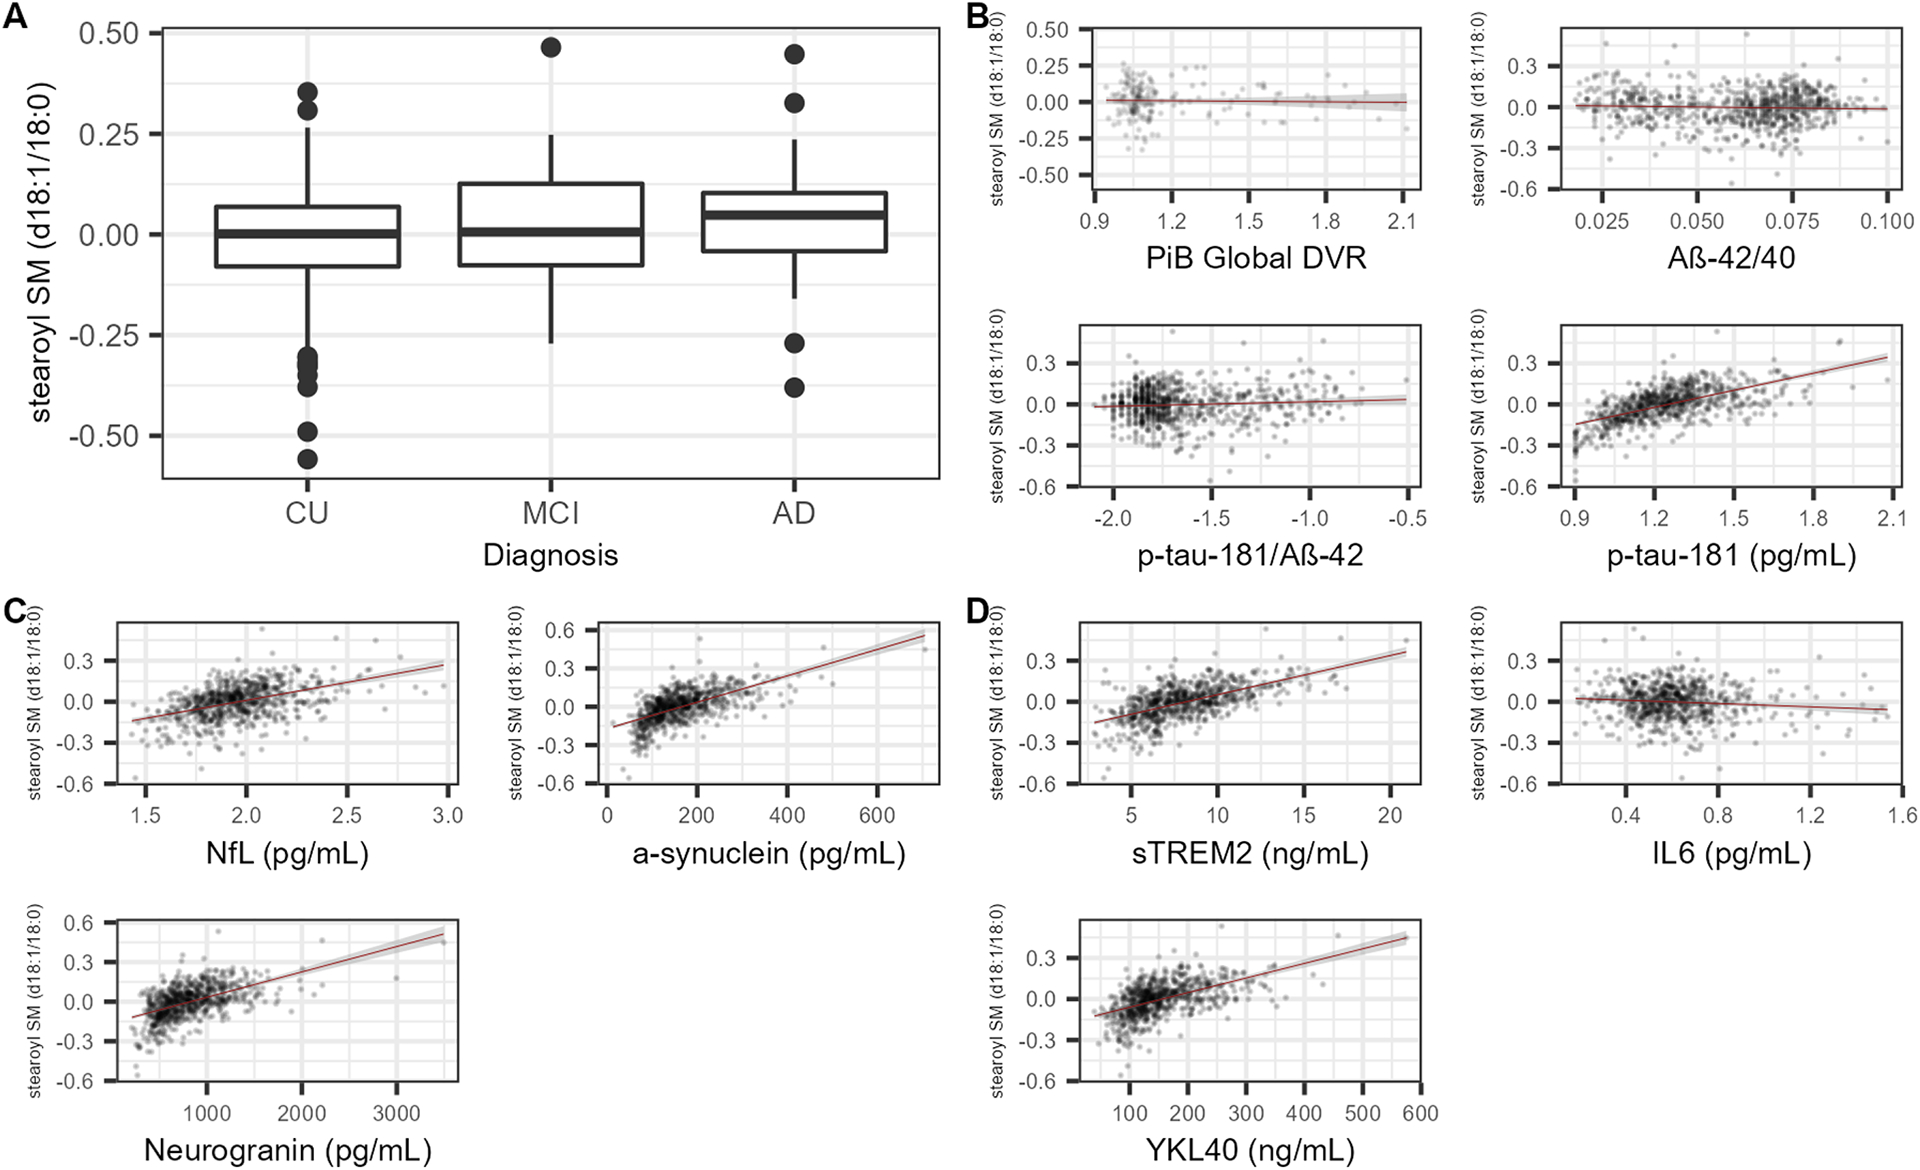
Methods: Leveraging two longitudinal AD cohorts with metabolome-wide CSF metabolomics data (n = 502), we analyzed the relationship between the levels of 12 CSF SMs, and AD diagnosis and biomarkers of pathology, neurodegeneration, and neuroinflammation using logistic, linear, and linear mixed effects models.
Results: No SMs were significantly associated with AD diagnosis, mild cognitive impairment, or amyloid biomarkers. Phosphorylated tau, neurofilament light, α-synuclein, neurogranin, soluble triggering receptor expressed on myeloid cells 2, and chitinase-3-like-protein 1 were each significantly, positively associated with at least 5 of the SMs.
Conclusion: The associations between SMs and biomarkers of neurodegeneration and neuroinflammation, but not biomarkers of amyloid or diagnosis of AD, point to SMs as potential biomarkers for neurodegeneration and neuroinflammation that may not be AD-specific.
Keywords: Alzheimer’s disease; biomarkers; cerebrospinal fluid; metabolomics; neurodegeneration; neuroinflammation; sphingolipid; sphingomyelin.
Figures
Similar articles
-
PTI-125 Reduces Biomarkers of Alzheimer's Disease in Patients.J Prev Alzheimers Dis. 2020;7(4):256-264. doi: 10.14283/jpad.2020.6. J Prev Alzheimers Dis. 2020. PMID: 32920628 Clinical Trial.
-
Markers of neuroinflammation associated with Alzheimer's disease pathology in older adults.Brain Behav Immun. 2017 May;62:203-211. doi: 10.1016/j.bbi.2017.01.020. Epub 2017 Feb 1. Brain Behav Immun. 2017. PMID: 28161476
-
The Associations of Cerebrospinal Fluid Ferritin with Neurodegeneration and Neuroinflammation Along the Alzheimer's Disease Continuum.J Alzheimers Dis. 2022;88(3):1115-1125. doi: 10.3233/JAD-220002. J Alzheimers Dis. 2022. PMID: 35754266
-
Cerebrospinal fluid in the differential diagnosis of Alzheimer's disease: an update of the literature.Expert Rev Neurother. 2024 Nov;24(11):1063-1079. doi: 10.1080/14737175.2024.2400683. Epub 2024 Sep 4. Expert Rev Neurother. 2024. PMID: 39233323 Review.
-
Moving fluid biomarkers for Alzheimer's disease from research tools to routine clinical diagnostics.Mol Neurodegener. 2021 Feb 19;16(1):10. doi: 10.1186/s13024-021-00430-x. Mol Neurodegener. 2021. PMID: 33608044 Free PMC article. Review.
Cited by
-
Ceramide/Sphingosine 1-Phosphate Axis as a Key Target for Diagnosis and Treatment in Alzheimer's Disease and Other Neurodegenerative Diseases.Int J Mol Sci. 2022 Jul 22;23(15):8082. doi: 10.3390/ijms23158082. Int J Mol Sci. 2022. PMID: 35897658 Free PMC article. Review.
-
Untargeted Lipidomic Reveals Potential Biomarkers in Plasma Samples for the Discrimination of Patients Affected by Parkinson's Disease.Molecules. 2025 Feb 12;30(4):850. doi: 10.3390/molecules30040850. Molecules. 2025. PMID: 40005161 Free PMC article.
-
Circulating sphingolipids and subclinical brain pathology: the cardiovascular health study.Front Neurol. 2024 May 3;15:1385623. doi: 10.3389/fneur.2024.1385623. eCollection 2024. Front Neurol. 2024. PMID: 38765262 Free PMC article.
-
Emerging role of non-coding RNAs in neuroinflammation mediated by microglia and astrocytes.J Neuroinflammation. 2023 Jul 23;20(1):173. doi: 10.1186/s12974-023-02856-0. J Neuroinflammation. 2023. PMID: 37481642 Free PMC article. Review.
-
YKL-40 as a biomarker in various inflammatory diseases: A review.Biochem Med (Zagreb). 2024 Feb 15;34(1):010502. doi: 10.11613/BM.2024.010502. Epub 2023 Dec 15. Biochem Med (Zagreb). 2024. PMID: 38125621 Free PMC article. Review.
References
-
- Wishart DS (2016) Emerging applications of metabolomics in drug discovery and precision medicine. Nat Rev Drug Discov 15, 473–484. - PubMed
Publication types
MeSH terms
Substances
Grants and funding
- R01 AG037639/AG/NIA NIH HHS/United States
- UL1 TR000427/TR/NCATS NIH HHS/United States
- S10 OD025245/OD/NIH HHS/United States
- T32 AG000213/AG/NIA NIH HHS/United States
- P2C HD047873/HD/NICHD NIH HHS/United States
- UL1 TR002373/TR/NCATS NIH HHS/United States
- P30 AG062715/AG/NIA NIH HHS/United States
- P50 AG033514/AG/NIA NIH HHS/United States
- R01 AG027161/AG/NIA NIH HHS/United States
- R01 AG054047/AG/NIA NIH HHS/United States
- R01 AG068398/AG/NIA NIH HHS/United States
- P30 AG017266/AG/NIA NIH HHS/United States
- T32 AG000129/AG/NIA NIH HHS/United States
- R01 AG021155/AG/NIA NIH HHS/United States
LinkOut - more resources
Full Text Sources
Medical
Research Materials
