

Association of Primary and Booster Vaccination and Prior Infection With SARS-CoV-2 Infection and Severe COVID-19 Outcomes
- PMID: 36155617
- PMCID: PMC9513711
- DOI: 10.1001/jama.2022.17876
Association of Primary and Booster Vaccination and Prior Infection With SARS-CoV-2 Infection and Severe COVID-19 Outcomes
Abstract
Importance: Data about the association of COVID-19 vaccination and prior SARS-CoV-2 infection with risk of SARS-CoV-2 infection and severe COVID-19 outcomes may guide prevention strategies.
Objective: To estimate the time-varying association of primary and booster COVID-19 vaccination and prior SARS-CoV-2 infection with subsequent SARS-CoV-2 infection, hospitalization, and death.
Design, setting, and participants: Cohort study of 10.6 million residents in North Carolina from March 2, 2020, through June 3, 2022.
Exposures: COVID-19 primary vaccine series and boosters and prior SARS-CoV-2 infection.
Main outcomes and measures: Rate ratio (RR) of SARS-CoV-2 infection and hazard ratio (HR) of COVID-19-related hospitalization and death.
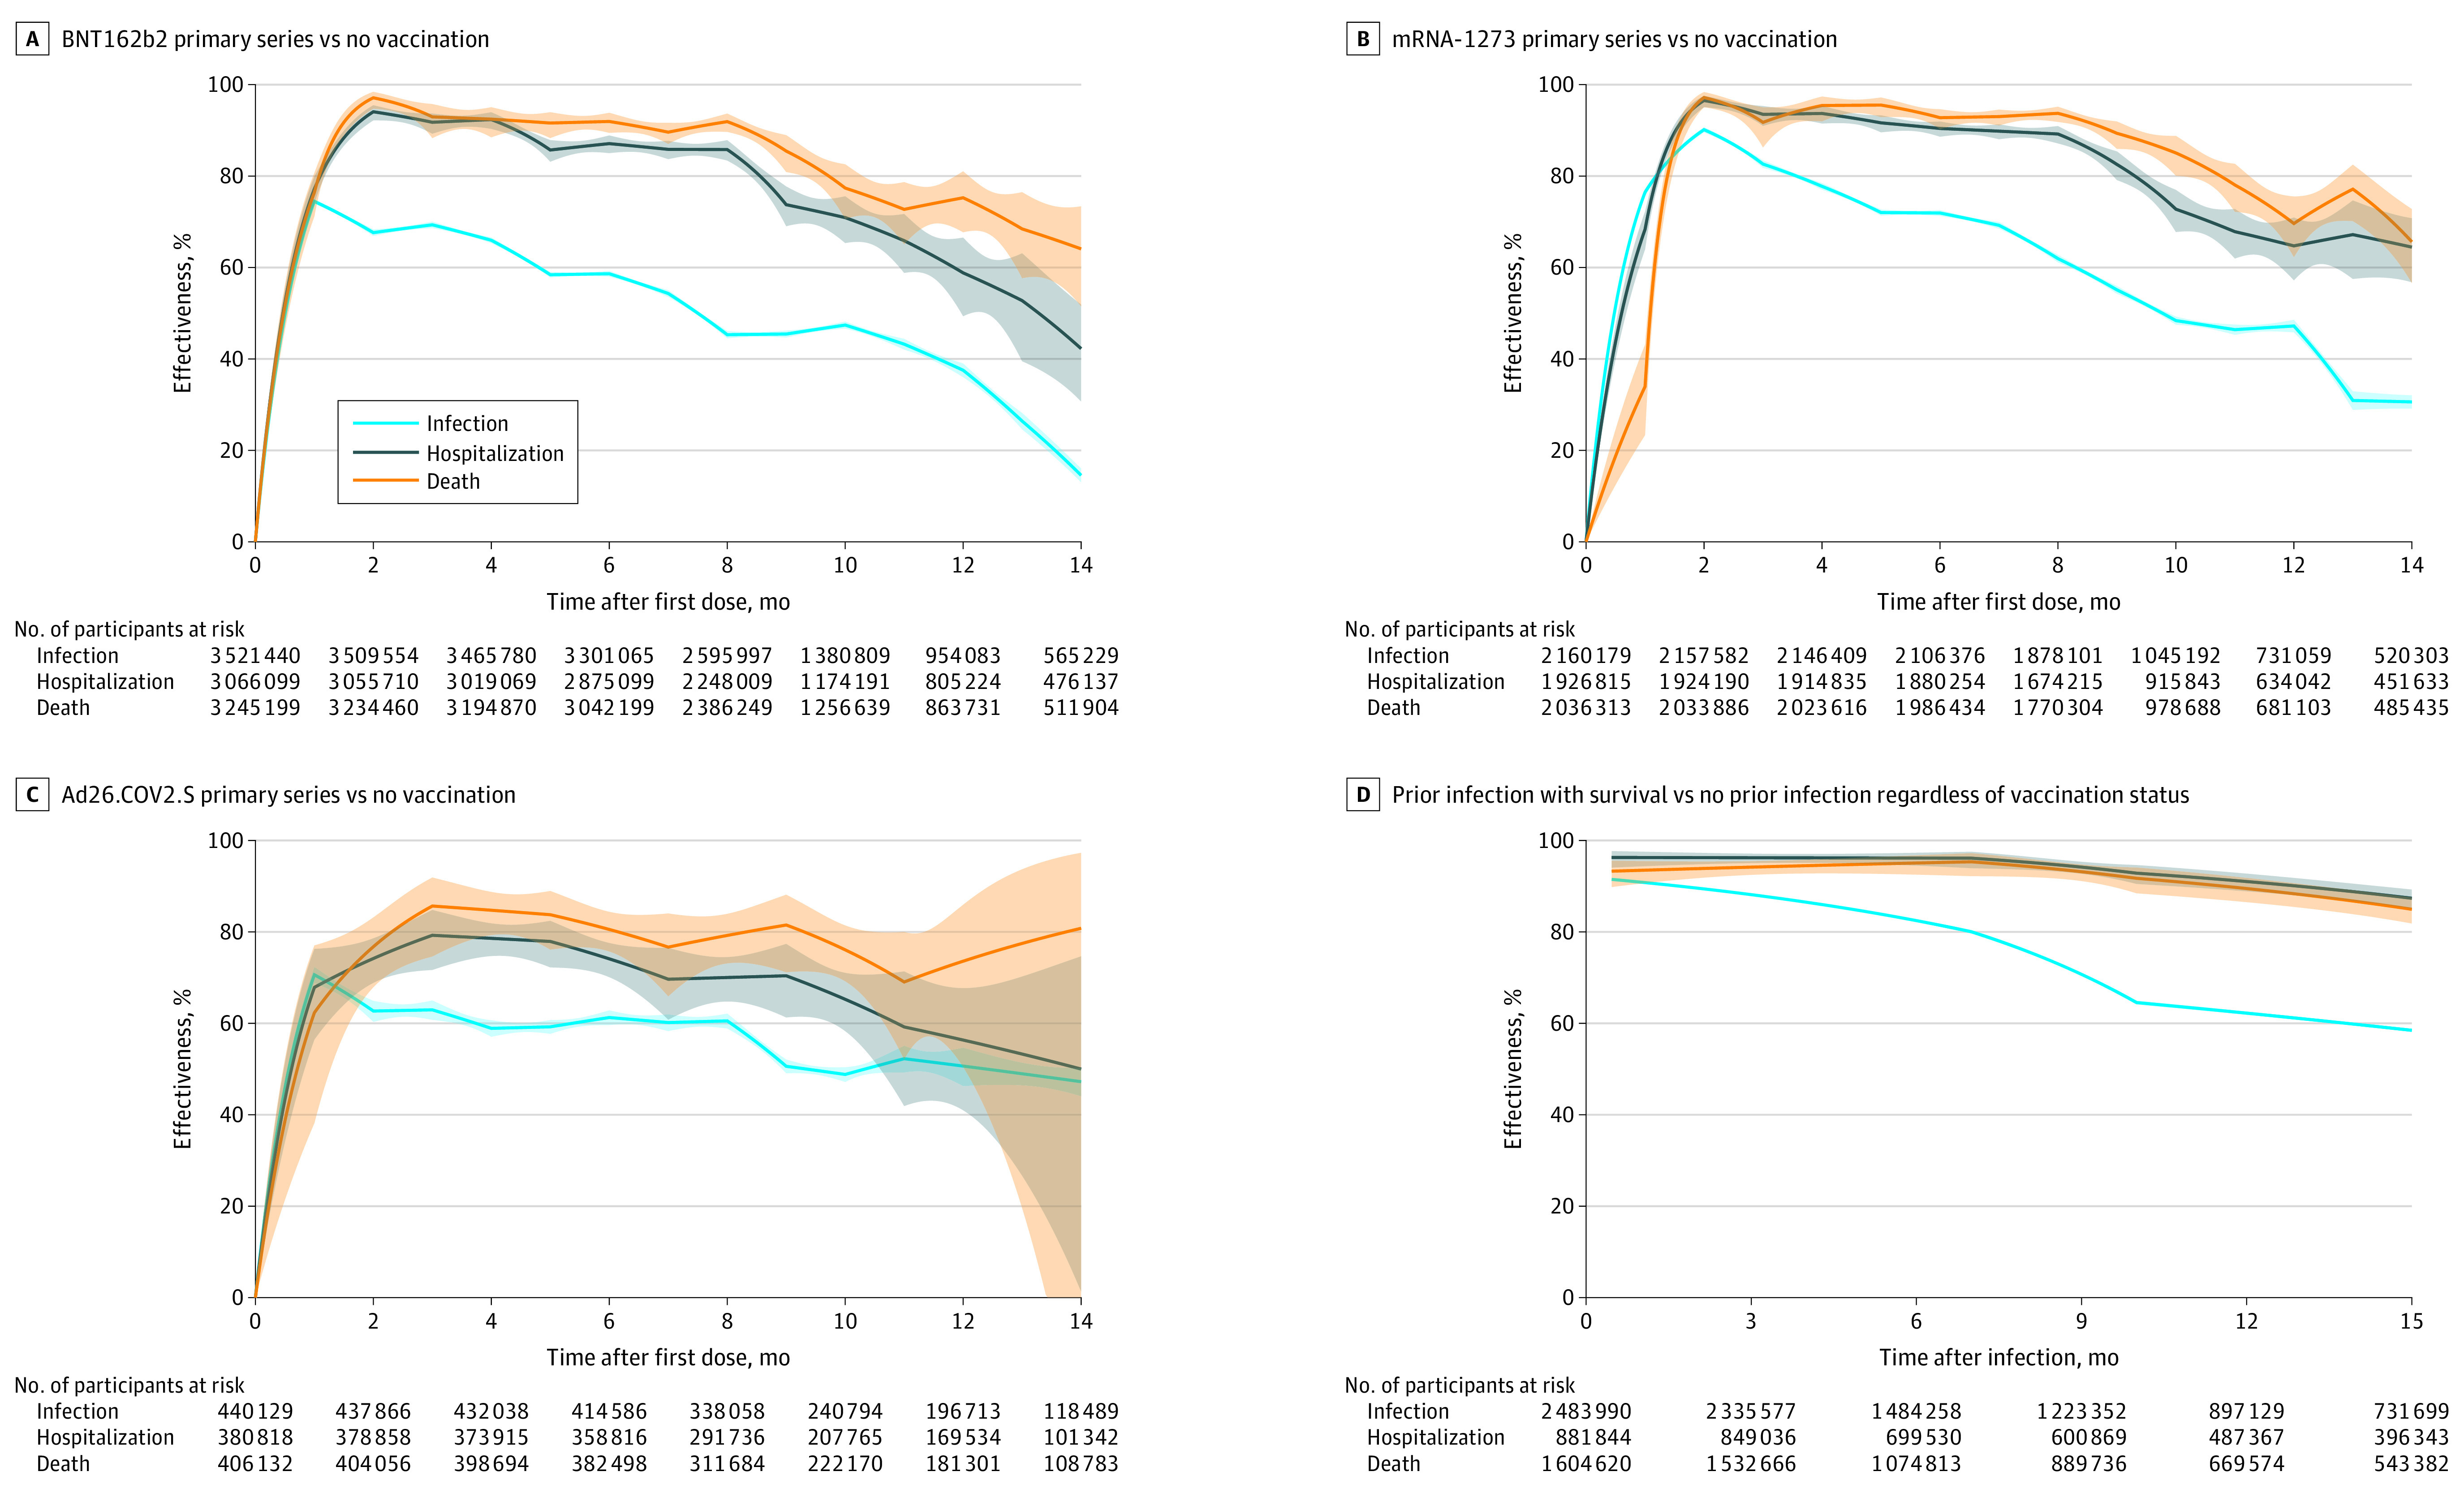
Results: The median age among the 10.6 million participants was 39 years; 51.3% were female, 71.5% were White, and 9.9% were Hispanic. As of June 3, 2022, 67% of participants had been vaccinated. There were 2 771 364 SARS-CoV-2 infections, with a hospitalization rate of 6.3% and mortality rate of 1.4%. The adjusted RR of the primary vaccine series compared with being unvaccinated against infection became 0.53 (95% CI, 0.52-0.53) for BNT162b2, 0.52 (95% CI, 0.51-0.53) for mRNA-1273, and 0.51 (95% CI, 0.50-0.53) for Ad26.COV2.S 10 months after the first dose, but the adjusted HR for hospitalization remained at 0.29 (95% CI, 0.24-0.35) for BNT162b2, 0.27 (95% CI, 0.23-0.32) for mRNA-1273, and 0.35 (95% CI, 0.29-0.42) for Ad26.COV2.S and the adjusted HR of death remained at 0.23 (95% CI, 0.17-0.29) for BNT162b2, 0.15 (95% CI, 0.11-0.20) for mRNA-1273, and 0.24 (95% CI, 0.19-0.31) for Ad26.COV2.S. For the BNT162b2 primary series, boosting in December 2021 with BNT162b2 had the adjusted RR relative to primary series of 0.39 (95% CI, 0.38-0.40) and boosting with mRNA-1273 had the adjusted RR of 0.32 (95% CI, 0.30-0.34) against infection after 1 month and boosting with BNT162b2 had the adjusted RR of 0.84 (95% CI, 0.82-0.86) and boosting with mRNA-1273 had the adjusted RR of 0.60 (95% CI, 0.57-0.62) after 3 months. Among all participants, the adjusted RR of Omicron infection compared with no prior infection was estimated at 0.23 (95% CI, 0.22-0.24) against infection, and the adjusted HRs were 0.10 (95% CI, 0.07-0.14) against hospitalization and 0.11 (95% CI, 0.08-0.15) against death after 4 months.
Conclusions and relevance: Receipt of primary COVID-19 vaccine series compared with being unvaccinated, receipt of boosters compared with primary vaccination, and prior infection compared with no prior infection were all significantly associated with lower risk of SARS-CoV-2 infection (including Omicron) and resulting hospitalization and death. The associated protection waned over time, especially against infection.
Conflict of interest statement
Figures


Comment in
-
Long-term Protection Associated With COVID-19 Vaccination and Prior Infection.JAMA. 2022 Oct 11;328(14):1402-1404. doi: 10.1001/jama.2022.14660. JAMA. 2022. PMID: 36156638 Free PMC article. No abstract available.
Comment on
-
Long-term Protection Associated With COVID-19 Vaccination and Prior Infection.JAMA. 2022 Oct 11;328(14):1402-1404. doi: 10.1001/jama.2022.14660. JAMA. 2022. PMID: 36156638 Free PMC article. No abstract available.
References
-
- US Dept of Health and Human Services . COVID-19 Pandemic Response, Laboratory Data Reporting: CARES Act Section 18115. Updated January 8, 2021. Accessed January 11, 2022. https://www.hhs.gov/sites/default/files/covid-19-laboratory-data-reporti...
-
- Andersen PK, Gill RD. Cox’s regression model for counting processes: a large sample study. Ann Stat. 1982;10(4):1100-1120. doi:10.1214/aos/1176345976 - DOI
-
- Cox DR. Regression models and life-tables. J R Stat Soc B. 1972;34(2):187-202.
Publication types
MeSH terms
Substances
Grants and funding
LinkOut - more resources
Full Text Sources
Other Literature Sources
Medical
Research Materials
Miscellaneous
