

Photosymbiont associations persisted in planktic foraminifera during early Eocene hyperthermals at Shatsky Rise (Pacific Ocean)
- PMID: 36155636
- PMCID: PMC9512218
- DOI: 10.1371/journal.pone.0267636
Photosymbiont associations persisted in planktic foraminifera during early Eocene hyperthermals at Shatsky Rise (Pacific Ocean)
Erratum in
-
Correction: Photosymbiont associations persisted in planktic foraminifera during early Eocene hyperthermals at Shatsky Rise (Pacific Ocean).PLoS One. 2023 Oct 26;18(10):e0293770. doi: 10.1371/journal.pone.0293770. eCollection 2023. PLoS One. 2023. PMID: 37883358 Free PMC article.
Abstract
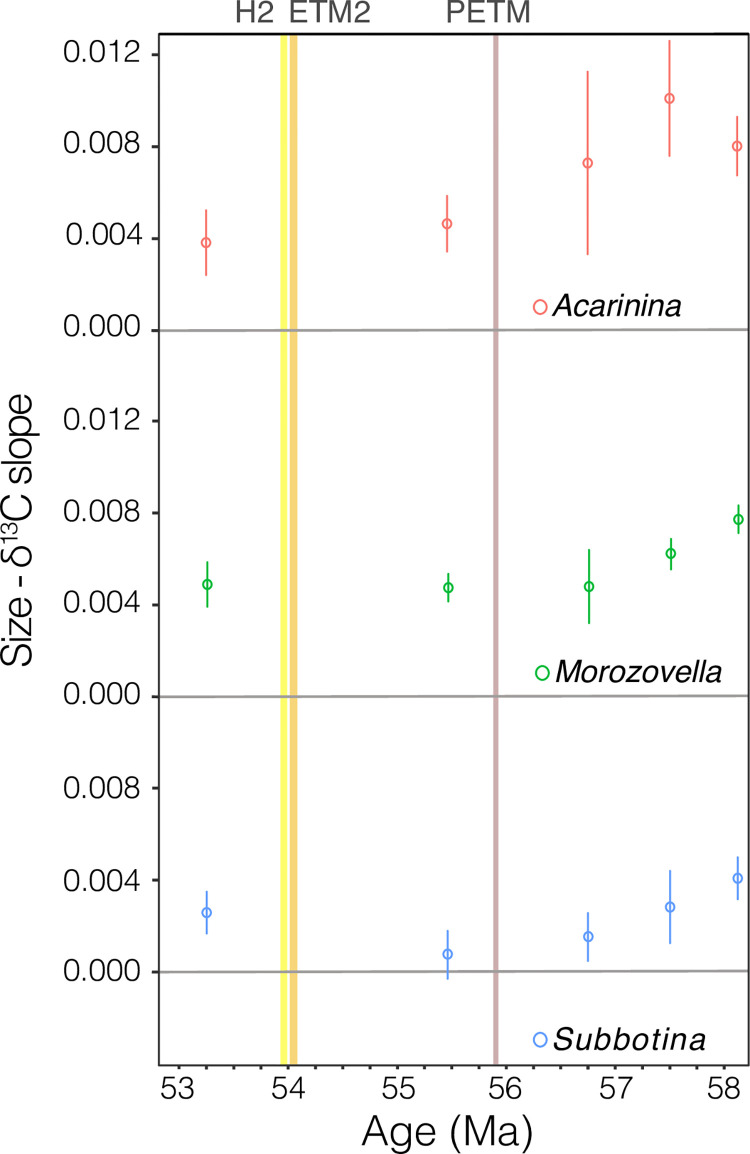
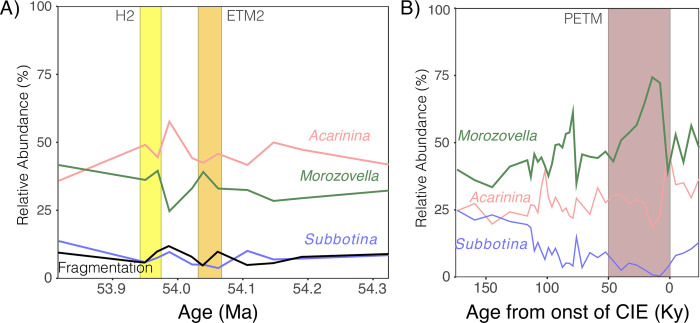
Understanding the sensitivity of species-level responses to long-term warming will become increasingly important as we look towards a warmer future. Here, we examine photosymbiont associations in planktic foraminifera at Shatsky Rise (ODP Site 1209, Pacific Ocean) across periods of global warming of differing magnitude and duration. We compare published data from the Paleocene-Eocene Thermal Maximum (PETM; ~55.9 Ma) with data from the less intense Eocene Thermal Maximum 2 (ETM2; ~54.0 Ma), and H2 events (~53.9 Ma). We use a positive relationship between test size and carbon isotope value (size-δ13C) in foraminifera shells as a proxy for photosymbiosis in Morozovella subbotinae and Acarinina soldadoensis, and find no change in photosymbiont associations during the less intense warming events, in contrast with PETM records indicating a shift in symbiosis in A. soldadoensis (but not M. subbotinae). Declines in abundance and differing preservation potential of the asymbiotic species Subbotina roesnaesensis along with sediment mixing likely account for diminished differences in δ13C between symbiotic and asymbiotic species from the PETM and ETM2. We therefore conclude that photosymbiont associations were maintained in both A. soldadoensis and M. subbotinae across ETM2 and H2. Our findings support one or both of the hypotheses that 1) changing symbiotic associations in response to warming during the PETM allowed A. soldadoensis and perhaps other acarininids to thrive through subsequent hyperthermals or 2) some critical environmental threshold value was not reached in these less intense hyperthermals.
Conflict of interest statement
The authors have declared that no competing interests exist.
Figures


References
-
- Song H, Tong J, Xiong Y, Sun D, Tian L, Song H. The large increase of δ13C carb-depth gradient and the end-Permian mass extinction. Sci China Earth Sci. 2012. 55(7):1101–1109.
-
- McInerney FA, Wing SL. The Paleocene-Eocene Thermal Maximum: a perturbation of carbon cycle, climate, and biosphere with implications for the future. Annu Rev Earth Planet Sci. 2011. 39:489–516.
-
- Speijer R, Scheibner C, Stassen P, Morsi AMM. Response of marine ecosystems to deep-time global warming: a synthesis of biotic patterns across the Paleocene-Eocene thermal maximum (PETM). Austrian J Earth Sci. 2012. 105(1):6–16.
Publication types
MeSH terms
Substances
LinkOut - more resources
Full Text Sources
