. 2022 Sep 26:11:e82766.
doi: 10.7554/eLife.82766.

Post-phagocytosis activation of NLRP3 inflammasome by two novel T6SS effectors

Affiliations

Post-phagocytosis activation of NLRP3 inflammasome by two novel T6SS effectors

Hadar Cohen et al. Elife. .

Abstract

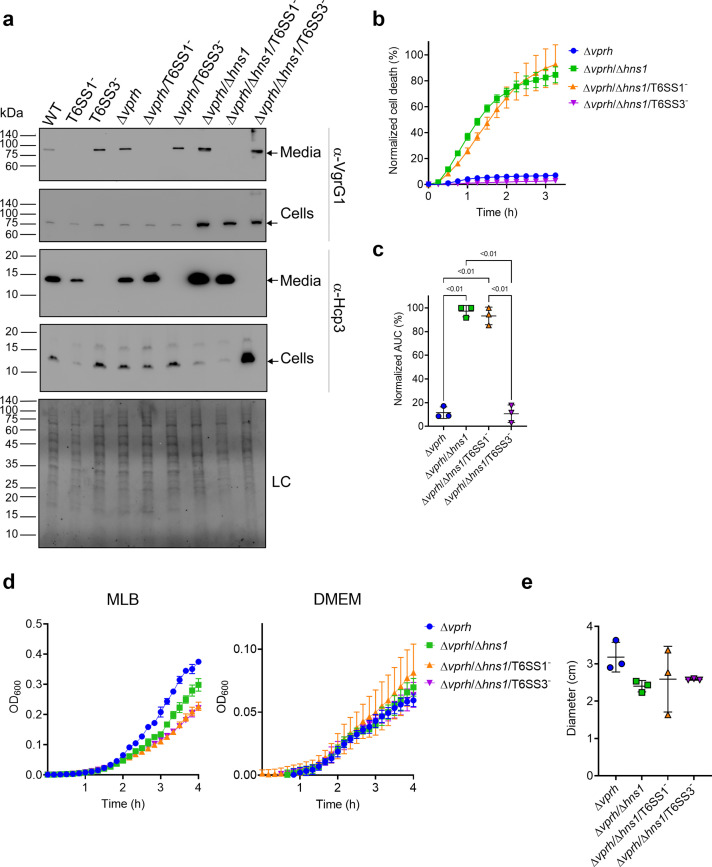
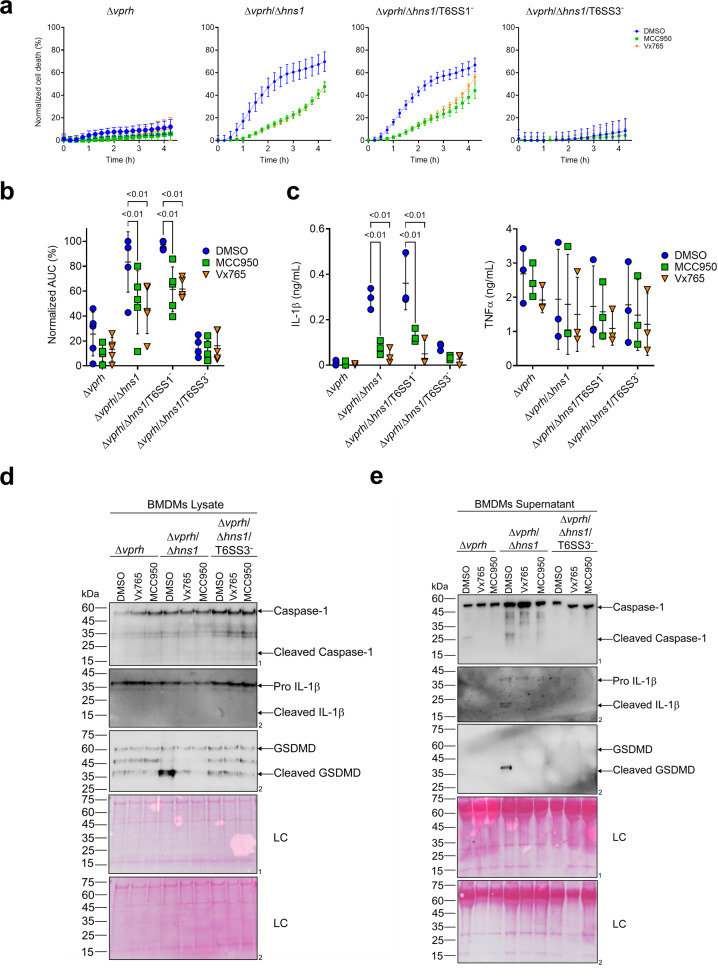
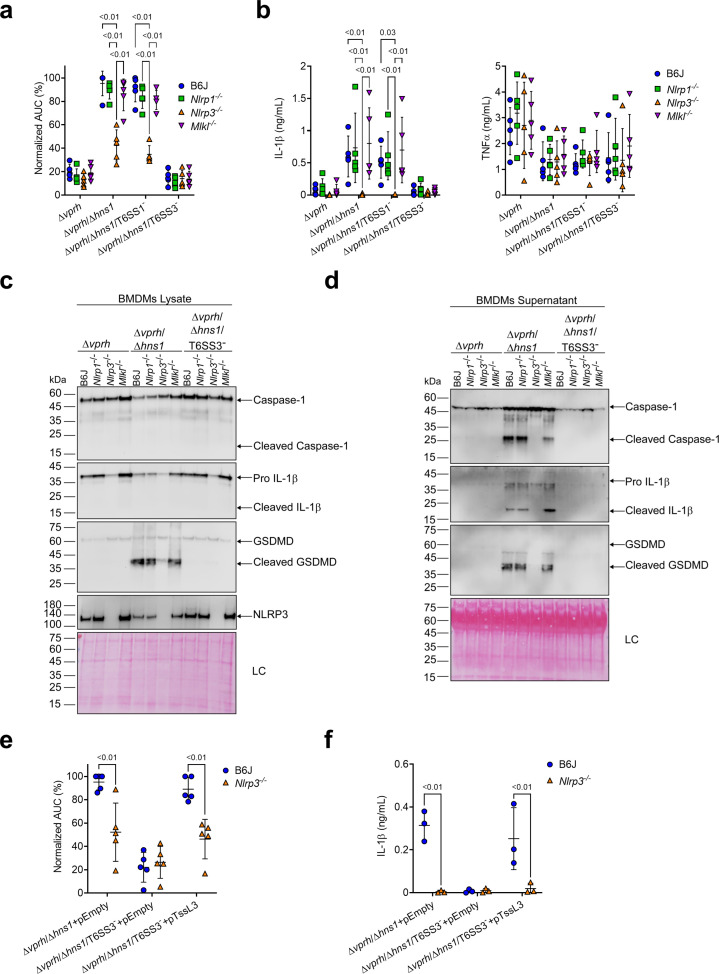
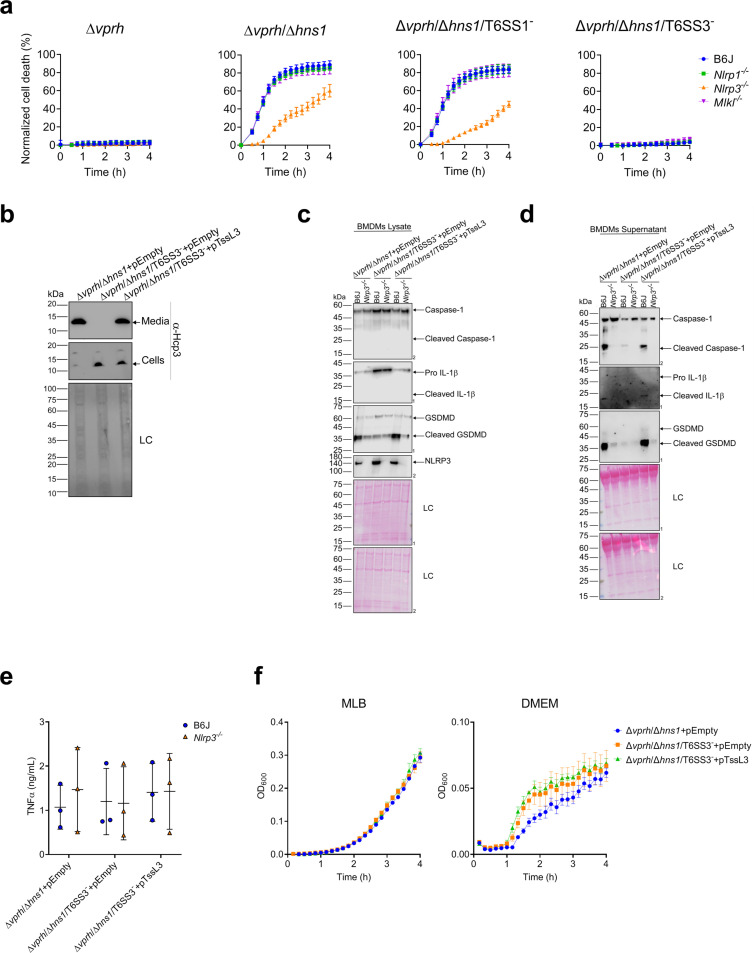
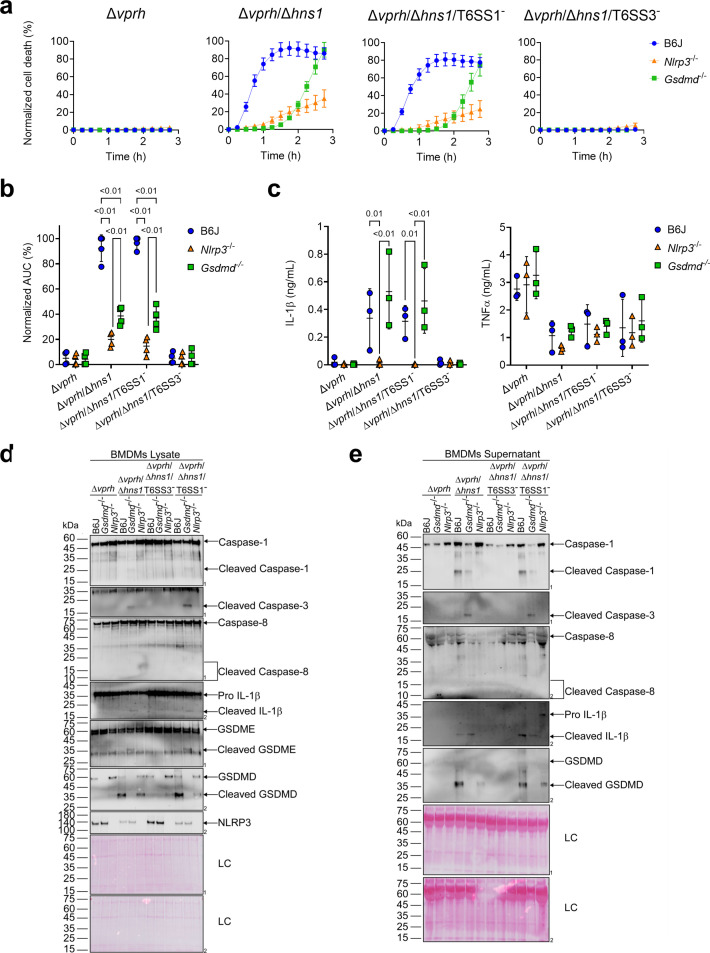
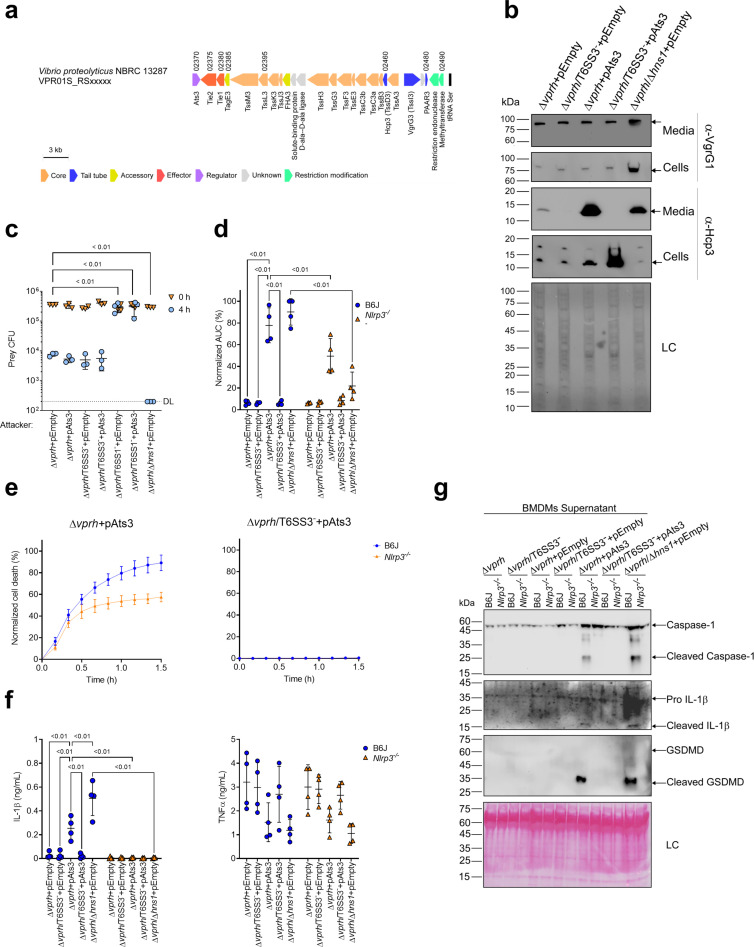
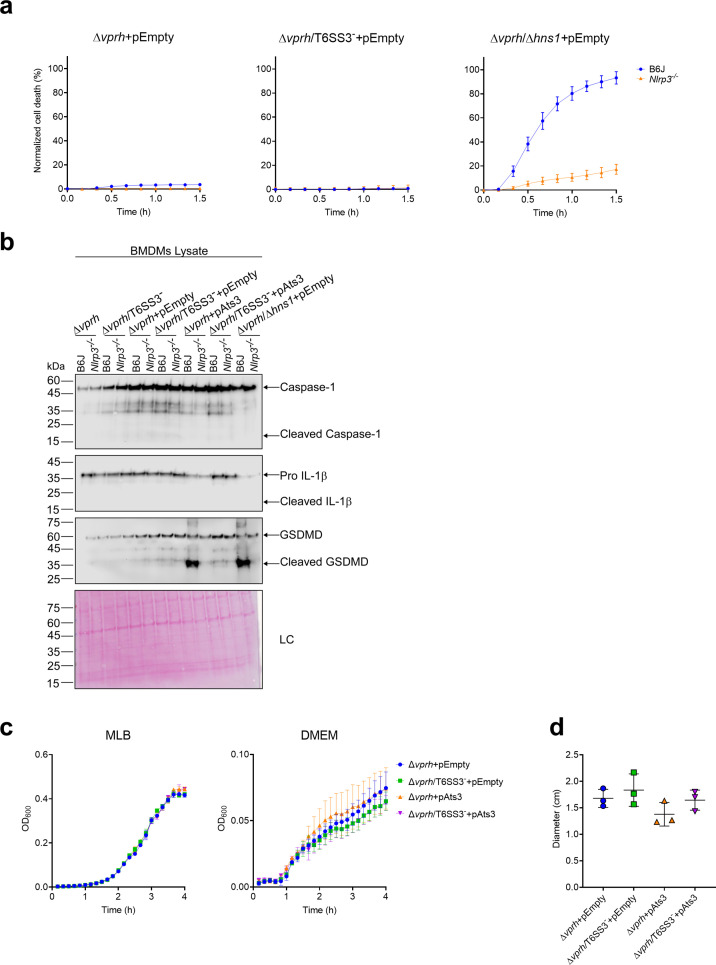
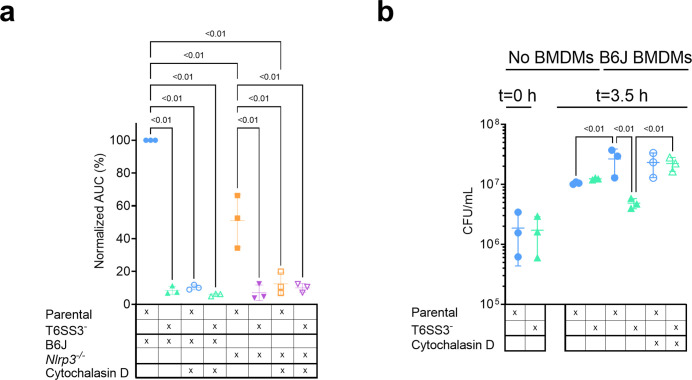
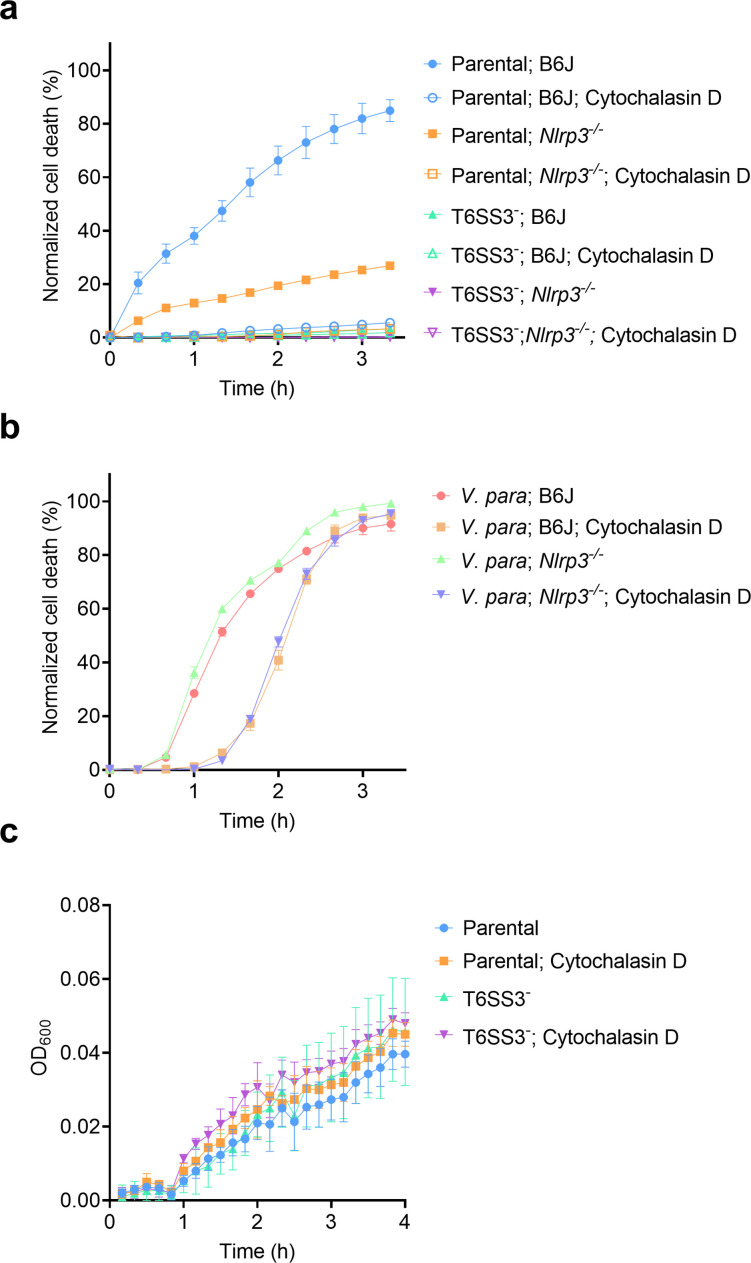
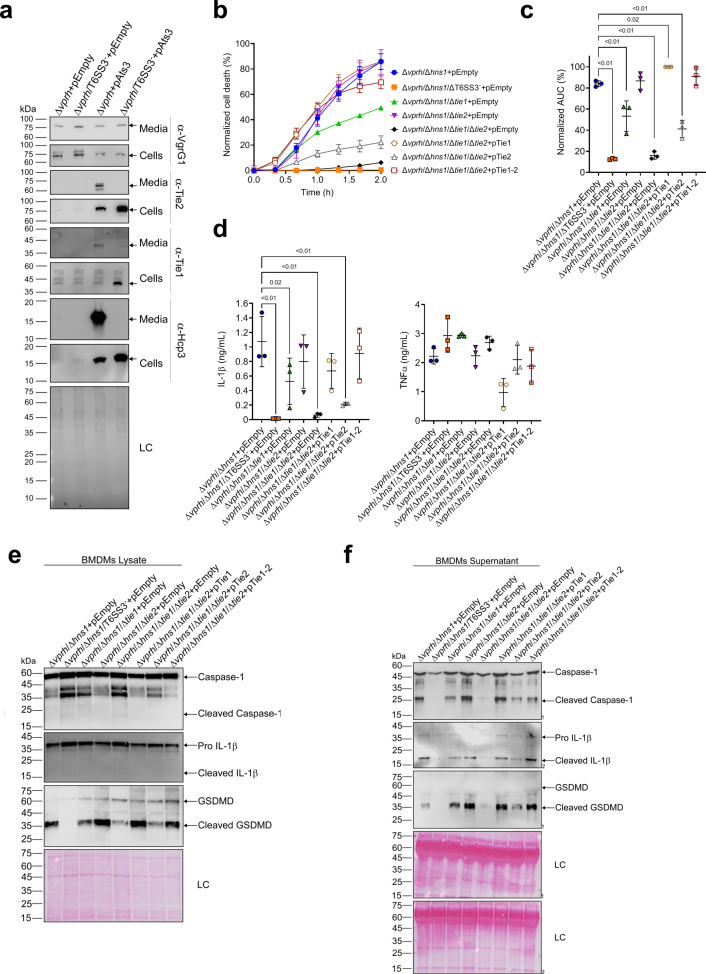
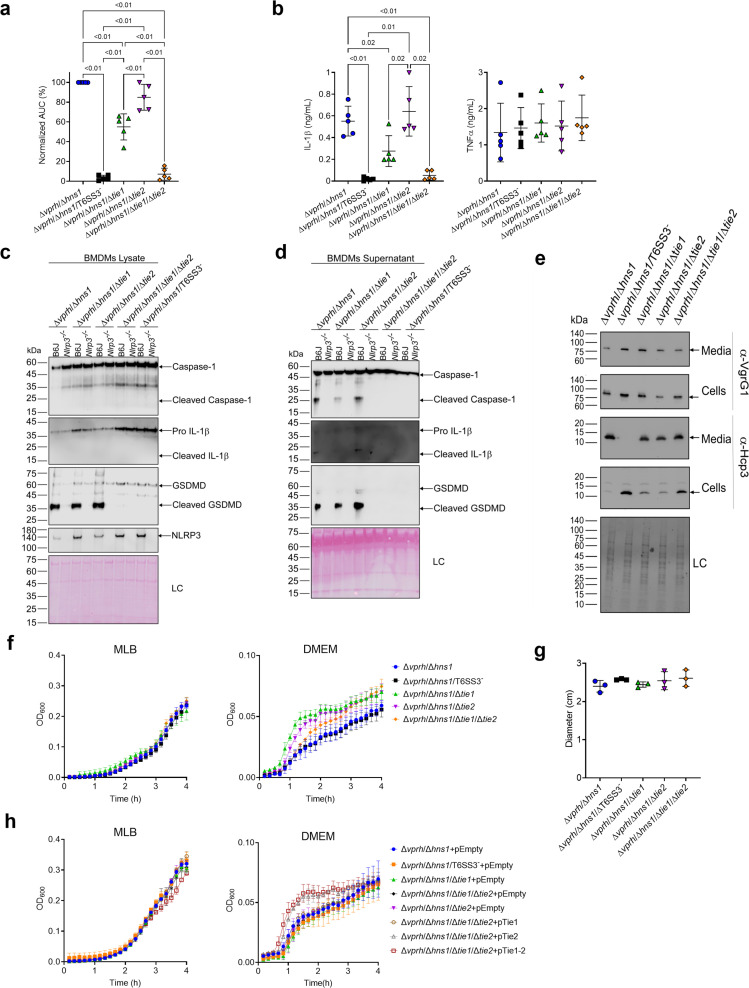
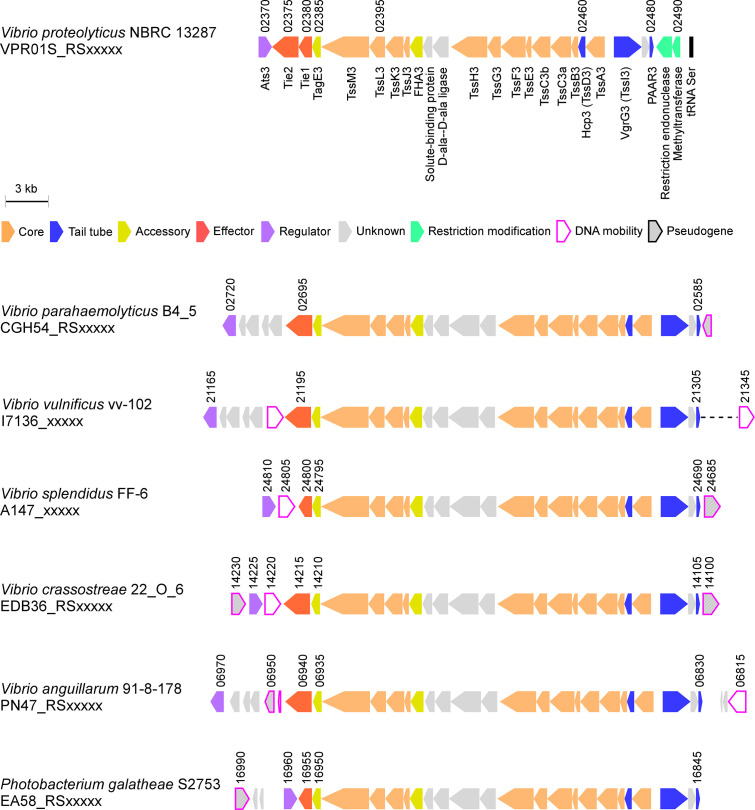
The type VI secretion system (T6SS) is used by bacteria to deliver toxic effectors directly into target cells. Most T6SSs mediate antibacterial activities, whereas the potential anti-eukaryotic role of T6SS remains understudied. Here, we found a Vibrio T6SS that delivers two novel effectors into mammalian host immune cells. We showed that these effectors induce a pyroptotic cell death in a phagocytosis-dependent manner; we identified the NLRP3 inflammasome as being the underlying mechanism leading to the T6SS-induced pyroptosis. Moreover, we identified a compensatory T6SS-induced pathway that is activated upon inhibition of the canonical pyroptosis pathway. Genetic analyses revealed possible horizontal spread of this T6SS and its anti-eukaryotic effectors into emerging pathogens in the marine environment. Our findings reveal novel T6SS effectors that activate the host inflammasome and possibly contribute to virulence and to the emergence of bacterial pathogens.

Keywords: T6SS; caspase; cell death; gasdermin; immunology; infectious disease; inflammation; microbiology; mouse; pyroptosis; secretion system; vibrio proteolyticus.


Conflict of interest statement

HC, NB, CF, LE, DS, MG No competing interests declared

Figures

Figure 1.
Figure 1.. T6SS3 induces cell death in primary macrophages.
(a) Expression (cells) and secretion (media) of Hcp3 and VgrG1 from the indicated V. proteolyticus strains were detected by immunoblotting using specific antibodies against Hcp3 and VgrG1, respectively. Loading control (LC) is shown for total protein lysate. Arrows denote the expected band size. (b–c) Assessment of cell death upon infection of bone marrow-derived macrophages (BMDMs) with V. proteolyticus strains. Approximately 3.5×10⁴ BMDMs were seeded into 96-well plates in triplicate and were primed with lipopolysaccharides (LPS) (100 ng/mL) 3 hr prior to infection with V. proteolyticus strains at multiplicity of infection (MOI) 5. Propidium iodide (PI) was added to the medium prior to infection, and its kinetic uptake was assessed using real-time microscopy (IncucyteZOOM) (b) and then analyzed as the area under the curve (AUC) of the percentage of PI-positive cells normalized to the number of cells in the wells (c). (d) Growth of V. proteolyticus strains, used in (b), in marine lysogeny broth (MLB) or Dulbecco’s Modified Eagle Medium (DMEM) media at 30 or 37°C, respectively, measured as absorbance at 600 nm (OD600). (e) Swimming motility of V. proteolyticus strains used in (b), measured as migration of a soft-agar plate after overnight incubation at 30°C. The data in (a, b, d) are a representative experiment out of three independent experiments. The data in (c) and (e) are the combined results of three independent experiments presented as the mean ± SD. In (c) and (e), statistical comparisons between the different V. proteolyticus strains were performed using a one-way ANOVA, followed by Tukey’s multiple comparison test. Significant p-values (<0.05) are denoted above.
Figure 2.
Figure 2.. T6SS3 induces pyroptotic cell death in BMDMs.
Approximately 3.5×10⁴ wild-type bone marrow-derived macrophages (BMDMs) were seeded into 96-well plates in six replicates and were primed using lipopolysaccharides (LPS) (100 ng/mL) for 3 hr prior to infection with V. proteolyticus strains at multiplicity of infection (MOI) 5. Where indicated, inflammasome inhibitors Vx765 (25 μM) or MCC950 (2 μM), with the addition of propidium iodide (PI) (1 μg/mL), were added to the cells 30 min prior to bacterial infection. Dimethyl sulfoxide (DMSO) was used as the solvent control. (a–b) PI kinetic uptake was assessed using real-time microscopy (IncucyteZOOM) (a) and then graphed as the area under the curve (AUC) of the percentage of PI-positive cells normalized to the number of cells in the wells (b). (c) Cell supernatants from experiments described in (a) were collected 3 hr postinfection. IL-1β and TNFα secretion were measured using commercial ELISA kits. (d-e) Caspase-1, gasdermin D (GSDMD), and IL-1β were detected in BMDM lysate (d) and supernatant (e) by immunoblotting (the number on the right of each blot denotes the blot number). The data in (a) represent n≥3 independent experiments. Statistical comparisons in (b–c) between the different treatments were performed using Repeated measures (RM) two-way ANOVA, followed by Turkey’s multiple comparison test. The results are shown as the mean ± SD of n≥3 independent experiments; significant differences (p<0.05) are denoted only for comparisons between inflammasome inhibitors of cells infected with the same bacterial strain. The results shown in (d-e) represent two independent experiments. Arrows denote the expected band size.
Figure 3.
Figure 3.. T6SS3 activates the NLRP3 inflammasome in BMDMs.
Approximately 3.5×10⁴ wild-type (B6J), Nlrp1-/-, Nlrp3-/-, and Mlkl-/- bone marrow-derived macrophages (BMDMs) were seeded into 96-well plates in six replicates and were primed using lipopolysaccharides (LPS) (100 ng/mL) for 3 hr prior to infection with V. proteolyticus strains at multiplicity of infection (MOI) 5. In (e–f), 0.05% arabinose was added to the media prior bacterial infection. (a, e) Propidium iodide (PI) uptake was assessed using real-time microscopy (IncucyteZOOM) and then graphed as the area under the curve (AUC) of the percentage of PI-positive cells normalized to the number of cells in the wells. (b, f) Cell supernatants from experiments described in (a) or (e), respectively, were collected 3 hr postinfection. IL-1β and TNFα secretion were measured using commercial ELISA kits. (c–d) NLRP3, Caspase-1, gasdermin D (GSDMD), and IL-1β were detected in BMDM lysate (c) and supernatant (d) by immunoblotting (the number on the right side of each blot denotes the blot number). Arrows denote the expected band size. Statistical comparisons in (a–b) and (e–f) between the different treatments were performed using RM two-way ANOVA, followed by Turkey’s multiple comparison test. The results are shown as the mean ± SD of 5 independent experiments; significant differences (p<0.05) are denoted only for comparisons between mice strains infected with the same bacterial strain. The results in (c–d) represent two independent experiments.
Figure 3—figure supplement 1.
Figure 3—figure supplement 1.. T6SS3 activates the NLRP3 inflammasome in BMDMs.
(a) Propidium iodide (PI) uptake was assessed using real-time microscopy (IncucyteZOOM). The data are another depiction of the results shown in the experiment described in main Figure 3a. (b) The expression (cells) and secretion (media) of VgrG1 and Hcp3 from V. proteolyticus strains were detected by immunoblotting using specific antibodies. Loading control (LC) is shown for total protein lysate. An arrow denotes the expected band size of Hcp3. (c–d) NLRP3, Caspase-1, gasdermin D (GSDMD), and IL-1β were detected in bone marrow-derived macrophages (BMDM) lysates (c) and supernatants (d) from experiments described in main Figure 3e–f by immunoblotting (the number on the right side of each blot denotes the blot number). (e) Cell supernatants from experiments described in main Figure 3e–f were collected 3 hr postinfection. TNFα secretion was measured using a commercial ELISA kit. (f) Growth of V. proteolyticus strains in marine lysogeny broth (MLB) or Dulbecco’s Modified Eagle Medium (DMEM) media supplemented with 0.05% arabinose at 30°C, measured as absorbance at 600 nm (OD600). The data shown in (a–b, f) and (c–d) are a representative experiment out of n≥3 and two independent experiments, respectively. Statistical comparisons in (e) were performed using RM two-way ANOVA, followed by Turkey’s multiple comparison test. The results are shown as the mean ± SD of three independent experiments; significant differences were considered as p<0.05.
Figure 4.
Figure 4.. GSDME partially compensates for GSDMD absence in T6SS3-induced pyroptosis and IL-1β secretion.
Approximately 3.5×10⁴ wild-type (B6J), Nlrp3-/- and Gsdmd-/- bone marrow-derived macrophages (BMDMs) were seeded into 96-well plates in six replicates and were primed using lipopolysaccharides (LPS) (100 ng/mL) for 3 hr prior to infection with V. proteolyticus strains at multiplicity of infection (MOI) 5. (a–b) PI uptake was assessed using real-time microscopy (IncucyteZOOM) (a) and then graphed as the area under the curve (AUC) of the percentage of PI-positive cells normalized to the number of cells in the wells (b). (c) Cell supernatants described in (a) were collected 3 hr post infection. IL-1β and TNFα secretion were measured using commercial ELISA kits. (d-e) NLRP3, Caspase-1, Caspase-3, Caspase-8, gasdermin (GSDM)D, GSDME, and IL-1β were detected in BMDM lysate (d) and supernatant (e) by immunoblotting (the number on the right side of each blot denotes the blot number). Arrows denote the expected band size; denote the expected band sizes for cleaved Caspase-8. The data in (a) represent n≥3 independent experiments. Statistical comparisons in (b–c) between the different treatments were performed using RM two-way ANOVA, followed by Turkey’s multiple comparison test. The results in (b,c) are shown as the mean ± SD of n≥3 independent experiments; significant differences (p<0.05) are denoted only for comparisons between mice strains infected with the same bacterial strain. The results shown in (d-e) represent two independent experiments.
Figure 5.
Figure 5.. Activation of T6SS3 by Ats3 is sufficient to induce the NLRP3 inflammasome.
(a) The T6SS3 gene cluster. Genes are represented by arrows indicating direction of transcription. Locus tags (vpr01s_RSxxxxx) are denoted above; encoded proteins and known domains are denoted below. (b) The expression (cells) and secretion (media) of Hcp3 and VgrG1 were detected by immunoblotting using specific antibodies against Hcp3 and VgrG1, respectively. Loading control (LC) is shown for total protein lysate. (c) Viability counts of E. coli XL-1 blue prey before (0 hr) and after (4 hr) co-incubation with the indicated attackers, on media containing 3% (w/v) NaCl and 0.1% (w/v) arabinose at 30°C. (d-g) Approximately 3.5×10⁴ wild-type (B6J) and Nlrp3-/- bone marrow-derived macrophages (BMDMs) were seeded into 96-well plates in six replicates and were primed using lipopolysaccharides (LPS) (100 ng/mL) for 3 hr prior to infection with V. proteolyticus strains at multiplicity of infection (MOI) 5. Arabinose (0.05% w/v) was added to the media prior bacterial infection. (d-e) Propidium iodide (PI) uptake was assessed using real-time microscopy (IncucyteZOOM) and then was graphed as the area under the curve (AUC) of the percentage of PI-positive cells normalized to the number of cells in the wells. (f) Cell supernatants from experiments described in (a) were collected 3 hr postinfection. IL-1β and TNFα secretion were measured using commercial ELISA kits. (g) NLRP3, Caspase-1, gasdermin D (GSDMD), and IL-1β were detected in BMDM supernatants by immunoblotting. Arrows denote the expected band size. The data in (b–c, e) and (g) represent the results of n≥3 and n=2 independent experiment, respectively. The data in (c) are shown as the mean ± SD. Statistical comparisons in (c) between samples at the 4 hr timepoint were performed using an unpaired, two-tailed Student’s t-test; significant differences (p<0.05) are denoted above. DL, assay detection limit. Statistical comparisons in (d) and (f) between the different treatments were performed using RM two-way ANOVA, followed by Turkey’s multiple comparison test. The results are shown as the mean ± SD of n≥4 independent experiments; significant differences (p<0.05) are denoted for comparisons between infections of cells from the same mouse strain, and between infections using the same V. proteolyticus strain.
Figure 5—figure supplement 1.
Figure 5—figure supplement 1.. Activation of T6SS3 by Ats3 is sufficient to induce the NLRP3 inflammasome.
(a) Propidium iodide (PI) uptake was assessed using real-time microscopy (IncucyteZOOM). The data are another depiction of the results shown in the experiment described in main Figure 5d–g. (b) NLRP3, Caspase-1, gasdermin D (GSDMD), and IL-1β were detected in bone marrow-derived macrophages (BMDMs) lysates by immunoblotting. Arrows denote the expected band size. The samples were taken from the experiment described in main Figure 5d–g. (c) Growth of V. proteolyticus strains, used in main Figure 5, in marine lysogeny broth (MLB) or Dulbecco’s Modified Eagle Medium (DMEM) media supplemented with 0.05% arabinose at 30°C, measured as absorbance at 600 nm (OD600). (d) Swimming motility of V. proteolyticus strains, measured as migration of a soft-agar plate supplemented with 0.1% arabinose after overnight incubation at 30°C. The data are shown as the mean ± SD of three biological repeats. Statistical comparison was preformed using RM one-way ANOVA, follow by Turkey’s multiple comparison test.
Figure 6.
Figure 6.. V. proteolyticus T6SS3-induced pyroptosis requires phagocytosis.
Approximately 3.5×10⁴ wild-type (B6J) and Nlrp3-/- bone marrow-derived macrophages (BMDMs) were seeded into 96-well plates in n≥3 replicates and were primed using lipopolysaccharides (LPS) (100 ng/mL) for 3 hr prior to infection with V. proteolyticus strains at multiplicity of infection (MOI) 5. Arabinose (0.05% w/v) was added to the media prior to bacterial addition. When indicated, cytochalasin D (5 µM) was added to the cells 45 min prior to bacterial infection. (a) Propidium iodide (PI) uptake was assessed using real-time microscopy (IncucyteZOOM) and then graphed as the area under the curve (AUC) of the percentage of PI-positive cells normalized to the number of cells in the wells. (b) Bacterial counts of V. proteolyticus strains before (t=0 hr) and after (t=3.5 hr) BMDMs infection C. The results in (a,b) are shown as the mean ± SD of n=3 independent experiments. Statistical comparisons in (a) between the different treatments were performed using RM one-way ANOVA, followed by Sidak multiple comparison test. Statistical comparison in (b) between the different treatments were performed using RM one-way ANOVA. Significant differences (p<0.05) are denoted. Parental, V. proteolyticus Δvprh +pAts3; T6SS3-, V. proteolyticus ΔvprhtssL3+pAts3.
Figure 6—figure supplement 1.
Figure 6—figure supplement 1.. V.proteolyticus T6SS3 activity requires phagocytosis.
(a–b) Approximately 3.5×10⁴ wild-type and Nlrp3-/- bone marrow-derived macrophages (BMDMs) were seeded into 96-well plates in six replicates and were primed using lipopolysaccharides (LPS) (100 ng/mL) for 3 hr prior to infection with (a) V. proteolyticus (b) or V. parahaemolyticus strains at multiplicity of infection (MOI) 5. (a–b) Propidium iodide (PI) uptake was assessed using real-time microscopy (IncucyteZOOM) and then graphed as the area under the curve (AUC) of the percentage of PI-positive cells normalized to the number of cells in the wells. Parental, V. proteolyticusvprh +pAts3; V. para, V. parahaemolyticus RIMD 2210633 ∆tdhAS derivative. (c) Growth of V. proteolyticus strains used in main Figure 6a–e in Dulbecco’s Modified Eagle Medium (DMEM) media at 37°C, measured as absorbance at 600 nm (OD600). Arabinose (0.05% w/v) was added to induce expression from the plasmid. Where indicated, 5 µM cytochalasin D were added to cells 45 min prior infection to inhibit phagocytosis. The data in (a–c) are shown as the mean ± SD, and are a representative experiment out of n=3 independent experiments.
Figure 7.
Figure 7.. Two T6SS3 effectors are necessary and sufficient to induce pyroptosis.
(a) The expression (cells) and secretion (media) of Tie1, Tie2, Hcp3, and VgrG1 from V. proteolyticus strains were detected by immunoblotting using custom-made antibodies. Loading control (LC) is shown for total protein lysate. (b–f) Approximately 3.5×10⁴ wild-type bone marrow-derived macrophages (BMDMs) were seeded into 96-well plates in six replicates and were primed using lipopolysaccharides (LPS) (100 ng/mL) for 3 hr prior to infection with V. proteolyticus strains at multiplicity of infection (MOI) 5. Arabinose (0.05% w/v) and 250 µg/mL kanamycin were added to the media prior to bacterial infection. (b–c) Propidium iodide (PI) uptake was assessed using real-time microscopy (IncucyteZOOM) (b) and then graphed as the area under the curve (AUC) of the percentage of PI-positive cells normalized to the number of cells in the wells (c). (d) Cell supernatants from experiments described in (b) were collected 3 hr post infection. IL-1β and TNFα secretion were measured using commercial ELISA kits. (e–f) NLRP3, Caspase-1, gasdermin D (GSDMD), and IL-1β were detected in BMDM lysates (e) and supernatants (f) by immunoblotting. The data in (a–b) and (e–f) represent three and two independent experiments, respectively. Statistical comparisons in (c–d) between the different treatments were performed using RM one-way ANOVA, followed by Dunnett’s multiple comparison test. The results are shown as the mean ± SD of three independent experiments; significant differences (p<0.05) are denoted only for comparisons of treatments to the Δvprhhns1+pEmpty treatment. In (a, e, f), arrows denote the expected band size.
Figure 7—figure supplement 1.
Figure 7—figure supplement 1.. Two T6SS3 effectors are necessary and sufficient to induce pyroptotic cell death.
(a–d) Approximately 3.5×10⁴ wild-type and Nlrp3-/- bone marrow-derived macrophages (BMDMs) were seeded into 96-well plates in six replicates and were primed using lipopolysaccharides (LPS) (100 ng/mL) for 3 hr prior to infection with V. proteolyticus strains at multiplicity of infection (MOI) 5. (a) Propidium iodide (PI) uptake was assessed using real-time microscopy (IncucyteZOOM) and then graphed as the area under the curve (AUC) of the percentage of PI-positive cells normalized to the number of cells in the wells. (b) Cell supernatants from experiments described in (a) were collected 3 hr post infection. IL-1β and TNFα secretion were measured using commercial ELISA kits. (c–d) NLRP3, Caspase-1, gasdermin D (GSDMD), and IL-1β were detected in BMDM lysates (c) and supernatants (d) by immunoblotting. Arrows denote the expected band size. (e) The expression (cells) and secretion (media) of VgrG1 and Hcp3 from V. proteolyticus strains were detected by immunoblotting using specific antibodies. Loading control (LC) is shown for total protein lysate. (f–h) Growth of V. proteolyticus strains, used in (a–d) and in main Figure 7c–g, in marine lysogeny broth (MLB) or Dulbecco’s Modified Eagle Medium (DMEM) media (in hr, 0.05% arabinose was added at t=0 hr to induce expression from the plasmid) at 30°C, measured as absorbance at 600 nm (OD600). (g) Motility of V. proteolyticus used in (a–d). Swimming motility of V. proteolyticus strains, measured as migration on a soft-agar plate after overnight incubation at 30°C. Statistical comparisons in (a–b) and (g) were performed using RM one-way ANOVA, followed by Dunnett’s multiple comparison test. The results are shown as the mean ± SD of three independent experiments; a significant difference was considered as p<0.05. The results in (c–h) are of a representative experiment out of n≥2 independent experiments with similar results.
Figure 8.
Figure 8.. T6SS3-like systems are found in pathogenic marine bacteria.
T6SS3-like gene clusters. Genes are represented by arrows indicating the direction of transcription. Locus tags are denoted above; encoded proteins and known domains are denoted below for V. proteolyticus. A dashed line denotes a gap containing genes that are not shown.

Similar articles

Cited by

References

    1. Altschul SF, Gish W, Miller W, Myers EW, Lipman DJ. Basic local alignment search tool. Journal of Molecular Biology. 1990;215:403–410. doi: 10.1016/S0022-2836(05)80360-2. - DOI - PubMed
    1. Aubert DF, Xu H, Yang J, Shi X, Gao W, Li L, Bisaro F, Chen S, Valvano MA, Shao F. A Burkholderia type VI effector deamidates Rho GTPases to activate the pyrin inflammasome and trigger inflammation. Cell Host & Microbe. 2016;19:664–674. doi: 10.1016/j.chom.2016.04.004. - DOI - PubMed
    1. Baker-Austin C, Oliver JD, Alam M, Ali A, Waldor MK, Qadri F, Martinez-Urtaza J. Vibrio spp: infections. Nature Reviews. Disease Primers. 2018;4:8. doi: 10.1038/s41572-018-0005-8. - DOI - PubMed
    1. Bauernfried S, Scherr MJ, Pichlmair A, Duderstadt KE, Hornung V. Human NLRP1 is a sensor for double-stranded RNA. Science. 2021;371:eabd0811. doi: 10.1126/science.abd0811. - DOI - PubMed
    1. Bensadoun A, Weinstein D. Assay of proteins in the presence of interfering materials. Analytical Biochemistry. 1976;70:241–250. doi: 10.1016/s0003-2697(76)80064-4. - DOI - PubMed

Publication types

MeSH terms

Substances