. 2022 Sep 26;18(9):e1010867.
doi: 10.1371/journal.ppat.1010867. eCollection 2022 Sep.

Mouse models of COVID-19 recapitulate inflammatory pathways rather than gene expression

Affiliations

Mouse models of COVID-19 recapitulate inflammatory pathways rather than gene expression

Cameron R Bishop et al. PLoS Pathog. .

Abstract

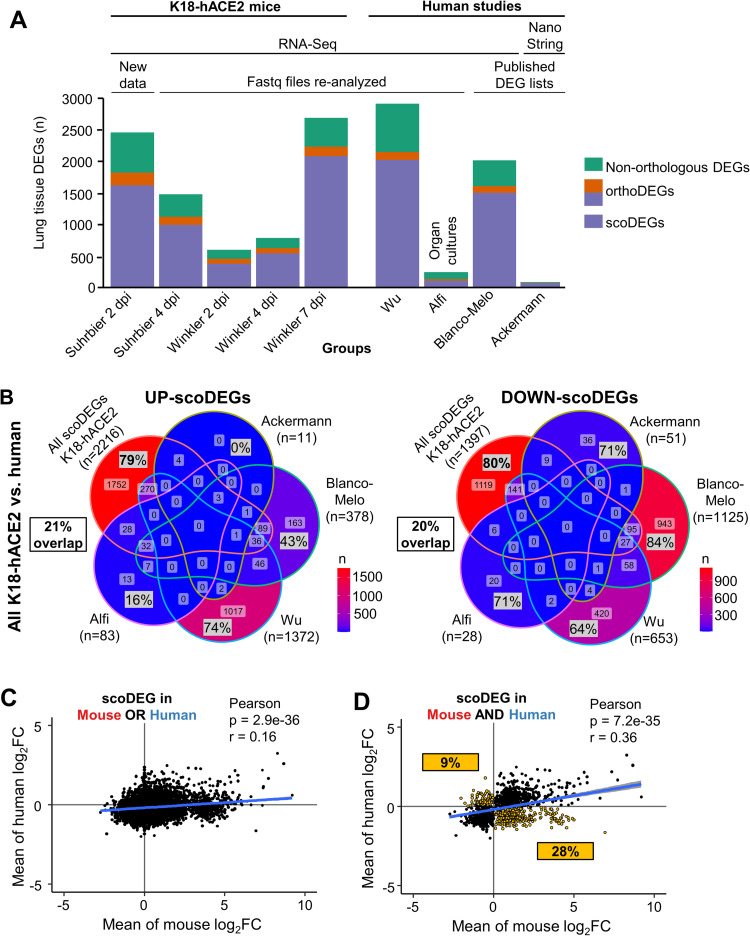
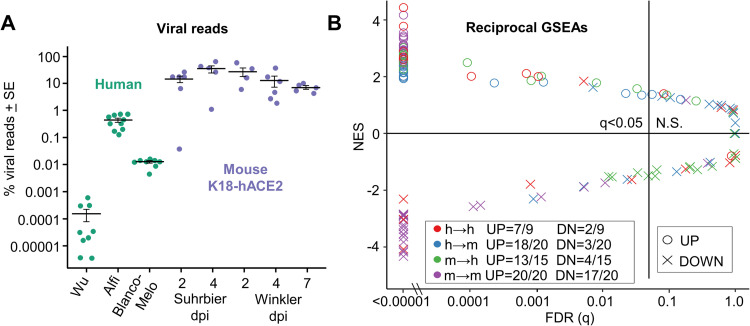
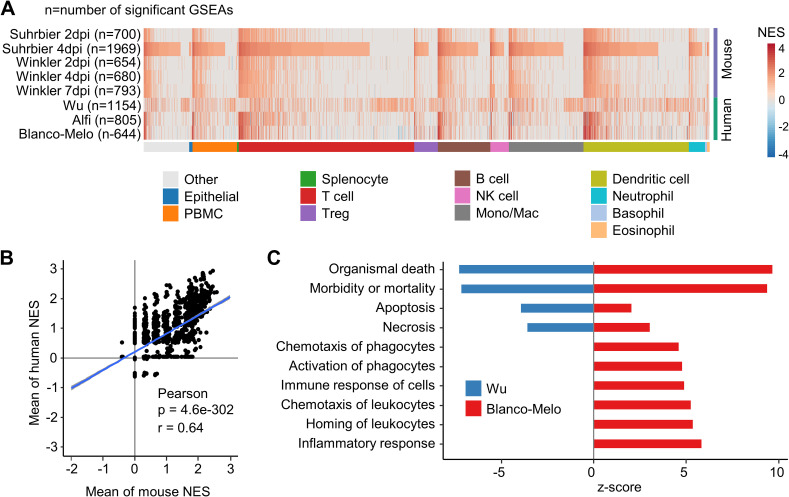
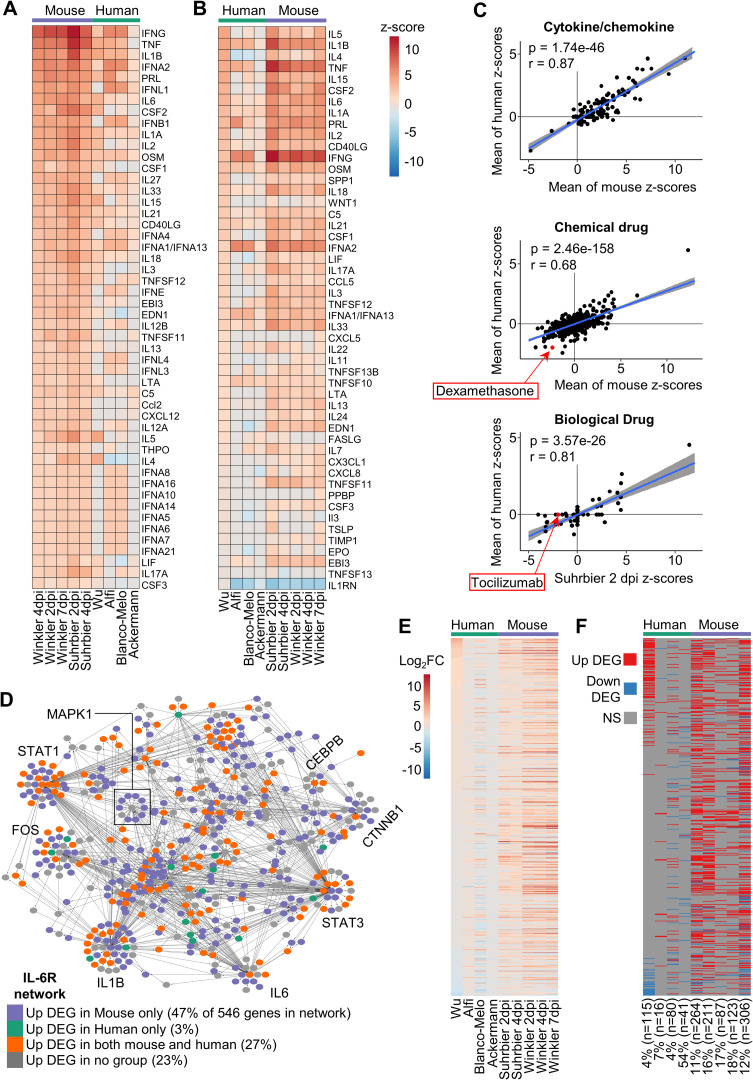
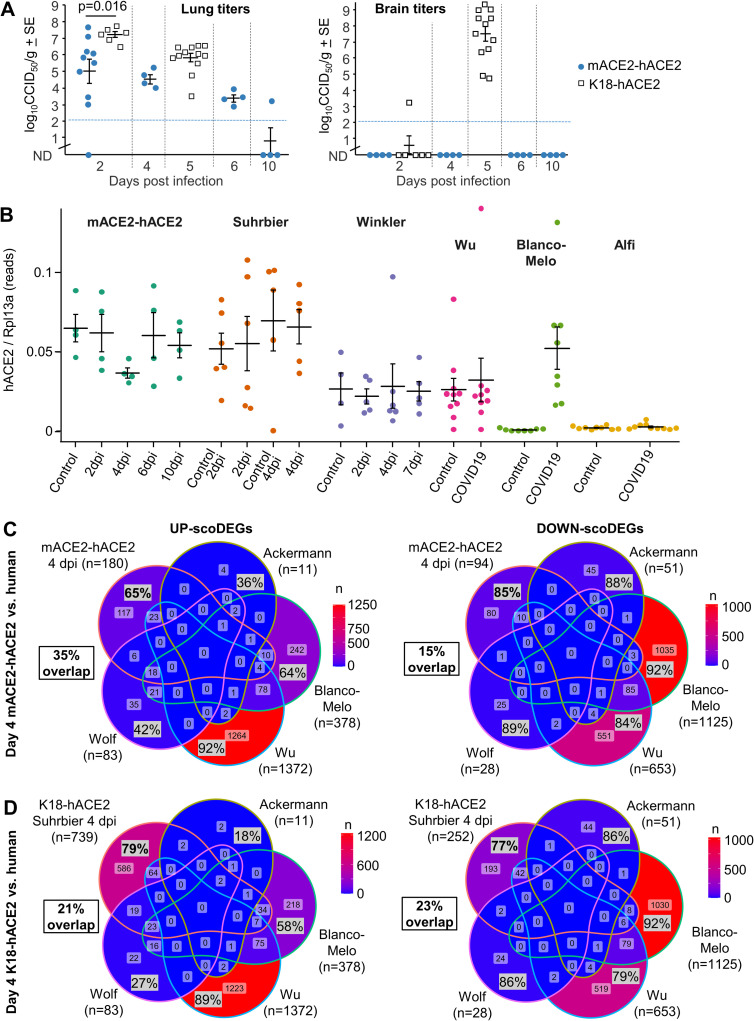
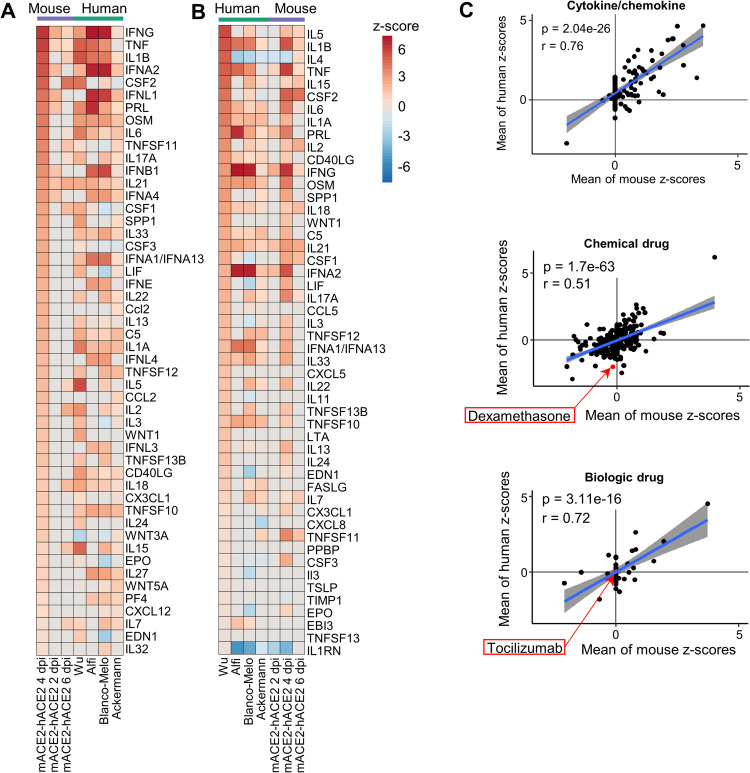
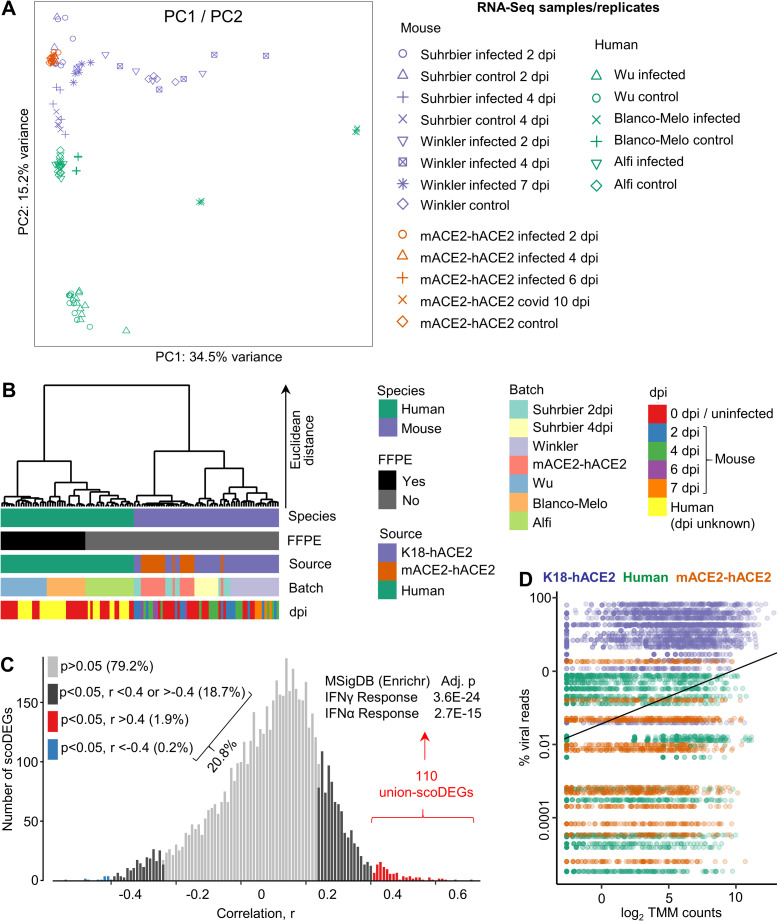
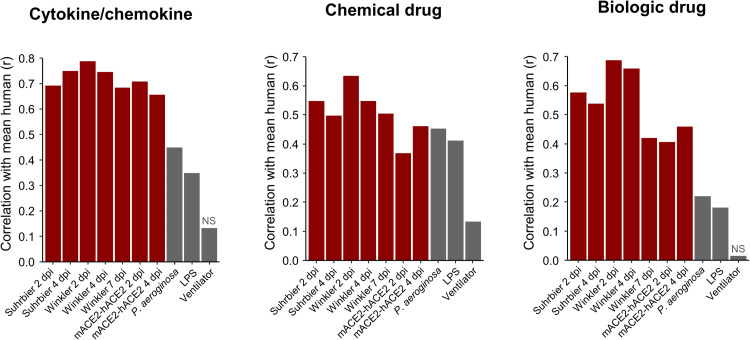
How well mouse models recapitulate the transcriptional profiles seen in humans remains debatable, with both conservation and diversity identified in various settings. Herein we use RNA-Seq data and bioinformatics approaches to analyze the transcriptional responses in SARS-CoV-2 infected lungs, comparing 4 human studies with the widely used K18-hACE2 mouse model, a model where hACE2 is expressed from the mouse ACE2 promoter, and a model that uses a mouse adapted virus and wild-type mice. Overlap of single copy orthologue differentially expressed genes (scoDEGs) between human and mouse studies was generally poor (≈15-35%). Rather than being associated with batch, sample treatment, viral load, lung damage or mouse model, the poor overlaps were primarily due to scoDEG expression differences between species. Importantly, analyses of immune signatures and inflammatory pathways illustrated highly significant concordances between species. As immunity and immunopathology are the focus of most studies, these mouse models can thus be viewed as representative and relevant models of COVID-19.


Conflict of interest statement

The authors have declared that no competing interests exist.

Figures

Fig 1
Fig 1. Mouse and human DEGs; overlaps and concordances between species.
(A) DEGs from lungs/lung tissues infected with SARS-CoV-2 were identified in K18-hACE2 mouse and human studies (n = number of DEGs). DEGs were generated from original RNA-Seq data provided herein (New Data), re-analyzed from previously published RNA-Seq data (Fastq files re-analyzed), or were obtained from publications (published DEG lists). All datasets were derived from RNA-Seq, except Ackerman which was obtained from a Nanostring study. Coloring of bars: Green—non-orthologous between mouse and human; Orange—with one or both species having multiple orthologues; Purple—both species having a single copy orthologue. A total of 9 Groups (5 K18-hACE2 and 4 human) were considered in the subsequent analyses. (B) The union of all K18-hACE2 scoDEGs was used to compare mouse and human for up- and down-regulated scoDEGs. ‘n’ refers to the number of scoDEGs for each group. Percentages within the Venn diagram (gray boxes) show the percentage of scoDEGs exclusive to that group (i.e. a scoDEG in that group but no other group. E.g. 1752/2216 x 100 = 79%). The boxed overlap percentages represent the percentage of mouse scoDEGs that are also scoDEGs in one or more human studies (e.g. 2216-1752/2216 x 100 ≈ 21% for up-regulated scoDEGS and 1119-1397/1397 x100 ≈20% for down-regulated scoDEGs). (C) Pearson correlation of mean log2FCs of single-copy orthologues that were DEGs in either any mouse group or any human group or both. (D) Pearson correlation of mean log2FCs of single-copy orthologues that were DEGs in both one or more mouse groups and one or more human groups. scoDEGs that had inconsistent mean expression between species (i.e. were upregulated in one species and down-regulated in another) are shown yellow. The percentage of scoDEGs with inconsistent expression (yellow boxes) is provided relative to the total number of scoDEGs.
Fig 2
Fig 2. Viral reads and reciprocal GSEAs.
(A) For each sample, the number of reads aligned to the SARS-CoV-2 genome are shown as a percentage of the total number of reads that align to all protein coding genes (filled circles). Cross-bars represent the mean for each group. (B) Pairwise reciprocal GSEAs showing enrichment of up- or down-regulated orthoDEG sets in log2FC ranked gene lists for all possible pair-wise comparisons between groups (i.e. 128 combinations; 3 human and 5 mouse ranked gene lists vs. 4 human and 5 mouse orthoDEG lists). Circles and crosses are colored according to direction of the GSEA (e.g. green = mouse orthoDEG sets vs. ranked human gene lists). Fractions show the proportion of orthoDEG sets that are significantly enriched with consistent directionality (e.g. “UP = 13/15” indicates that, of 15 GSEAs using up-regulated orthoDEG sets, 13 showed significant enrichment with positive NES).
Fig 3
Fig 3. Gene Set Enrichment Analysis using immune-cell gene sets.
(A) Gene sets from the GSEA Immune Signatures Database (ImmuneSigDB) were used to interrogate log2FC ranked gene lists from all groups. A total of 2879 GSEAs were significantly enriched in at least one group, and were clustered according to the cell-type mentioned in the annotation for the gene set. Within each cell-type cluster, gene sets were ranked according NES for Suhrbier 4 dpi. (B) Pearson’s correlation of mean mouse NES for 2879 ImmuneSigDB gene sets vs. the mean human NES for the same gene sets. (C) The full DEG lists for Wu and Blanco-Melo were analyzed by IPA Diseases and Functions. The top 10 annotations that had the greatest differences in z-scores between Wu and Blanco-Melo are shown, ranked by difference. A z-score of 0 means the annotation was not identified as significant by IPA.
Fig 4
Fig 4. Cytokine/chemokine and drug IPA USR concordances between human and K18-hACE2 mice.
(A) DEGs from each group were analyzed by the upstream regulator (USR) feature of IPA. The heatmap shows the top 50 of cytokine/chemokine USRs ranked by activation z-scores from the Winkler 4 dpi data. (B) Heatmap comparing groups as in A, except ranked according to z-score from the Wu data. (C) Cytokine/chemokine–Pearson correlation of mean mouse z-scores vs. mean human z-scores for significant Cytokine/chemokine USRs (n = 146). Chemical drugs–Pearson correlation of mean mouse z-scores vs. mean human z-scores for significant Chemical drug USRs (n = 1156). Biologic drugs—Pearson correlation of mean mouse z-scores vs. mean human z-scores for significant chemical drug USRs (n = 109). For calculating means, non-significant USRs were given a value of zero, thus means were derived from n = 5 for mouse groups and n = 4 for human groups. (D) Network of 546 genes associated with IL-6R signaling according to IPA. Node color indicates whether a gene was up-regulated only in mouse (purple; ≥1 mouse group, and no human group), only in human (green; ≥1 human group, and no mouse group), both (orange; ≥1 mouse and ≥1 human group), or not up-regulated in any group (grey). Large sub-networks are labeled according to their hub node. (E) Heatmap comparing groups according to log2 fold-change (log2FC) of 546 genes associated with the IL-6R signaling network. Genes are ranked according to log2FC in Wu. (F) Categorical “heatmap” with groups (x axis) and genes (y axis) as in E, with up-regulated DEGs shown in red, down-regulated DEGs in blue, and genes whose expression was not significantly different (NS) in grey. The percentage and number of DEGs in each group that are present in the IL-6R network is indicated; e.g. The Wu data set has 2875 DEGs, of which 4% (115) are present in the IL6R network.
Fig 5
Fig 5. Genetic background of K18-hACE2 mice affects disease progression.
(A) For each sample of the Suhrbier and Winkler datasets, the number of read pairs aligning to exon 9 and exon 2 of the Nnt gene are shown as green and purple bars, respectively. Nnt exon 9 is deleted in C57BL/6J mice. (B) Change in body weight over five days following SARS-CoV-2 infection is shown as a percentage of starting body weight for K18-hACE2 6J (Nnt-/-) and K18-hACE2 6J/6N (Nnt -/+) mice; p-values indicate significant difference between means at 3 and 4 dpi (Mann Whitney U tests, n = 5 per group). (C) Three disease score parameters (activity, posture and fur ruffling) over six days following SARS-CoV-2 infection are shown for K18-hACE2 6J and K18-hACE2 6J/6N mice. Statistics for 5 dpi for all 3 parameters by Kolmogorov-Smirnov tests (n = 5 per group). (D) Kaplan-Meier curves showing survival for K18-hACE2 6J and K18-hACE2 6J/6N mice following SARS-CoV-2 infection. Significance by log rank test (n = 5 per group). (E) Log10CCID50/g in brain, lung and nasal turbinate for K18-hACE2 6J and K18-hACE2 6J/6N mice 5 dpi with SARS-CoV-2. 6J data was derived from 2 independent experiments. Differences between K18-hACE2 6J and K18-hACE2 6J/6N mice for any tissue were not significance.
Fig 6
Fig 6
The mACE2-hACE2 mouse model (A) Lung and brain viral tissue titers at the indicated days post infection. All infected K18-hACE2 mice reach ethically defined endpoints for euthanasia (weight loss ≥20%) by day 5. None of the mACE-hACE2 mice reach ethically defined endpoints for euthanasia. Mean lung titers on day 2 were 2.2 log10CCID50 lower in mACE2-hACE2 mice compared to (Suhrbier) K18-hACE2 mice (p = 0.016, Kolmogorov-Smirnov test). (B) hACE2 reads normalized to Rpl13a reads for all mACE2-hACE2, K18-hACE2 and human lung samples. Cross-bars represent group means ± standard error. (C) Venn-diagrams show overlap in up- and down-regulated scoDEGs between mACE2-hACE2 4 dpi mice and the four human groups. Percentages within the Venn diagram (grey boxes) show the percentage of scoDEGs exclusive to that group (i.e. a scoDEG in that group, but in no other group). The boxed overlap percentages represent the percentage of 4 dpi mouse scoDEGs that are also scoDEGs in one or more human studies (e.g. 180-117/180 x 100 ≈ 35% for up-regulated scoDEGS and 94-80/94 x100 ≈15% for down-regulated scoDEGs). (D) As for C showing overlaps in up- and down-regulated scoDEGs between K18-hACE2 Suhrbier 4 dpi and the four human groups. Percentages as in C.
Fig 7
Fig 7. Cytokine/chemokine and drug USR concordances between mACE2-hACE2 mice and humans.
(A) Heatmap comparing mACE2-hACE2 mouse groups with human groups for IPA cytokine/chemokine USRs ranked by activation z-score in mACE2-hACE2 4 dpi. (B) Heatmap comparing groups as in A, except ranked according to z-score in Wu, as a representative of human groups. (C) Pearson correlation of mean mouse vs. mean human z-scores for significantly enriched cytokine/chemokine USRs (n = 136), chemical drug USRs (n = 959) and biologic drug USRs (n = 94). Blue line shows linear regression with 95% confidence intervals (grey).
Fig 8
Fig 8. Principal component, hierarchical cluster and viral load analyses.
(A) Scatter plots showing principal component 1 (PC1) vs. PC2 derived from 14,918 single-copy orthologues from all samples/accessions. Read counts were TMM-normalized and log2-transformed. Expression values were calculated by subtracting each TMM-log2 count from the row mean of all samples for each gene (i.e. deviation from row mean). (B) Hierarchical cluster analysis using the top 500 orthologues according to PC1 and PC2 loadings as in A. Clustering distance was Euclidean, and clustering method was Ward’s linkage. FFPE = Formalin-fixed, paraffin-embedded. (C) For all union-scoDEGs (a sco-DEG in at least 1 sample, n = 5880), across all samples/accessions (n = 69), Pearson correlations were undertaken comparing gene expression (log2 TMM normalized read count for each scoDEG) with percent viral reads (viral read count as a percentage of all read counts for host protein coding genes). Significance (p) and correlation (r) were generated for all scoDEGs. A histogram showing distribution of r values is shown, with colors indicating p and r cutoffs. The 110 genes that correlated well (red) were analyzed using the Molecular Signatures Data Base (MSigDB) available online via Enrichr, with the top 2 annotations shown. (D) The percent viral reads for the 69 samples/accessions are shown on the y axis, and were plotted against expression (log2 TMM counts) of the 110 genes in C. As expected, as correlating union-scoDEGs were selected from D (red), a significant correlation emerged when all 110 union-scoDEGs are taken together; linear regression (black line), p = 2.02 x 10E-149, r = 0.29.
Fig 9
Fig 9. Cytokine, chemical and biologic drug pathways from acute lung injury models correlate poorly with those from SARS-CoV-2 infected lungs.
Three acute lung injury (ALI) mouse model data sets were obtained from the SRA. Reads were mapped to the GRCm38 reference genome, counted, normalized, and analyzed with IPA in the same manner as for SARS-CoV-2 mouse and human groups. Z-scores for IPA USRs for Cytokine/chemokine (n = 127), Chemical drug (n = 794), and Biologic drug (n = 79) from each mouse group and the 3 ALI models were tested for their linear relationship with the mean USR z-scores of all human groups by Pearson’s correlation tests. ‘NS’ indicates non-significant correlations (p > 0.05).

Similar articles

Cited by

References

    1. Yue F, Cheng Y, Breschi A, Vierstra J, Wu W, Ryba T, et al. A comparative encyclopedia of DNA elements in the mouse genome. Nature. 2014;515(7527):355–64. doi: 10.1038/nature13992 . - DOI - PMC - PubMed
    1. Gilad Y, Mizrahi-Man O. A reanalysis of mouse ENCODE comparative gene expression data. F1000research. 2015;4:121. doi: 10.12688/f1000research.6536.1 . - DOI - PMC - PubMed
    1. Lin S, Lin Y, Nery JR, Urich MA, Breschi A, Davis CA, et al. Comparison of the transcriptional landscapes between human and mouse tissues. Proc Natl Acad Sci U S A. 2014;111(48):17224–9. doi: 10.1073/pnas.1413624111 . - DOI - PMC - PubMed
    1. Takao K, Miyakawa T. Genomic responses in mouse models greatly mimic human inflammatory diseases. Proc Natl Acad Sci U S A. 2015;112(4):1167–72. doi: 10.1073/pnas.1401965111 . - DOI - PMC - PubMed
    1. Seok J, Warren HS, Cuenca AG, Mindrinos MN, Baker HV, Xu W, et al. Genomic responses in mouse models poorly mimic human inflammatory diseases. Proc Natl Acad Sci U S A. 2013;110(9):3507–12. doi: 10.1073/pnas.1222878110 . - DOI - PMC - PubMed

Publication types

Substances