. 2022 Oct 23;163(12):bqac158.
doi: 10.1210/endocr/bqac158.

Foxe1 Deletion in the Adult Mouse Is Associated With Increased Thyroidal Mast Cells and Hypothyroidism

Affiliations

Foxe1 Deletion in the Adult Mouse Is Associated With Increased Thyroidal Mast Cells and Hypothyroidism

Grace Lim et al. Endocrinology. .

Abstract

Context: Foxe1 is a key thyroid developmental transcription factor. Germline deletion results in athyreosis and congenital hypothyroidism. Some data suggest an ongoing role for maintaining thyroid differentiation.

Objective: We created a mouse model to directly examine the role of Foxe1 in the adult thyroid.

Methods: A model of tamoxifen-inducible Cre-mediated ubiquitous deletion of Foxe1 was generated in mice of C57BL/6J background (Foxe1flox/flox/Cre-TAM). Tamoxifen or vehicle was administered to Foxe1flox/flox/Cre mice aged 6-8 weeks. Blood was collected at 4, 12, and 20 weeks, and tissues after 12 or 20 weeks for molecular and histological analyses. Plasma total thyroxine (T4), triiodothyronine, and thyrotropin (TSH) were measured. Transcriptomics was performed using microarray or RNA-seq and validated by reverse transcription quantitative polymerase chain reaction.

Results: Foxe1 was decreased by approximately 80% in Foxe1flox/flox/Cre-TAM mice and confirmed by immunohistochemistry. Foxe1 deletion was associated with abnormal follicular architecture and smaller follicle size at 12 and 20 weeks. Plasma TSH was elevated in Foxe1flox/flox/Cre-TAM mice as early as 4 weeks and T4 was lower in pooled samples from 12 and 20 weeks. Foxe1 deletion was also associated with an increase in thyroidal mast cells. Transcriptomic analyses found decreased Tpo and Tg and upregulated mast cell markers Mcpt4 and Ctsg in Foxe1flox/flox/Cre-TAM mice.

Conclusion: Foxe1 deletion in adult mice was associated with disruption in thyroid follicular architecture accompanied by biochemical hypothyroidism, confirming its role in maintenance of thyroid differentiation. An unanticipated finding was an increase in thyroidal mast cells. These data suggest a possible explanation for previous human genetic studies associating alleles in/near FOXE1 with hypothyroidism and/or autoimmune thyroiditis.

Keywords: FOXE1; autoimmune thyroiditis; hypothyroidism; mast cells.


Figures

Figure 1.
Figure 1.
Weight measurements of male vs female mice during a 20-week observation period following treatment. Scatter plots showing individual weights of VEH or TAM treated 6- to 8-week-old Foxe1flox/flox/Cre (Foxe1) and Cre mice overlaid over box plots representing the median and quartile values of each group (6-12 animals per group). Significant differences (P < .05) in weight between groups was determined by 2-way ANOVA with Tukey's multiple comparison test. The weights of all animals were recorded weekly, but for the purpose of clarity only the values recorded every fourth week are shown.
Figure 2.
Figure 2.
Loss of thyroidal Foxe1 protein following Foxe1 deletion. (A) Scatter plots showing log2 fold-changes in Foxe1 expression in thyroid glands of vehicle (VEH) or tamoxifen (TAM)-treated 6- to 8-week-old Foxe1flox/flox/Cre (Foxe1) or Cre mice harvested at 12 and 20 weeks post-treatment. Normalized Foxe1 expression levels of Cre-VEH (n = 3 F, 5 M), Cre-TAM (n = 5 F, 4 M), Foxe1-VEH (n = 4 F, 3M), and Foxe1-TAM (n = 3 F, 4 M) thyroid glands at 12 weeks, and Cre-VEH (n = 4 F, 5 M), Cre-TAM (n = 4 F, 5 M), Foxe1-VEH (n = 1 F, 1 M), and Foxe1-TAM (n = 5 F, 3 M) thyroid glands at 20 weeks are shown expressed as log2 fold changes relative to the median expression of the 12-week Cre-VEH control group. Box plots representing the median and quartile values of each group. Significant differences calculated by unpaired 2-samples Wilcoxon test with Benjamini–Hochberg adjustment are shown. Females and males are distinguished by a black and red border, respectively. Four-micrometer FFPE sections of thyroid tissue from (B) Cre-VEH, (C) Cre-TAM, (D) Foxe1-VEH, and (E) Foxe1-TAM female mice at 20 weeks were stained with anti-Foxe1 antibody (scale bar = 500 μM). (F) Foxe1 immunoblotting with 1 μg of reverse-crosslinked protein extracted from FFPE samples from the 20-week treatment groups. To obtain sufficient protein 6 specimens (n = 3 F, 3 M) were pooled together per group, and equal protein loading confirmed by Gapdh.
Figure 3.
Figure 3.
Thyroid morphology changes following Foxe1 deletion. (A) Hematoxylin and eosin staining of 4 µm FFPE sections from vehicle (VEH) or tamoxifen (TAM) treated 6–8-week-old female Foxe1flox/flox/Cre (Foxe1) and Cre thyroid glands harvested at 12 and 20 weeks post-treatment (scale-bar = 1000 μM). (B) Scatter plot of the log2 cross-sectional areas of 100 thyroid follicles per animal per group (n = 3F, 2M) at 12 and 20 weeks. Bars indicates the mean of each group and significant differences were calculated by unpaired 2-samples t-test with Benjamini–Hochberg adjustment.
Figure 4.
Figure 4.
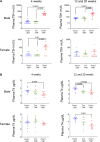
Loss of Foxe1 in adult thyroid is associated with biochemical hypothyroidism. Vehicle (VEH) was tamoxifen (TAM) was administered to 6- to 8-week-old Foxe1flox/flox/Cre (Foxe1) or Cre mice, once daily for 5 consecutive days. Following the final treatment animals were observed up to 20 weeks, and plasma was collected on a fortnightly basis for measurement of thyroid hormone levels. Sufficient samples were obtained to be able to compare (A) TSH and (B) T4 concentrations in plasma collected from male and female Cre-TAM, Foxe1-VEH and Foxe1-TAM mice at 4 weeks and 12 and 20 weeks (the 12- and 20-week groups were combined due to the small number of samples per group) post-treatment. Significant differences were determined by 1-way ANOVA with Tukey's multiple comparison test.
Figure 5.
Figure 5.
Mast cell number increases in the thyroid following Foxe1 deletion. Tryptase staining of mast cells was performed on 4 µm FFPE sections from vehicle (VEH) or tamoxifen (TAM) treated 6- to 8-week-old Foxe1flox/flox/Cre (Foxe1) and Cre thyroid glands harvested at 12 and 20 weeks post-treatment. Representative staining is shown for thyroid glands from (A) Cre-TAM and (B) Foxe1-TAM female mice at 20 weeks post-treatment (Scale bar = 1000 μM). (C) Scatter plots of positive cell counts per thyroid cross-section are overlaid over box plots representing the median and quartile values of Cre-VEH (n = 3F, 3M), Cre-TAM (n = 5F, 5M), Foxe1-VEH (n = 5F, 5M), and Foxe1-TAM (n = 4F, 3M), at 12 weeks; and Cre-VEH (n = 4F, 3M), Cre-TAM (n = 4F, 4M), Foxe1-VEH (n = 5F, 5M), and Foxe1-TAM (n = 3F, 3M), at 20 weeks. Significant differences calculated by unpaired 2-samples Wilcoxon test with Benjamini–Hochberg adjustment are shown.
Figure 6.
Figure 6.
Mast cells in the Foxe1-TAM thyroid glands appear as immature progenitor cells. Alcian blue–safranin O staining of immature (blue) and mature (orange) mast cells was performed on 4 µm FFPE sections from vehicle (VEH) or tamoxifen (TAM) treated 6- to 8-week-old Foxe1flox/flox/Cre (Foxe1) and Cre thyroid glands harvested at 12 and 20 weeks post-treatment. Representative staining is shown for (A) Cre-TAM (F) and (B-C) Foxe1-TAM (M) thyroid glands at 20 weeks post-treatment (low and high magnification scale bars = 1000 μM and 500 μM, respectively). (D) Scatter plot of immature and mature cell counts per thyroid cross-section are overlaid over box plots representing the median and quartile values of Cre-TAM (n = 1F, 1M), Foxe1-VEH (n = 2F, 1M), and Foxe1-TAM (n = 2F, 1M), at 12 weeks; and Cre-TAM (n = 1F, 1M), Foxe1-VEH (n = 1F, 1M), and Foxe1-TAM (n = 2F, 1M), at 20 weeks. Significant differences calculated by unpaired 2-samples Wilcoxon test with Benjamini–Hochberg adjustment are shown.
Figure 7.
Figure 7.
Gene expression changes in the thyroid following Foxe1 deletion. Transcriptomic analyses were performed on thyroid glands from tamoxifen (TAM) treated 6- to 8-week-old Foxe1flox/flox/Cre (Foxe1) and Cre mice, harvested at 2 and 20 weeks post-treatment. (A, B) Separation of treatment groups by unsupervised PCA. Percentages represent variance captured by principal components 1 and 2 in each analysis. The sex of each animal is indicated in parentheses. (C, D) Volcano plots showing genes considered differentially expressed (colored in blue) between Foxe1-TAM (n = 2F, 1M) and Cre-TAM (n = 1F, 2M), at 2 and 20 weeks post-treatment, with a fold-change >1.5 (log2FC >0.585, vertical dashed line) and Q < .05 (horizontal dashed line). Genes of interest are highlighted. (E) Scatter plots showing expression of thyrocyte (Tg, Tpo and Nis) and mast cell (Kitl, Mcpt4, Ctsg, and C3) differentiation genes, and the cytokine-encoding Ecrg4 gene, in Foxe1-TAM (n = 4F, 5M) vs Cre-TAM (n = 5F, 4M) thyroid glands at 20 weeks, each expressed as log2 fold change relative to their median expression across all groups (dotted line). Females and males are distinguished by a black and red border, respectively. Significant differences calculated by unpaired 2-samples t-test with Benjamini–Hochberg adjustment are shown.
Figure 8.
Figure 8.
Gene set enrichment analysis of the 2-week gene set with biological process GO terms. All genes detected by microarray were ranked by log2 fold change and queried with gene sets from the GO biological process sub-ontology, using the “gseGO” function in the R package “clusterProfiler”. The ridge plot shows top terms significantly associated (Q < .05) with the microarray gene set, with ridge shape representing the log2 fold change distribution of genes enriched within each set. The hormone metabolic process and mast cell degranulation gene sets are highlighted.

References

    1. Fernandez LP, Lopez-Marquez A, Santisteban P. Thyroid transcription factors in development, differentiation and disease. Nat Rev Endocrinol. 2015;11(1):29–42. - PubMed
    1. Hannenhalli S, Kaestner KH. The evolution of Fox genes and their role in development and disease. Nat Rev Genet. 2009;10(4):233–240. - PMC - PubMed
    1. Eichberger T, Regl G, Ikram MS, et al. . Foxe1, a new transcriptional target of GLI2 is expressed in human epidermis and basal cell carcinoma. J Invest Dermatol. 2004;122(5):1180–1187. - PubMed
    1. Sequeira M, Al-Khafaji F, Park S, et al. . Production and application of polyclonal antibody to human thyroid transcription factor 2 reveals thyroid transcription factor 2 protein expression in adult thyroid and hair follicles and prepubertal testis. Thyroid. 2003;13(10):927–932. - PubMed
    1. Clifton-Bligh RJ, Wentworth JM, Heinz P, et al. . Mutation of the gene encoding human TTF-2 associated with thyroid agenesis, cleft palate and choanal atresia. Nat Genet. 1998;19(4):399–401. - PubMed

Publication types