. 2022 Nov;600(22):4897-4916.
doi: 10.1113/JP283605. Epub 2022 Oct 13.

Properties and modulation of excitatory inputs to the locus coeruleus

Affiliations

Properties and modulation of excitatory inputs to the locus coeruleus

Kelsey Barcomb et al. J Physiol. 2022 Nov.

Abstract

Excitatory inputs drive burst firing of locus coeruleus (LC) noradrenaline (NA) neurons in response to a variety of stimuli. Though a small number of glutamatergic LC afferents have been investigated, the overall landscape of these excitatory inputs is largely unknown. The current study used an optogenetic approach to isolate three glutamatergic afferents: the prefrontal cortex (PFC), lateral hypothalamus (LH) and periaqueductal grey (PAG). AAV5-DIO-ChR2 was injected into each region in male and female CaMKII-Cre mice and the properties of excitatory inputs on LC-NA cells were measured. Notably we found differences among these inputs. First, the pattern of axonal innervation differed between inputs such that LH afferents were concentrated in the posterior portion of the LC-NA somatic region while PFC afferents were denser in the medial dendritic region. Second, basal intrinsic properties varied for afferents, with LH inputs having the highest connectivity and the largest amplitude excitatory postsynaptic currents while PAG inputs had the lowest initial release probability. Third, while orexin and oxytocin had minimal effects on any input, dynorphin strongly inhibited excitatory inputs originating from the LH and PAG, and corticotrophin releasing factor (CRF) selectively inhibited inputs from the PAG. Overall, these results demonstrate that individual afferents to the LC have differing properties, which may contribute to the modularity of the LC and its ability to mediate various behavioural outcomes. KEY POINTS: Excitatory inputs to the locus coeruleus (LC) are important for driving noradrenaline neuron activity and downstream behaviours in response to salient stimuli, but little is known about the functional properties of different glutamate inputs that innervate these neurons We used a virus-mediated optogenetic approach to compare glutamate afferents from the prefrontal cortex (PFC), the lateral hypothalamus (LH) and the periaqueductal grey (PAG). While PFC was predicted to make synaptic inputs, we found that the LH and PAG also drove robust excitatory events in LC noradrenaline neurons. The strength, kinetics, and short-term plasticity of each input differed as did the extent of neuromodulation by both dynorphin and corticotrophin releasing factor. Thus each input displayed a unique set of basal properties and modulation by peptides. This characterization is an important step in deciphering the heterogeneity of the LC.

Keywords: circuit; glutamate; neuromodulation; stress; synaptic.


Figures

Figure 1
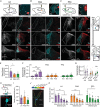
Figure 1. Differential targeting of glutamtergic inputs from the LH, PAG, and PFC to LC neurons
A–C, schematic representations of viral expression. AAV5‐DIO‐ChR2‐eYFP/mCherry was injected into target sites in CaMKII‐Cre+/− mice. Representative images of injection sites are shown for each region. Targeted regions consisted of lateral hypothalamus (LH) (A), lateral periaqueductal grey (PAG) (B), and medial prefrontal cortex (PFC) (C). Aq, aqueduct; cP, caudate putamen; M1/M2, motor cortices; MO, motor orbital cortex; PrL, prelimbic cortex. D, representative images of terminal fields of LH (left), PAG (centre) and PFC (right) afferents within the LC at anterior (‘ant’; top), mid‐anteroposterior (middle row) and posterior (‘post’; bottom) sections. Grey/red channels show mCh corresponding to viral expression, green channel shows immunostain for TH. 4V, fourth ventricle. E, quantification of the signal density for mCh‐expressing terminals at the locus coeruleus. The LH afferents (0.40 ± 0.21 +px/px, N = 9) had a higher density than those from the PAG (0.20 ± 0.08 +px/px, N = 7); PFC afferents did not significantly differ (0.23 ± 0.07 +px/px, N = 7) (one‐way ANOVA, F(2, 20) = 4.31, P = 0.0277, post hoc Tukey's test). N is no. of injected hemispheres. F, quantification of the signal density for mCh expressing terminals at 3 anteroposterior (A/P) levels. The density of LH afferents was lowest at the anterior and highest end of the LC (one‐way ANOVA, F(2, 22) = 31.77, P < 0.0001, post hoc Tukey's test); PAG afferents and PFC afferents did not display a significant pattern along the A/P axis. n = images analysed. G, quantification of the signal density for mCherry+ terminals between the somatic region (TH+ cell bodies) and the dendritic region (medially extending TH+ signal). For PFC inputs (n/N = 24/5), the dendritic region had a greater signal density than the somal (paired t test, t = 6.84, P < 0.0001). n/N = images analysed/mice. H, CaMKII‐Cre+/− mice were injected with AAV‐DIO‐mGFP‐2A‐SyPhy‐mRuby into LH, PAG or PFC. Representative image (from LH‐injected animal) shows overlap between mRuby+ synaptophysin puncta with a biocytin‐filled LC‐NA cell, labelled with Alexa‐647 conjugated streptavidin. I, quantification of puncta density, measured by number of puncta per 100 μm2 cell surface area. No difference was found between LH (n/N = 10/3), PAG (n/N = 8/5) or PFC (n/N = 9/4) terminals (one‐way ANOVA, F(2, 23) = 2.42, P = 0.11). J, 3D reconstruction of a cell fill, displaying distance bins used for analysis; overlapping puncta shown in white. Puncta within the somal region (blue) were compared to those in the dendritic region, which was binned in 100 μm increments. K, quantification of puncta area within each distance bin. mRuby+ terminals were more concentrated in the soma than the dendrites past 100 μm from the edge of the soma for afferents from LH (left; RMANOVA, F(2.82, 25.35) = 37.32, P < 0.0001; post hoc Dunnett's test comparing each bin to soma) and PAG (centre; RMANOVA, F(2.79, 19.51) = 32.87, P < 0.0001; post hoc Dunnett's test comparing each bin to soma). Distance from soma was also a significant factor in the distribution of puncta for PFC afferents, though only for a more distal section of the LC dendrites at 300 μm from the edge of the soma (right; RMANOVA, F(2.64, 21.15) = 3.23, P = 0.0480). n, no. of filled LC cells. Summary data are means ± SD. *P < 0.05, **P < 0.01, ***P < 0.001. [Colour figure can be viewed at wileyonlinelibrary.com]
Figure 2
Figure 2. Synaptic properties of glutamatergic afferents from LH, PAG and PFC to LC‐NA neurons differ
A, representative image of recorded LC‐NA neurons filled with biocytin (left) and immunostained for TH (centre); merged channels shown on right. B, percentage connectivity of LH, PAG and PFC inputs with LC‐NA cells. Number in the coloured section represents cells with significant response and in the grey section represents cells with no measurable response. At 95% response rate, LH was significantly greater than PAG (67%) and PFC (85%); χ2 = 67.80, P < 0.0001. C, representative traces in control, TTX (1 μM) and TTX+4‐AP (0.5 mm). D, quantification of EPSC amplitude in the presence of TTX and TTX + 4‐AP normalized to baseline amplitude for LH (purple), PAG (orange) and PFC (green). Paired t tests comparing normalized responses between TTX and TTX+4‐AP were significant for all afferents such that 4‐AP significantly rescued EPSCs. E, representative traces of EPSCs recorded from LC‐NA neurons with optogenetic stimulation of each afferent under control conditions and in the presence of picrotoxin (100 μM) or DNQX (10 μM). F, quantification of EPSC amplitude in the presence of picrotoxin and DNQX normalized to baseline amplitude for each afferent. G, representative traces for optically evoked EPSCs from LH (purple), PAG (orange) and PFC (green) afferents. H, quantification of EPSC amplitudes as a cumulative frequency distribution (top) and of the mean ± SEM (bottom). Kruskal–Wallis ANOVA with post hoc Dunn's test, H(2) = 88.36, P < 0.0001; ***LH vs. PAG P < 0.0001, ***LH vs. PFC P < 0.0001, *PAG vs. PFC P = 0.044. I, quantification of EPSC rise times as a cumulative frequency distribution (top) and of the mean ± SEM (bottom). Kruskal–Wallis ANOVA with post hoc Dunn's test, H(2) = 52.96, P < 0.0001; LH vs. PAG P = 0.3, ***LH vs. PFC P < 0.0001, ***PAG vs. PFC P = 0.0244. J, quantification of EPSC decay constants as a cumulative frequency distribution (top) and of the mean ± SEM (bottom). Kruskal–Wallis ANOVA with post hoc Dunn's test, H(2) = 22.54, P < 0.0001; ***LH vs. PAG P = 0.0003, ***LH vs. PFC P < 0.0001, PAG vs. PFC P > 0.99. K–M, firing rates of LC‐NA neurons following optogenetic stimulation of LH, PAG or PFC afferents (20 Hz; 1 ms pulse; 0.5 s duration; cell attached recordings). K, activation of ChR2 in LH afferents, n/N = 7/6. L, activation of ChR2 in PAG afferents, n/N = 13.3. M, activation of ChR2 in PFC afferents, n/N = 8/7. Summary data are means ± SD. *P < 0.05, ***P < 0.001. [Colour figure can be viewed at wileyonlinelibrary.com]
Figure 3
Figure 3. Glutamate release probability varies among LC‐NA inputs
A, representative traces showing paired pulse ratios (PPR) at a 50 ms interstimulus interval (ISI) for LH (left; purple), PAG (centre; orange) and PFC (right; green). B, quantification of paired pulse ratios at a 50 ms ISI (mean ± SEM). Kruskal–Wallis ANOVA with post hoc Dunn's test, H(2) = 80.11, P < 0.0001; ***LH vs. PAG P < 0.0001, LH vs. PFC P = 0.87, ***PAG vs. PFC P < 0.0001. C, scatter plots showing the relationship between PPRs and EPSC amplitudes; the size of the response did not significantly account for variability in PPR. D–F, quantification (left) and representative traces (right) for trains of 5 pulses with 50 ms ISIs. For each input a RMANOVA with post hoc Tukey's test was used to compare the ratio of pulse n to pulse1. D, LH had a significantly lower ratio for pulses 4 and 5 as compared to pulse 2 (F(4, 40) = 19.70, P < 0.0001). E, PAG facilitated at all stimulations with significant differences between them (F(4, 28) = 1.83, P = 0.15). F, PFC responses on average depressed for all pulses (F(4, 56) = 2.72, P = 0.0383). G–I, quantification (left) and representative traces (right) for PPRs of varying ISI (50–400 ms). For each input a RMANOVA with post hoc Tukey's test was used to compare PPRs. G, LH inputs depressed at all ISIs, with PPR300 < PPR50, PPR400 < PPR50, PPR100 and PPR200 (F(4, 40) = 5.93, P = 0.0008). H, PAG inputs facilitated at all ISIs except 200 ms, which was significantly less than 50 ms (F(4, 28) = 2.95, P = 0.0376). I, PFC inputs depressed for all frequencies with PPR100 > PPR300 and PPR400 (F(4, 60) = 5.60, P = 0.0007). Traces for each of the 5 ISIs are shown overlapped with their first peak normalized to 1; the shade of each trace corresponds to that in the bar graph, going from lightest to darkest with increasing ISI. Summary data are means ± SD. *P < 0.05, ***P < 0.001. [Colour figure can be viewed at wileyonlinelibrary.com]
Figure 4
Figure 4. Peptidergic modulation of isolated afferents
A, effect of CRF (100 nm) on LH, PAG and PFC inputs. Quantification of average amplitudes normalized to baseline is shown for LH (n = 15/9), PAG (n = 9/8) and PFC (n = 18/9), with representative traces of the last 5 min of baseline (black) and CRF (blue) to the right of the time course. Bottom: quantification of the average EPSC amplitude after 6 to 10 min CRF application. CRF significantly reduced EPSC amplitudes only in PAG afferents (18.58 ± 21.94% decrease, t = 3.054, P = 0.01). B, effect of orexin A (OxA; 1 μm) on LH, PAG and PFC inputs. Quantification of average amplitudes normalized to baseline is shown for LH (n = 16/9), PAG (n = 12/10) and PFC (n = 13/8), with representative traces of the last 5 min of baseline (black) and OxA (blue) to the right of the time course. Bottom: quantification of the average EPSC amplitude after 6–10 min OxA application. C, effect of oxytocin (OT, 1 μm) on LH, PAG and PFC inputs. Quantification of average amplitudes normalized to baseline is shown for LH (n = 11/8), PAG (n = 14/11) and PFC (n = 13/10), with representative traces of the last 5 min of baseline (black) and OT (blue) to the right of the time course. Bottom: quantification of the average EPSC amplitude after 6–10 min OT application. D, effect of dynorphin (Dyn, 200 nm) on LH, PAG and PFC inputs. Quantification of average amplitudes normalized to baseline is shown for LH (n = 17/10), PAG (n = 15/10), and PFC (n = 16/11), with representative traces of the last 5 min of baseline (black) and Dyn (blue) to the right of the time course. Bottom: quantification of the average EPSC amplitude after 6–10 min dynorphin application. LH and PAG amplitudes reduced significantly more than PFC (one‐way ANOVA, F(2, 44) = 15.47, P < 0.0001; post hoc Tukey's test, ***LH < PFC, ***PAG < PFC). Time course data are means ± SEM. Summary data in bar graphs are means ± SD. ††P < 0.01, **P < 0.01, ***P < 0.001. [Colour figure can be viewed at wileyonlinelibrary.com]

Similar articles

Cited by

References

    1. Abercrombie, E. D. , & Jacobs, B. L. (1988). Systemic naloxone administration potentiates locus coeruleus noradrenergic neuronal activity under stressful but not non‐stressful conditions. Brain Research, 441(1–2), 362–366. - PubMed
    1. Akaoka, H. , & Aston‐Jones, G. (1991). Opiate withdrawal‐induced hyperactivity of locus coeruleus neurons is substantially mediated by augmented excitatory amino acid input. Journal of Neuroscience, 11(12), 3830–3839. - PMC - PubMed
    1. Arnsten, A. F. , & Goldman‐Rakic, P. S. (1984). Selective prefrontal cortical projections to the region of the locus coeruleus and raphe nuclei in the rhesus monkey. Brain Research, 306(1–2), 9–18. - PubMed
    1. Aston‐Jones, G. , & Bloom, F. E. (1981). Activity of norepinephrine‐containing locus coeruleus neurons in behaving rats anticipates fluctuations in the sleep‐waking cycle. Journal of Neuroscience, 1(8), 876–886. - PMC - PubMed
    1. Aston‐Jones, G. , Ennis, M. , Pieribone, V. A. , Nickell, W. T. , & Shipley, M. T. (1986). The brain nucleus locus coeruleus: Restricted afferent control of a broad efferent network. Science, 234(4777), 734–737. - PubMed

Publication types