

Observation-based assessment of secondary water effects on seasonal vegetation decay across Africa
- PMID: 36156935
- PMCID: PMC9500241
- DOI: 10.3389/fdata.2022.967477
Observation-based assessment of secondary water effects on seasonal vegetation decay across Africa
Abstract
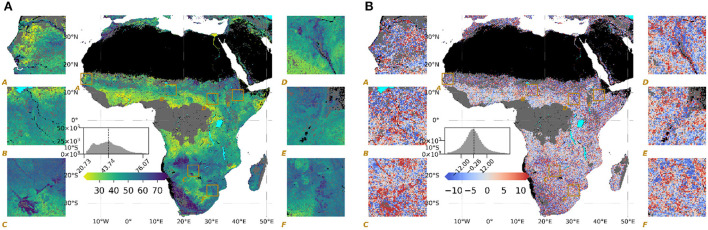
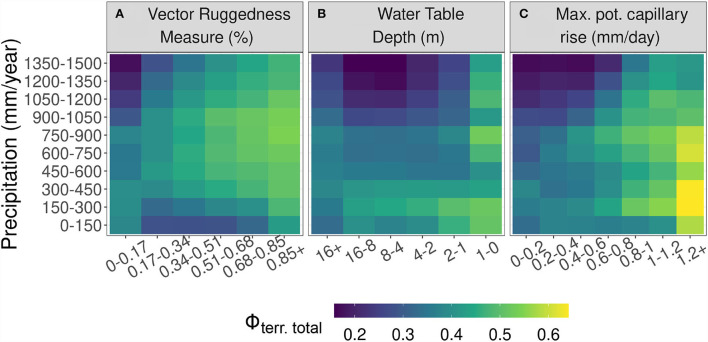
Local studies and modeling experiments suggest that shallow groundwater and lateral redistribution of soil moisture, together with soil properties, can be highly important secondary water sources for vegetation in water-limited ecosystems. However, there is a lack of observation-based studies of these terrain-associated secondary water effects on vegetation over large spatial domains. Here, we quantify the role of terrain properties on the spatial variations of dry season vegetation decay rate across Africa obtained from geostationary satellite acquisitions to assess the large-scale relevance of secondary water effects. We use machine learning based attribution to identify where and under which conditions terrain properties related to topography, water table depth, and soil hydraulic properties influence the rate of vegetation decay. Over the study domain, the machine learning model attributes about one-third of the spatial variations of vegetation decay rates to terrain properties, which is roughly equally split between direct terrain effects and interaction effects with climate and vegetation variables. The importance of secondary water effects increases with increasing topographic variability, shallower groundwater levels, and the propensity to capillary rise given by soil properties. In regions with favorable terrain properties, more than 60% of the variations in the decay rate of vegetation are attributed to terrain properties, highlighting the importance of secondary water effects on vegetation in Africa. Our findings provide an empirical assessment of the importance of local-scale secondary water effects on vegetation over Africa and help to improve hydrological and vegetation models for the challenge of bridging processes across spatial scales.
Keywords: Africa; drylands; ecohydrology; groundwater; secondary water resources; topography; vegetation decay rate; water limitation.
Copyright © 2022 Küçük, Koirala, Carvalhais, Miralles, Reichstein and Jung.
Conflict of interest statement
The authors declare that the research was conducted in the absence of any commercial or financial relationships that could be construed as a potential conflict of interest.
Figures


Similar articles
-
Characterizing the Response of Vegetation Cover to Water Limitation in Africa Using Geostationary Satellites.J Adv Model Earth Syst. 2022 Mar;14(3):e2021MS002730. doi: 10.1029/2021MS002730. Epub 2022 Feb 28. J Adv Model Earth Syst. 2022. PMID: 35865621 Free PMC article.
-
The potential of groundwater-dependent ecosystems to enhance soil biological activity and soil fertility in drylands.Sci Total Environ. 2022 Jun 20;826:154111. doi: 10.1016/j.scitotenv.2022.154111. Epub 2022 Feb 24. Sci Total Environ. 2022. PMID: 35218827
-
Spatio-temporal transpiration patterns reflect vegetation structure in complex upland terrain.Sci Total Environ. 2019 Dec 1;694:133551. doi: 10.1016/j.scitotenv.2019.07.357. Epub 2019 Jul 29. Sci Total Environ. 2019. PMID: 31756787
-
A multi-scale perspective of water pulses in dryland ecosystems: climatology and ecohydrology of the western USA.Oecologia. 2004 Oct;141(2):269-81. doi: 10.1007/s00442-004-1570-y. Epub 2004 May 8. Oecologia. 2004. PMID: 15138879 Review.
-
Phreatophytic vegetation and groundwater fluctuations: a review of current research and application of ecosystem response modeling with an emphasis on great basin vegetation.Environ Manage. 2005 Jun;35(6):726-40. doi: 10.1007/s00267-004-0194-7. Environ Manage. 2005. PMID: 15940400 Review.
References
-
- Adole T., Dash J., Atkinson P. M. (2016). A systematic review of vegetation phenology in Africa. Ecol. Inform. 34, 117–128. 10.1016/j.ecoinf.2016.05.004 - DOI
-
- Bly E. M., Arora V. K., Clark D. B., Dadson S. J., De Kauwe Ma. G., Lawrence D. M., et al. . (2021). Advances in land surface modelling. Curr. Climate Change Rep. 7, 45–71. 10.1007/s40641-021-00171-5 - DOI
-
- Boese S., Jung M., Carvalhais N., Teuling A. J., Reichstein M. (2019). Carbon-water flux coupling under progressive drought. Biogeosciences 16, 2557–2572. 10.5194/bg-16-2557-2019 - DOI
Associated data
LinkOut - more resources
Full Text Sources