

Artificial Intelligence Algorithm-Based Feature Extraction of Computed Tomography Images and Analysis of Benign and Malignant Pulmonary Nodules
- PMID: 36156972
- PMCID: PMC9492375
- DOI: 10.1155/2022/5762623
Artificial Intelligence Algorithm-Based Feature Extraction of Computed Tomography Images and Analysis of Benign and Malignant Pulmonary Nodules
Abstract
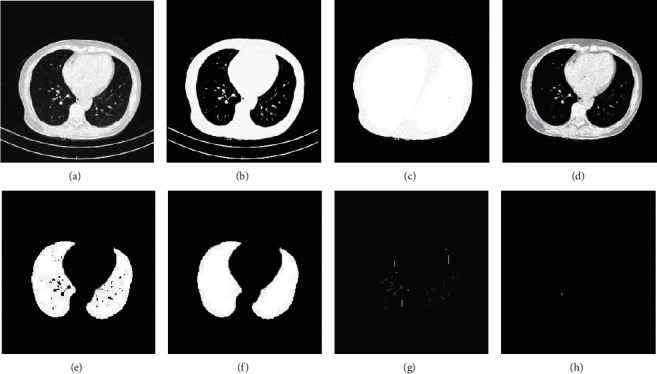
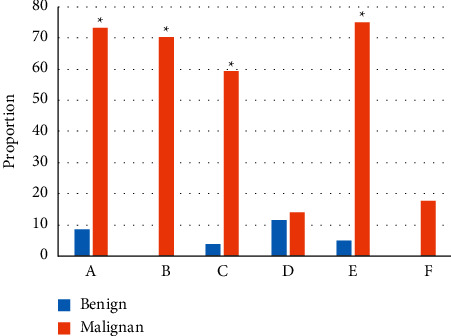
This study was aimed to explore the effect of CT image feature extraction of pulmonary nodules based on an artificial intelligence algorithm and the image performance of benign and malignant pulmonary nodules. In this study, the CT images of pulmonary nodules were collected as the research object, and the lung nodule feature extraction model based on expectation maximization (EM) was used to extract the image features. The Dice similarity coefficient, accuracy, benign and malignant nodule edges, internal signs, and adjacent structures were compared and analyzed to obtain the extraction effect of this feature extraction model and the image performance of benign and malignant pulmonary nodules. The results showed that the detection sensitivity of pulmonary nodules in this model was 0.955, and the pulmonary nodules and blood vessels were well preserved in the image. The probability of burr sign detection in the malignant group was 73.09% and that in the benign group was 8.41%. The difference was statistically significant (P < 0.05). The probability of malignant component leaf sign (69.96%) was higher than that of a benign component leaf sign (0), and the difference was statistically significant (P < 0.05). The probability of cavitation signs in the malignant group (59.19%) was higher than that in the benign group (3.74%), and the probability of blood vessel collection signs in the malignant group (74.89%) was higher than that in the benign group (11.21%), with statistical significance (P < 0.05). The probability of the pleural traction sign in the malignant group was 17.49% higher than that in the benign group (4.67%), and the difference was statistically significant (P < 0.05). In summary, the feature extraction effect of CT images based on the EM algorithm was ideal. Imaging findings, such as the burr sign, lobulation sign, vacuole sign, vascular bundle sign, and pleural traction sign, can be used as indicators to distinguish benign and malignant nodules.
Copyright © 2022 Yuantong Gao et al.
Conflict of interest statement
The authors declare that there are no conflicts of interest.
Figures


Similar articles
-
Application of CT Postprocessing Reconstruction Technique in Differential Diagnosis of Benign and Malignant Solitary Pulmonary Nodules and Analysis of Risk Factors.Comput Math Methods Med. 2022 Aug 9;2022:9739047. doi: 10.1155/2022/9739047. eCollection 2022. Comput Math Methods Med. 2022. Retraction in: Comput Math Methods Med. 2023 Jun 28;2023:9892068. doi: 10.1155/2023/9892068. PMID: 35983523 Free PMC article. Retracted.
-
Predicting malignant potential of solitary pulmonary nodules in patients with COVID-19 infection: a comprehensive analysis of CT imaging and tumor markers.BMC Infect Dis. 2024 Sep 27;24(1):1050. doi: 10.1186/s12879-024-09952-3. BMC Infect Dis. 2024. PMID: 39333962 Free PMC article.
-
Computer-aided diagnostic scheme for distinction between benign and malignant nodules in thoracic low-dose CT by use of massive training artificial neural network.IEEE Trans Med Imaging. 2005 Sep;24(9):1138-50. doi: 10.1109/TMI.2005.852048. IEEE Trans Med Imaging. 2005. PMID: 16156352
-
[Advances and Clinical Application of Malignant Probability Prediction Models for Solitary Pulmonary Nodule].Zhongguo Fei Ai Za Zhi. 2021 Sep 20;24(9):660-667. doi: 10.3779/j.issn.1009-3419.2021.102.29. Epub 2021 Aug 30. Zhongguo Fei Ai Za Zhi. 2021. PMID: 34455736 Free PMC article. Review. Chinese.
-
Risk factors for malignant solid pulmonary nodules: a meta-analysis.BMC Cancer. 2025 Feb 21;25(1):312. doi: 10.1186/s12885-025-13702-2. BMC Cancer. 2025. PMID: 39984890 Free PMC article.
Cited by
-
Diagnostic efficiency of artificial intelligence for pulmonary nodules based on CT scans.Am J Transl Res. 2023 May 15;15(5):3318-3325. eCollection 2023. Am J Transl Res. 2023. PMID: 37303635 Free PMC article.
-
A Systematic Review of AI Performance in Lung Cancer Detection on CT Thorax.Healthcare (Basel). 2025 Jun 24;13(13):1510. doi: 10.3390/healthcare13131510. Healthcare (Basel). 2025. PMID: 40648536 Free PMC article. Review.
-
Lightweight Advanced Deep Neural Network (DNN) Model for Early-Stage Lung Cancer Detection.Diagnostics (Basel). 2024 Oct 22;14(21):2356. doi: 10.3390/diagnostics14212356. Diagnostics (Basel). 2024. PMID: 39518324 Free PMC article.
References
MeSH terms
LinkOut - more resources
Full Text Sources
Medical
