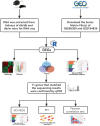
Bioinformatics prediction and experimental verification of key biomarkers for diabetic kidney disease based on transcriptome sequencing in mice
- PMID: 36157062
- PMCID: PMC9504448
- DOI: 10.7717/peerj.13932
Bioinformatics prediction and experimental verification of key biomarkers for diabetic kidney disease based on transcriptome sequencing in mice
Abstract
Background: Diabetic kidney disease (DKD) is the leading cause of death in people with type 2 diabetes mellitus (T2DM). The main objective of this study is to find the potential biomarkers for DKD.
Materials and methods: Two datasets (GSE86300 and GSE184836) retrieved from Gene Expression Omnibus (GEO) database were used, combined with our RNA sequencing (RNA-seq) results of DKD mice (C57 BLKS-32w db/db) and non-diabetic (db/m) mice for further analysis. After processing the expression matrix of the three sets of data using R software "Limma", differential expression analysis was performed. The significantly differentially expressed genes (DEGs) (-logFC- > 1, p-value < 0.05) were visualized by heatmaps and volcano plots respectively. Next, the co-expression genes expressed in the three groups of DEGs were obtained by constructing a Venn diagram. In addition, Gene Ontology (GO) and Kyoto Encyclopedia of Genes and Genomes (KEGG) pathway enrichment analysis were further analyzed the related functions and enrichment pathways of these co-expression genes. Then, qRT-PCR was used to verify the expression levels of co-expression genes in the kidney of DKD and control mice. Finally, protein-protein interaction network (PPI), GO, KEGG analysis and Pearson correlation test were performed on the experimentally validated genes, in order to clarify the possible mechanism of them in DKD.
Results: Our RNA-seq results identified a total of 125 DEGs, including 59 up-regulated and 66 down-regulated DEGs. At the same time, 183 up-regulated and 153 down-regulated DEGs were obtained in GEO database GSE86300, and 76 up-regulated and 117 down-regulated DEGs were obtained in GSE184836. Venn diagram showed that 13 co-expression DEGs among the three groups of DEGs. GO analysis showed that biological processes (BP) were mainly enriched inresponse to stilbenoid, response to fatty acid, response to nutrient, positive regulation of macrophage derived foam cell differentiation, triglyceride metabolic process. KEGG pathway analysis showed that the three major enriched pathways were cholesterol metabolism, drug metabolism-cytochrome P450, PPAR signaling pathway. After qRT-PCR validation, we obtained 11 genes that were significant differentially expressed in the kidney tissues of DKD mice compared with control mice. (The mRNA expression levels of Aacs, Cpe, Cd36, Slc22a7, Slc1a4, Lpl, Cyp7b1, Akr1c14 and Apoh were declined, whereas Abcc4 and Gsta2 were elevated).
Conclusion: Our study, based on RNA-seq results, GEO databases and qRT-PCR, identified 11 significant dysregulated DEGs, which play an important role in lipid metabolism and the PPAR signaling pathway, which provide novel targets for diagnosis and treatment of DKD.
Keywords: Bioinformatics analysis; Biomarker; Diabetic kidney disease (DKD); Differentially expressed genes (DEGs); RNA-seq.
©2022 Zhao et al.
Conflict of interest statement
The authors declare there are no competing interests.
Figures


Similar articles
-
Single-cell RNA and transcriptome sequencing profiles identify immune-associated key genes in the development of diabetic kidney disease.Front Immunol. 2023 Mar 29;14:1030198. doi: 10.3389/fimmu.2023.1030198. eCollection 2023. Front Immunol. 2023. PMID: 37063851 Free PMC article.
-
Screening and Identification of Hub Genes in the Development of Early Diabetic Kidney Disease Based on Weighted Gene Co-Expression Network Analysis.Front Endocrinol (Lausanne). 2022 Jun 3;13:883658. doi: 10.3389/fendo.2022.883658. eCollection 2022. Front Endocrinol (Lausanne). 2022. PMID: 35721731 Free PMC article.
-
Identification of potential key lipid metabolism-related genes involved in tubular injury in diabetic kidney disease by bioinformatics analysis.Acta Diabetol. 2024 Aug;61(8):1053-1068. doi: 10.1007/s00592-024-02278-1. Epub 2024 May 1. Acta Diabetol. 2024. PMID: 38691241
-
Comprehensive analyses of potential key genes in active tuberculosis: A systematic review.Medicine (Baltimore). 2021 Jul 30;100(30):e26582. doi: 10.1097/MD.0000000000026582. Medicine (Baltimore). 2021. PMID: 34397688 Free PMC article.
-
Effects of dietary curcumin on gene expression: An analysis of transcriptomic data in mice.Pathol Res Pract. 2024 Nov;263:155653. doi: 10.1016/j.prp.2024.155653. Epub 2024 Oct 11. Pathol Res Pract. 2024. PMID: 39426142 Review.
Cited by
-
Bioinformatic analyses reveal lysosomal-associated protein transmembrane 5 as a potential therapeutic target in lipotoxicity-induced injury in diabetic kidney disease.Ren Fail. 2024 Dec;46(2):2359638. doi: 10.1080/0886022X.2024.2359638. Epub 2024 Jun 4. Ren Fail. 2024. PMID: 38832484 Free PMC article.
-
Unveiling fatty acid subtypes: immunometabolic interplay and therapeutic opportunities in gastric cancer.Front Oncol. 2025 May 26;15:1570873. doi: 10.3389/fonc.2025.1570873. eCollection 2025. Front Oncol. 2025. PMID: 40492126 Free PMC article.
-
The potential biomarker value of soluble CD36 in the treatment of diabetic kidney disease: evidence from GLP-1 and insulin interventions.Front Endocrinol (Lausanne). 2025 May 27;16:1605631. doi: 10.3389/fendo.2025.1605631. eCollection 2025. Front Endocrinol (Lausanne). 2025. PMID: 40496556 Free PMC article.
-
Network pharmacology based virtual screening of Flavonoids from Dodonea angustifolia and the molecular mechanism against inflammation.Saudi Pharm J. 2023 Nov;31(11):101802. doi: 10.1016/j.jsps.2023.101802. Epub 2023 Sep 28. Saudi Pharm J. 2023. PMID: 37822694 Free PMC article.
-
Decoding multiple myeloma: single-cell insights into tumor heterogeneity, immune dynamics, and disease progression.Front Immunol. 2025 May 8;16:1584350. doi: 10.3389/fimmu.2025.1584350. eCollection 2025. Front Immunol. 2025. PMID: 40406148 Free PMC article.
References
-
- Aryal B, Rotllan N, Araldi E, Ramírez CM, He S, Chousterman BG, Fenn AM, Wanschel A, Madrigal-Matute J, Warrier N, Martín-Ventura JL, Swirski FK, Suárez Y, Fernández-Hernando C. ANGPTL4 deficiency in haematopoietic cells promotes monocyte expansion and atherosclerosis progression. Nature Communications. 2016;7:12313. doi: 10.1038/ncomms12313. - DOI - PMC - PubMed
-
- Athanasiadis G, Sabater-Lleal M, Buil A, Souto JC, Borrell M, Lathrop M, Watkins H, Almasy L, Hamsten A, Soria JM. Genetic determinants of plasma β2-glycoprotein I levels: a genome-wide association study in extended pedigrees from Spain. The Journal of Thrombosis and Haemostasis. 2013;11:521–528. doi: 10.1111/jth.12120. - DOI - PubMed
-
- Choi GS, Min HS, Cha JJ, Lee JE, Ghee JY, Yoo JA, Kim KT, Kang YS, Han SY, Bae YS, Lee SR, Yoo JY, Moon SH, Lee SJ, Cha DR. SH3YL1 protein as a novel biomarker for diabetic nephropathy in type 2 diabetes mellitus. Nutrition, Metabolism & Cardiovascular Diseases. 2021;31:498–505. doi: 10.1016/j.numecd.2020.09.024. - DOI - PubMed
Publication types
MeSH terms
Substances
Associated data
LinkOut - more resources
Full Text Sources
Medical
Research Materials
Miscellaneous

