

Hepatic metabolite responses to 4-day complete fasting and subsequent refeeding in rats
- PMID: 36157064
- PMCID: PMC9504452
- DOI: 10.7717/peerj.14009
Hepatic metabolite responses to 4-day complete fasting and subsequent refeeding in rats
Abstract
Background: Fasting has been widely used to improve various metabolic diseases in humans. Adaptive fasting is necessary for metabolic adaptation during prolonged fasting, which could overcome the great advantages of short-term fasting. The liver is the main organ responsible for energy metabolism and metabolic homeostasis. To date, we lack literature that describes the physiologically relevant adaptations of the liver during prolonged fasting and refeeding. For that reason, this study aims to evaluate the response of the liver of Sprague-Dawley (SD) rats to prolonged fasting and refeeding.
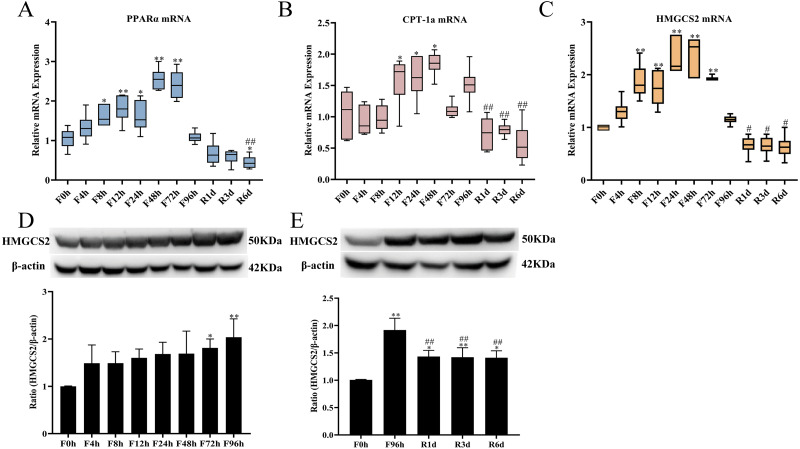
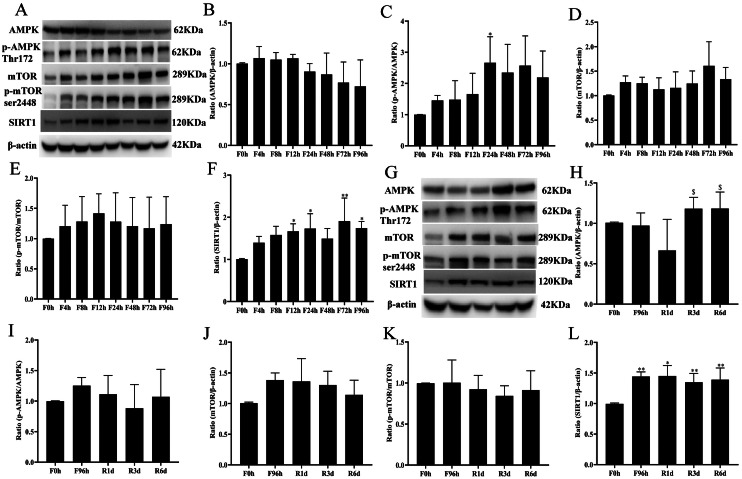
Methods: Sixty-six male SD rats were divided into the fasting groups, which were fasted for 0, 4, 8, 12, 24, 48, 72, or 96 h, and the refeeding groups, which were refed for 1, 3, or 6 days after 96 h of fasting. Serum glucose, TG, FFA, β-hydroxybutyrate, insulin, glucagon, leptin, adiponectin and FGF21 levels were assessed. The glucose content, PEPCK activity, TG concentration and FFA content were measured in liver tissue, and the expression of genes involved in gluconeogenesis (PEPCK and G6Pase), ketogenesis (PPARα, CPT-1a and HMGCS2) and the protein expression of nutrient-sensing signaling molecules (AMPK, mTOR and SIRT1) were determined by RT-qPCR and western blotting, respectively.
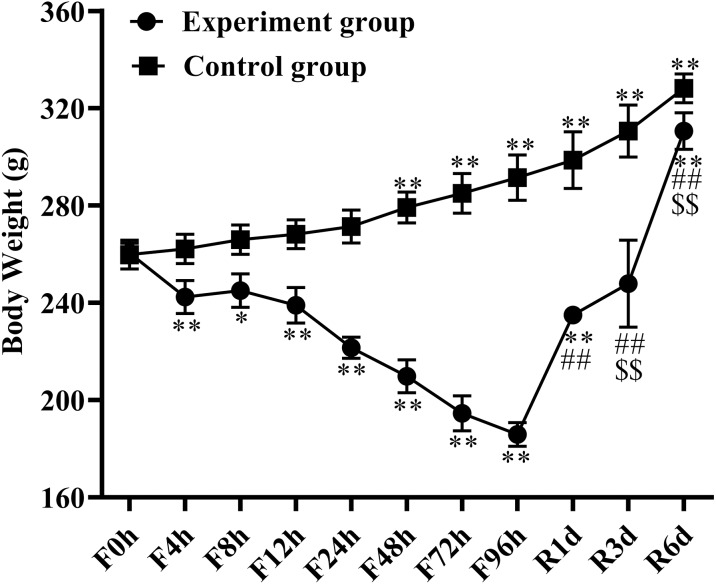
Results: Fasting significantly decreased the body weight, which was totally recovered to baseline after 3 days of refeeding. A 4-day fast triggered an energy metabolic substrate shift from glucose to ketones and caused serum hormone changes and changes in the protein expression levels of nutrient-sensing signaling molecules. Glycogenolysis served as the primary fuel source during the first 24 h of fasting, while gluconeogenesis supplied the most glucose thereafter. Serum FFA concentrations increased significantly with 48 h of fasting. Serum FFAs partly caused high serum β-hydroxybutyrate levels, which became an important energy source with the prolongation of the fasting duration. One day of refeeding quickly reversed the energy substrate switch. Nutrient-sensing signaling molecules (AMPK and SIRT1 but not mTOR signaling) were highly expressed at the beginning of fasting (in the first 4 h). Serum insulin and leptin decreased with fasting initiation, and serum glucagon increased, but adiponectin and FGF21 showed no significant changes. Herein, we depicted in detail the timing of the metabolic response and adaptation of the liver to a 4-day water-only fast and subsequent refeeding in rats, which provides helpful support for the design of safe prolonged and intermittent fasting regimens.
Keywords: Gluconeogenesis; Hormone; Ketogenesis; Lipolysis; Metabolic syndrome; Nutrient-sensing signaling molecules; Prolonged fasting.
©2022 Sui et al.
Conflict of interest statement
The authors declare there are no competing interests.
Figures


Similar articles
-
Effects of fasting and refeeding on serum leptin, adiponectin and free fatty acid concentrations in young and old male rats.Gerontology. 2005 Nov-Dec;51(6):357-62. doi: 10.1159/000088698. Gerontology. 2005. PMID: 16299415
-
Hepatic adaptations to maintain metabolic homeostasis in response to fasting and refeeding in mice.Nutr Metab (Lond). 2016 Sep 26;13:62. doi: 10.1186/s12986-016-0122-x. eCollection 2016. Nutr Metab (Lond). 2016. PMID: 27708682 Free PMC article.
-
[Electroacupuncture improves glucose and lipid metabolism by regulating APN/AMPK/PPARα signaling of skeletal muscle in Zucker diabetic obese rats].Zhen Ci Yan Jiu. 2021 Nov 25;46(11):907-13. doi: 10.13702/j.1000-0607.20210201. Zhen Ci Yan Jiu. 2021. PMID: 34865326 Chinese.
-
Energy metabolism in the liver.Compr Physiol. 2014 Jan;4(1):177-97. doi: 10.1002/cphy.c130024. Compr Physiol. 2014. PMID: 24692138 Free PMC article. Review.
-
Regulation of energy metabolism by long-chain fatty acids.Prog Lipid Res. 2014 Jan;53:124-44. doi: 10.1016/j.plipres.2013.12.001. Epub 2013 Dec 18. Prog Lipid Res. 2014. PMID: 24362249 Review.
Cited by
-
Exercise Equals the Mobilization of Visceral versus Subcutaneous Adipose Fatty Acid Molecules in Fasted Rats Associated with the Modulation of the AMPK/ATGL/HSL Axis.Nutrients. 2023 Jul 10;15(14):3095. doi: 10.3390/nu15143095. Nutrients. 2023. PMID: 37513513 Free PMC article.
-
The Regulatory Impact of CFLAR Methylation Modification on Liver Lipid Metabolism.Int J Mol Sci. 2024 Jul 19;25(14):7897. doi: 10.3390/ijms25147897. Int J Mol Sci. 2024. PMID: 39063139 Free PMC article.
-
Mitochondrial ATP concentration decreases immediately after glucose administration to glucose-deprived hepatocytes.FEBS Open Bio. 2024 Jan;14(1):79-95. doi: 10.1002/2211-5463.13744. Epub 2023 Dec 13. FEBS Open Bio. 2024. PMID: 38049196 Free PMC article.
-
Fasting Mimicking Diet for Metabolic Syndrome: A Narrative Review of Human Studies.Metabolites. 2025 Feb 23;15(3):150. doi: 10.3390/metabo15030150. Metabolites. 2025. PMID: 40137116 Free PMC article. Review.
-
A Comprehensive Perspective on the Biological Effects of Intermittent Fasting and Periodic Short-Term Fasting: A Promising Strategy for Optimizing Metabolic Health.Nutrients. 2025 Jun 20;17(13):2061. doi: 10.3390/nu17132061. Nutrients. 2025. PMID: 40647166 Free PMC article. Review.
References
-
- Ahlersová E, Ahlers I, Smajda B, Ivancinová O, Paulíková E. Circadian rhythm of blood glucose and tissue glycogen in fed and fasted rats. Physiologia Bohemoslovaca. 1980;29:515–523. - PubMed
Publication types
MeSH terms
Substances
LinkOut - more resources
Full Text Sources
Miscellaneous
