. 2022 Sep 16:2022:4835826.
doi: 10.1155/2022/4835826. eCollection 2022.

Predicting Prognosis of Hepatocellular Carcinoma Patients Based on the Expression Signatures of Mitophagy Genes

Affiliations

Predicting Prognosis of Hepatocellular Carcinoma Patients Based on the Expression Signatures of Mitophagy Genes

Yan-Ke Li et al. Dis Markers. .

Abstract

Background: The unbalance of mitophagy was closely related to hepatocellular carcinoma (HCC) progression. At present, it has not been uncovered about the influence of mitophagy genes on HCC prognosis and their potential pathogenesis.

Materials and methods: The expression and clinical information of HCC in TCGA cohort were used to identify mitophagy differentially expressed genes (MDEGs) with prognostic value. The prognostic model of mitophagy genes was built and externally validated by LASSO regression in TCGA cohort and ICGC cohort, respectively. The function of the prognostic signature and its association with immune cell infiltration were explored. The profile of MDEGs was validated with 39 pairs HCC and paracarcinoma tissues by quantitative reverse transcription-PCR (qRT-PCR).

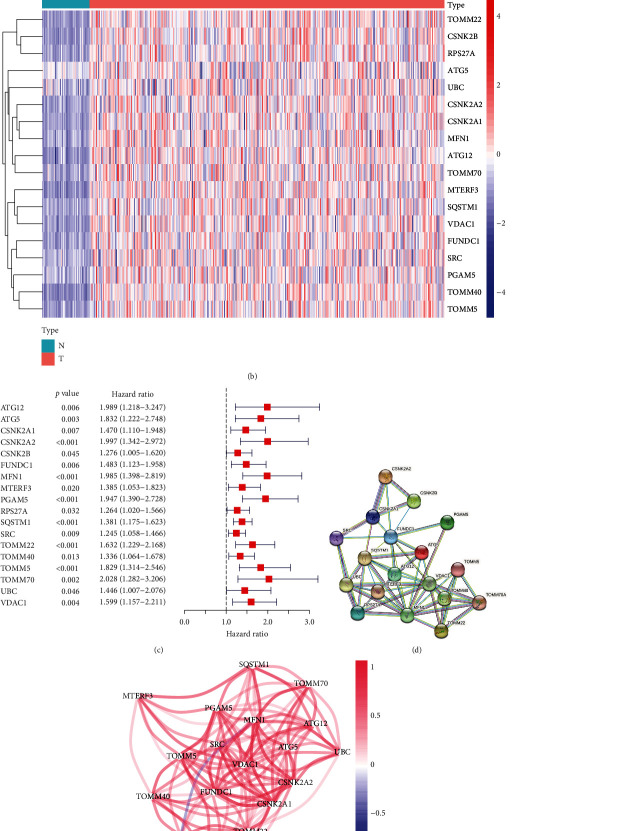
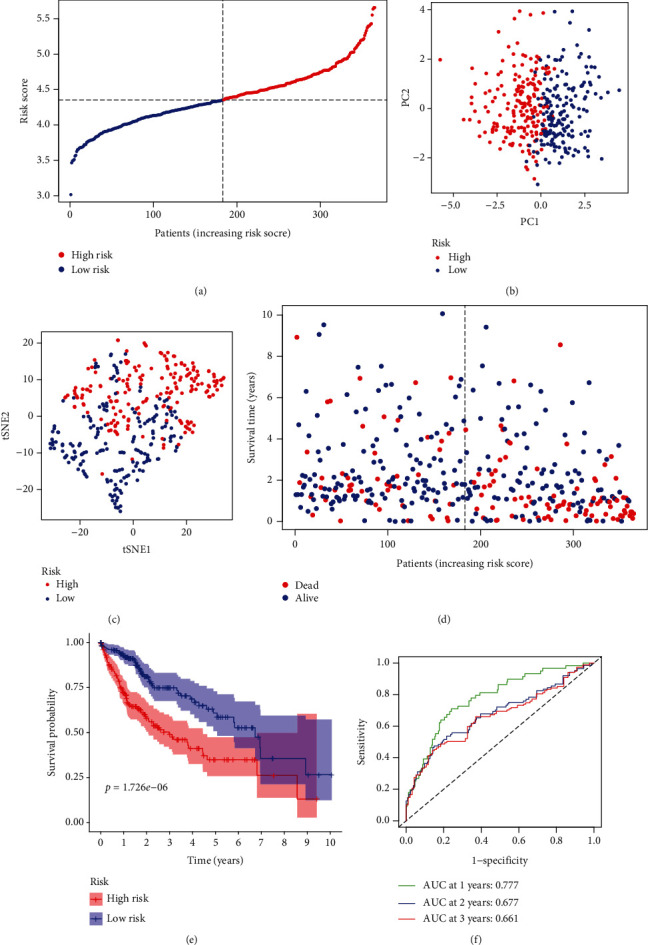
Results: A total of 18 mitophagy genes that were upregulated and contributed to poor prognosis in HCC were identified. These genes could interact with each other. The correlation analysis showed that there was positively correlation among mitophagy genes. According to optimal λ value, 8 mitophagy gene signatures were involved in prognostic model. Based on median risk scores, HCC patients were divided into high-risk group and low-risk group. Compared with the low-risk group, the high-risk group has worse overall survival in TCGA cohort and ICGC cohort. The univariate and multivariate Cox regression analysis suggested that risk score was an independent prognostic factor of HCC patients. Time-dependent ROC curve was used to identify and validate good predicting performance of the prognostic model. Enrichment analysis showed that risk differentially expressed genes were enriched in various metabolism and cell division processes. The immune cell infiltration score and immune function were significantly different in two groups. qRT-PCR validation result showed that QSTM1, CSNK2B, PGAM5, and ATG5 were upregulated.

Conclusion: Mitophagy genes could influence HCC progression through regulating the metabolism and immune functions and could be used to predict prognosis and considered as potential prognostic biomarker and precise therapeutic target of HCC.


Conflict of interest statement

All authors disclose no conflicts of interest that might bias their work.

Figures

Figure 1
Figure 1
Identification of the prognostic MDEGs in TCGA cohort. (a) The intersect mitophagy genes between DEGs and prognostic genes. (b) The differentially expressed heatmap of prognostic mitophagy genes. (c) The univariate Cox regression analysis of prognostic MDEGs. (d) The protein-protein interaction network of prognostic MDEGs. (e) The correlation among prognostic MDEGs. HCC: hepatocellular carcinoma; MDEGs: mitophagy differentially expressed genes; TCGA: The Cancer Genome Atlas.
Figure 2
Figure 2
Prognostic characteristic of the 8-gene signature model in the TCGA cohort. (a) Distribution and median values of risk scores in the TCGA cohort. (b) PCA between the high-risk group and low-risk group in the TCGA cohort. (c) t-SNE analysis between the high-risk group and low-risk group in the TCGA cohort. (d) With the increasing of risk scores, the distribution of patient survival status in the TCGA cohort. (e) Overall survival of patients between the high-risk group and low-risk group in the TCGA cohort. (f) AUC of time-dependent ROC curves verified the prognostic performance of the risk score in the TCGA cohort. AUC: area under curve; PCA: principal component analysis; ROC: receiver operating characteristic curve; t-SNE, t-distributed stochastic neighbor embedding; TCGA: The Cancer Genome Atlas.
Figure 3
Figure 3
Validation prognostic characteristic of the 8-gene signature model in the ICGC cohort. (a) Distribution and median values of risk scores in the ICGC cohort. (b) PCA between the high-risk group and low-risk group in the ICGC cohort. (c) t-SNE analysis between the high-risk group and low-risk group in the ICGC cohort. (d) With the increasing of risk scores, the distribution of patient survival status in the ICGC cohort. (e) Overall survival of patients between the high-risk group and low-risk group in the ICGC cohort. (f) AUC of time-dependent ROC curves verified the prognostic performance of the risk score in the ICGC cohort. AUC: area under curve; PCA: principal component analysis; ROC: receiver operating characteristic curve; t-SNE: t-distributed stochastic neighbor embedding; ICGC: International Cancer Genome Consortium.
Figure 4
Figure 4
Univariate and multivariate Cox regression analyses for OS in the TCGA train group and ICGC test group. (a) Univariate Cox regression analyses in the TCGA train group. (b) Multivariate Cox regression analyses in the TCGA train group. (c) Univariate Cox regression analyses in the ICGC test group. (d) Multivariate Cox regression analyses in the ICGC test group. OS: overall survival; ICGC: International Cancer Genome Consortium; TCGA: The Cancer Genome Atlas.
Figure 5
Figure 5
GO and KEGG analyses of differentially expressed genes in the high-risk group and low-risk group in the TCGA cohort (a and b) and ICGC cohort (c and d). (a) GO analysis in TCGA cohort. (b) KEGG analysis in TCGA cohort. (c) GO analysis in ICGC cohort. (d) KEGG analysis in ICGC cohort. GO: Gene Ontology; KEGG: Kyoto Encyclopedia of Genes and Genomes; ICGC: International Cancer Genome Consortium; TCGA: The Cancer Genome Atlas.
Figure 6
Figure 6
The scores of immune cells and immune-related function of differentially expressed genes in the high-risk group and low-risk group in the TCGA cohort (a and b) and ICGC cohort (c and d). (a) The scores of immune cells in TCGA cohort. (b) The scores of immune cells in ICGC cohort. (c) The immune-related function in TCGA cohort. (d) The immune-related function in ICGC cohort. ICGC: International Cancer Genome Consortium; TCGA: The Cancer Genome Atlas.
Figure 7
Figure 7
qRT-PCR validation in hepatocellular carcinoma tissues (n = 39). (a) SQSTM1. (b) CSNK2B. (c) PGAM5. (d) ATG5. (e) TOMM5. (f) TOMM22. (g) TOMM70. (h) MFN1. Measurement data were expressed as mean ± SEM. qRT-PCR: quantitative real-time polymerase chain reaction. SEM: standard error of median.

Similar articles

Cited by

References

    1. Villanueva A. Hepatocellular carcinoma. The New England Journal of Medicine . 2019;380(15):1450–1462. doi: 10.1056/NEJMra1713263. - DOI - PubMed
    1. Galluzzi L., Kepp O., Trojel-Hansen C., Kroemer G. Mitochondrial control of cellular life, stress, and death. Circulation Research . 2012;111(9):1198–1207. doi: 10.1161/CIRCRESAHA.112.268946. - DOI - PubMed
    1. Wu N. N., Zhang Y., Ren J. Mitophagy, mitochondrial dynamics, and homeostasis in cardiovascular aging. Oxidative Medicine and Cellular Longevity . 2019;2019:15. doi: 10.1155/2019/9825061.9825061 - DOI - PMC - PubMed
    1. Bhargava P., Schnellmann R. G. Mitochondrial energetics in the kidney. Nature Reviews Nephrology . 2017;13(10):629–646. doi: 10.1038/nrneph.2017.107. - DOI - PMC - PubMed
    1. Zong W. X., Rabinowitz J. D., White E. Mitochondria and cancer. Molecular Cell . 2016;61(5):667–676. doi: 10.1016/j.molcel.2016.02.011. - DOI - PMC - PubMed