

doi: 10.1016/j.gendis.2022.02.019.
eCollection 2022 Nov.
SENP7 overexpression protects cancer cells from oxygen and glucose deprivation and associates with poor prognosis in colon cancer
Affiliations
- PMID: 36157488
- PMCID: PMC9485274
- DOI: 10.1016/j.gendis.2022.02.019
Item in Clipboard
SENP7 overexpression protects cancer cells from oxygen and glucose deprivation and associates with poor prognosis in colon cancer
Genes Dis.
.
No abstract available
Figures
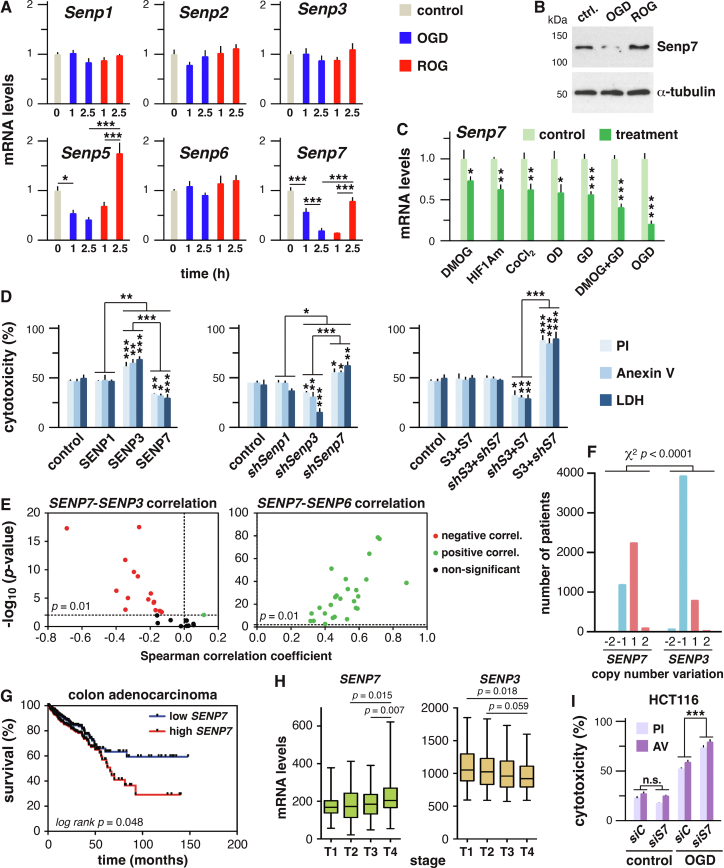
Oxygen and glucose deprivation regulates expression of SENP7, which promotes cell survival and associates with poor colon cancer prognosis. (A) Relative mRNA levels of the indicated genes, as determined by quantitative PCR (qPCR), in control P19 cells (0) or cells subjected to OGD and ROG (after 2.5 h of OGD) for the indicated time points. Levels were normalized to the levels at 0 h. Values are means ± S.D. of three independent experiments analyzed in triplicate. Statistical significance of changes in gene expression was analyzed by one-way ANOVA (P < 0.05) followed by the Tukey's post-test: ∗P < 0.05, ∗∗P < 0.01, ∗∗∗P < 0.001. (B) Protein levels of SENP7 were analyzed by Western blot under control, 2.5 h OGD and 2.5 h ROG (after 2.5 h OGD) conditions. 40 μg of total protein were loaded per lane. α-tubulin levels were determined as a loading control. (C)Senp7 mRNA levels were determined by qPCR in cells subjected to: addition of DMOG, expression of mutant HIF1A (HIF1Am), cobalt chloride, oxygen deprivation (OD), glucose deprivation (GD), combined DMOG and GD, and OGD. Values and statistic were as in (A). (D) The percentage of cytotoxicity was determined in P19 cells subjected to harmful OGD by propidium iodide (PI) or Anexin V labeling, or by measurement of LDH activity, after transfection of (left panel) empty vector (control) and expression constructs for SENP1, 3 and 7, (middle panel) a control shRNA and expression constructs for shRNA molecules (sh) against Senp1, 3 and 7 mRNAs, and (right panel) empty vector (control) and different combinations of expression constructs for SENP7 (S7) and SENP3 (S3), and expression constructs for sh against their corresponding mRNAs. Values are means ± S.D. of three independent determinations. Statistic was as in (A). (E) Volcano plots showing Spearman correlation coefficient versus –log10 (P-value) for the correlation between mRNA levels of SENP7 and SENP3 (left panel) or the SENP7 and SENP6 (right panel) in different types of tumors. Each dot represents a different type of tumor. Negative correlations are depicted in red and positive correlations are depicted in green. For P > 0.01 dots are depicted in black. (F) Copy number variation data for SENP7 and SENP3 in TCGA PanCancer cohort (n = 10528 samples). −2 and −1 indicates deep and shallow deletions respectively. 2 and 1 indicates high level and low level amplification, respectively. (G) Kaplan–Meier survival plots for colon adenocarcinoma patients from TCGA cohort. Patients were divided into two subgroups according to the SENP7 mRNA levels. P-value was calculated by the log-rank test. (H) Boxplot of transcript levels of SENP7 (left panel) or SENP3 (right panel) in colon adenocarcinoma tumors with different histological grades (T1 to T4). Unpaired Student t-test P-values among the indicated distributions are provided. (I) The percentage of cytotoxicity was determined in HCT116 cells subjected to harmful OGD or under normal growth conditions (control) by propidium iodide (PI) and Anexin V (AV) labeling, after transfection of control (siC) or SENP7-directed (siS7) siRNAs. Values are means ± S.D. of three independent determinations. Statistic was as in (A).
Similar articles
-
HIF-1α activation under glucose deprivation plays a central role in the acquisition of anti-apoptosis in human colon cancer cells.Int J Oncol. 2014 Jun;44(6):2077-84. doi: 10.3892/ijo.2014.2367. Epub 2014 Apr 3. Int J Oncol. 2014. PMID: 24718784
-
The Sumo protease Senp7 is required for proper neuronal differentiation.Biochim Biophys Acta. 2016 Jul;1863(7 Pt A):1490-8. doi: 10.1016/j.bbamcr.2016.03.028. Epub 2016 Mar 31. Biochim Biophys Acta. 2016. PMID: 27039038
-
LIMS1 Promotes Pancreatic Cancer Cell Survival under Oxygen-Glucose Deprivation Conditions by Enhancing HIF1A Protein Translation.Clin Cancer Res. 2019 Jul 1;25(13):4091-4103. doi: 10.1158/1078-0432.CCR-18-3533. Epub 2019 Jan 24. Clin Cancer Res. 2019. PMID: 30679163 Free PMC article.
-
Overexpression of bcl-xL protects astrocytes from glucose deprivation and is associated with higher glutathione, ferritin, and iron levels.Anesthesiology. 1999 Oct;91(4):1036-46. doi: 10.1097/00000542-199910000-00024. Anesthesiology. 1999. PMID: 10519507
-
N-hydroxy-N'-(4-butyl-2-methylphenyl)-formamidine attenuates oxygen-glucose deprivation and reoxygenation-induced cerebral ischemia-reperfusion injury via regulation of microRNAs.J Integr Neurosci. 2020 Jun 30;19(2):303-311. doi: 10.31083/j.jin.2020.02.1236. J Integr Neurosci. 2020. PMID: 32706194
Cited by
-
Human introns contain conserved tissue-specific cryptic poison exons.NAR Genom Bioinform. 2024 Dec 11;6(4):lqae163. doi: 10.1093/nargab/lqae163. eCollection 2024 Dec. NAR Genom Bioinform. 2024. PMID: 39664813 Free PMC article.
-
The SUMOylation and ubiquitination crosstalk in cancer.J Cancer Res Clin Oncol. 2023 Nov;149(17):16123-16146. doi: 10.1007/s00432-023-05310-z. Epub 2023 Aug 28. J Cancer Res Clin Oncol. 2023. PMID: 37640846 Free PMC article. Review.
-
Cancer-Associated Dysregulation of Sumo Regulators: Proteases and Ligases.Int J Mol Sci. 2022 Jul 20;23(14):8012. doi: 10.3390/ijms23148012. Int J Mol Sci. 2022. PMID: 35887358 Free PMC article. Review.
-
SUMO2/3 modification of transcription-associated proteins controls cell viability in response to oxygen and glucose deprivation-mediated stress.Cell Death Discov. 2025 May 10;11(1):230. doi: 10.1038/s41420-025-02513-w. Cell Death Discov. 2025. PMID: 40348773 Free PMC article.
References
-
- Xie M., Yu J., Ge S., Huang J., Fan X. SUMOylation homeostasis in tumorigenesis. Cancer Lett. 2020;469:301–309. - PubMed
