. 2022 Sep 5;25(10):105070.
doi: 10.1016/j.isci.2022.105070. eCollection 2022 Oct 21.

Coxsackievirus B infections are common in Cystic Fibrosis and experimental evidence supports protection by vaccination

Affiliations

Coxsackievirus B infections are common in Cystic Fibrosis and experimental evidence supports protection by vaccination

Virginia M Stone et al. iScience. .

Abstract

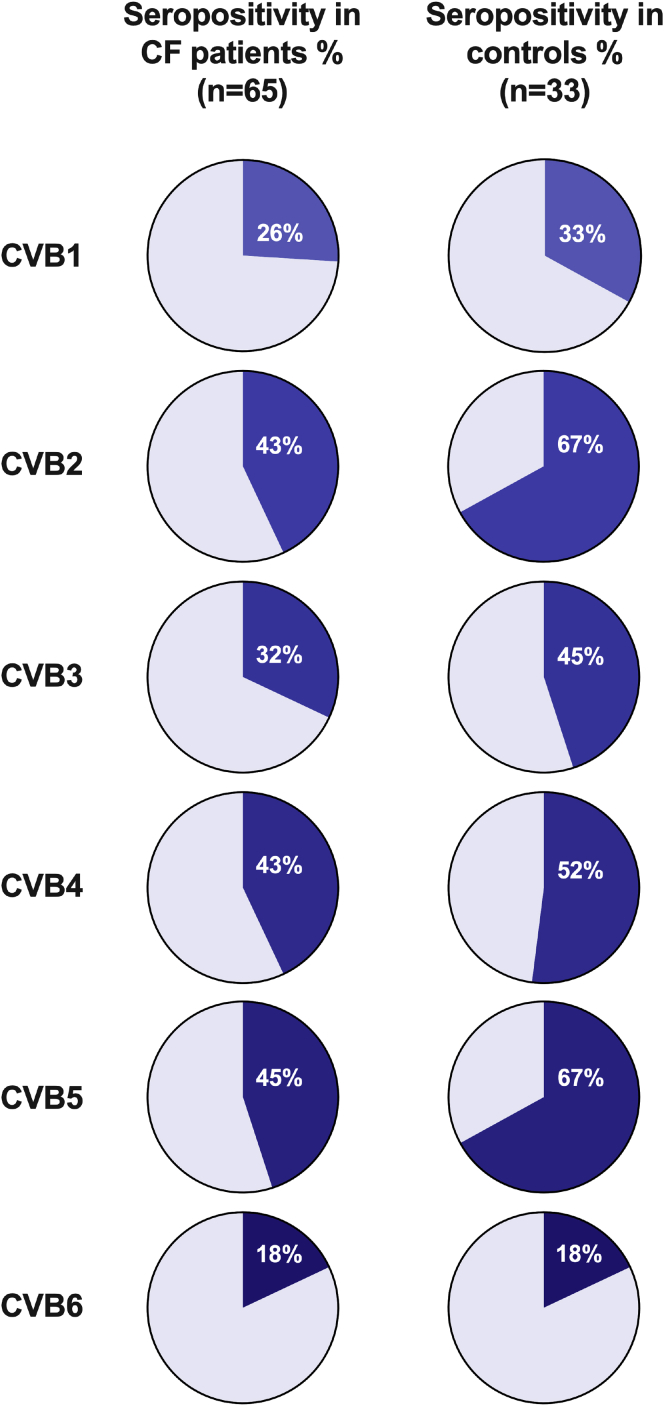
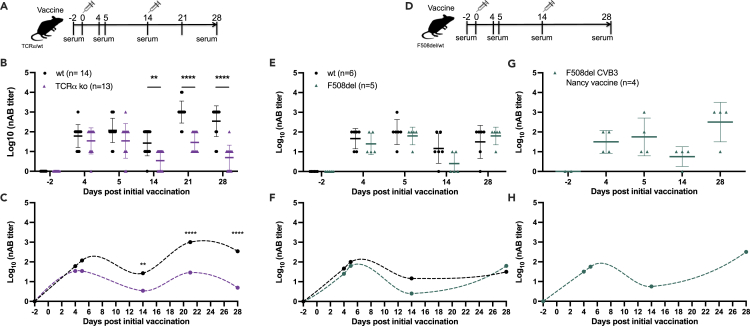
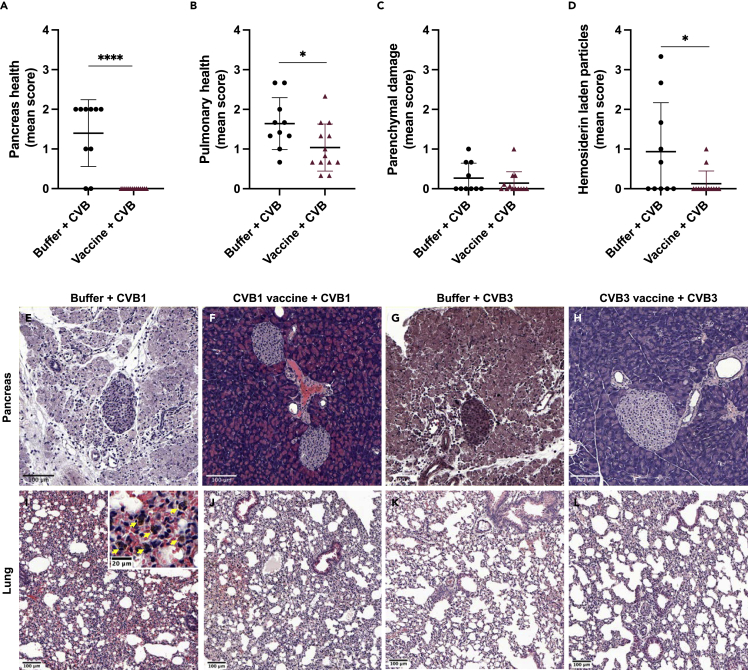
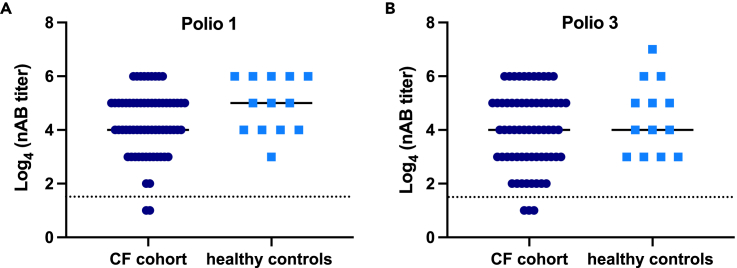
Viral respiratory tract infections exacerbate airway disease and facilitate life-threatening bacterial colonization in cystic fibrosis (CF). Annual influenza vaccination is recommended and vaccines against other common respiratory viruses may further reduce pulmonary morbidity risk. Enteroviruses have been found in nasopharyngeal samples from CF patients experiencing pulmonary exacerbations. Using serology tests, we found that infections by a group of enteroviruses, Coxsackievirus Bs (CVBs), are prevalent in CF. We next showed that a CVB vaccine, currently undergoing clinical development, prevents infection and CVB-instigated lung damage in a murine model of CF. Finally, we demonstrate that individuals with CF have normal vaccine responses to a similar, commonly used enterovirus vaccine (inactivated poliovirus vaccine). Our study demonstrates that CVB infections are common in CF and provides experimental evidence indicating that CVB vaccines could be efficacious in the CF population. The role of CVB infections in contributing to pulmonary exacerbations in CF should be further studied.

Keywords: Virology.


Conflict of interest statement

H.H. owns stocks in, and is the chairman of, the board of Vactech Ltd that develops vaccines against picornaviruses. H.H. and M.F.T. serve on the scientific advisory board of Provention Bio Inc. that develops vaccines against Coxsackie B viruses in collaboration with Vactech Ltd. The remaining authors declare that they have no conflict of interests.

Figures

None
Graphical abstract
Figure 1
Figure 1
CVB1-6 seropositivity in CF and healthy control cohorts Serum was extracted from blood-samples collected at yearly check-up appointments in the CF cohort (n = 65) or from samples taken from healthy individuals (n = 33) included in other studies at the Karolinska Institute. CVB1-6 seropositivity was examined by measuring the presence of neutralizing antibodies against the CVB1-6 viruses, using a standard plaque reduction assay. The cut-off titer for seropositivity was set to ≥1:16 for all six serotypes. The pie charts show the fraction of individuals that were positive for each CVB serotype in the two groups (blue color) and the white numbers show the exact percentage of positive cases in each group. See also Figure S1.
Figure 2
Figure 2
Immune response to a CVB3 vaccine is in part T-cell-dependent but is mainly intact in F508del mice (A–C) Female TCRα ko (purple triangles; n = 13) and wt (black circles; n = 14) mice were vaccinated on two occasions (days 0 and 14) with a CVB3-field isolate vaccine (1.8 μg per dose, interscapular injection). (A) Experimental setup. (B) CVB3 neutralizing antibody (nAB) titers measured in the serum on days −2, 4, 5, 14, 21, and 28 after the initial vaccination by standard plaque neutralization assay. Individual mice are represented by single symbols. The horizontal line represents the mean ± SD ∗∗p < 0.01, ∗∗∗∗p < 0.0001 by two-way ANOVA with Sidak’s multiple comparison test. (C) nAB titer fluctuations after vaccination in the wt and TCRα KO mice visualized by an Akima spline. (D–F) Female F508del (green triangles; n = 5) and wt (black circles; n = 6) mice were vaccinated with a CVB3-field isolate vaccine (also used in a-c; 1.8 μg per dose, interscapular injection) on two occasions (days 0 and 14) as illustrated in (D). ICVB3 nAB titers were measured in the serum on days −2, 4, 5, 14, and 28 after the initial vaccination by standard plaque reduction assay. Individual mice are represented by single symbols. The horizontal line represents the mean ± SD. No statistical differences in nAB titers were found between the wt and F508del mice, two-way ANOVA with Sidak’s multiple comparison test. (F) Virus nAB titer fluctuations after vaccination with CVB3-field isolate vaccine in the wt and F508del mice visualized by an Akima spline. (G) Female and male F508del mice were vaccinated with CVB3-Nancy vaccine (n = 4; green triangles; 1.8 μg per dose, interscapular injection) twice on days 0 and 14 as illustrated in (D). CVB3 nAB titers measured in the serum on days −2, 4, 5, 14, and 28 after the initial vaccination by standard plaque neutralization assay. Individual mice are represented by single symbols. The horizontal line represents the mean ± SD. (H) nAB titer fluctuations after vaccination with CVB3-Nancy vaccine in F508del mice visualized by an Akima spline. See also Figures S2 and S3.
Figure 3
Figure 3
F508del mice raise virus neutralizing antibodies when vaccinated with monovalent CVB1 and CVB3 vaccines Female and male F508del mice were left untreated (n = 1, CVB3 study), mock-vaccinated with buffer (n = 3 for CVB3, n = 6 for CVB1), or vaccinated three times (on days 0, 21, and 35) with either CVB1 (CDC7; n = 6) vaccine (B and C), or CVB3 (Nancy; n = 8) vaccine (D and E), as illustrated by the vaccination schedule illustrated in (A). Each vaccine dose contained 1.8 μg of protein and was given by interscapular injection. The animals were infected with either CVB1 or CVB3 virus on day 63 after the initial vaccine dose and monitored until day 67. (B and D) Virus neutralizing antibody (nAB) titers in the serum of mice vaccinated with CVB1 vaccine (D; light teal triangle) or CVB3 vaccine (e; dark green triangle) on days 0, 21, 35, and 63 after the prime vaccination as measured by standard plaque neutralization assay. Individual animals are represented by individual symbols. The horizontal line represents the mean ± SD. (C and E) Fluctuations in virus neutralizing antibodies in CVB1- (C) and CVB3- (E) vaccinated mice as visualized by Akima Spline. See also Figure S4.
Figure 4
Figure 4
CVB vaccines prevent acute CVB infections in F508del mice Female and male F508del mice were left untreated (n = 1, CVB3 study; black circles), mock-vaccinated with vaccine buffer (n = 6, CVB1 study; n = 3 CVB3 study; black circles), or vaccinated with CVB1 vaccine (A, C, and E; n = 6; light teal triangles) or CVB3 vaccine (B, D, and F; n = 8; dark teal triangles) as depicted in the schematic in Figure 3A. On day 63 after the prime vaccination, the animals were infected with CVB1 (A, C, and E) or CVB3 (B, D, and F) and blood was collected on days 3 and 4 post-infection (p.i.). The experiment was terminated on day 4 p.i. and organs were collected. (A and B) Mean percentage body weight from the day of infection (day 0) in buffer-treated and CVB-vaccinated mice. Shown are the mean values ±SD ∗p < 0.05 and ∗∗∗p < 0.001 when comparing buffer versus vaccine at each time point by two-way ANOVA with Sidak’s multiple comparison test. ##p < 0.01 when comparing the time point with day 0 in each group by two-way ANOVA with Sidak’s multiple comparison test. (C and D) Replicating virus in the blood of untreated/buffer-treated, CVB1-vaccinated (C), or CVB3-vaccinated (D) mice as measured by standard plaque assay on days 3 and 4 p.i.. Each animal is represented by an individual symbol and the horizontal line represents the mean ± SD ∗p < 0.05 and ∗∗p < 0.01 as compared by the Mann–Whitney U test. (E and F) Titers of replicating virus particles in the organs of untreated/buffer-treated, CVB1-vaccinated (E), or CVB3-vaccinated (F) mice on day 4 p.i. measured by a standard plaque assay. Each animal is represented by an individual symbol and the horizontal line represents the mean ± SD ∗p < 0.05 and ∗∗p < 0.01 as compared by the Mann–Whitney U test.
Figure 5
Figure 5
Vaccination of F508del mice with CVB vaccines prevent virus-mediated organ damage F508del mice were buffer-treated (n = 10) or vaccinated with CVB1 or CVB3 vaccines (n = 13) and infected with CVB1 or CVB3 virus, as shown in Figure 3A. Organs were collected on day 4 post-infection for histological analysis of organ integrity by haematoxylin and eosin (H&E) staining of formalin fixed paraffin embedded sections. (A) Pancreas scores of buffer + CVB or vaccine + CVB groups. Pancreas were scored according to exocrine damage and the presence of infiltrating immune cells. (B) Parenchymal health, (C) parenchymal damage and (D) hemosiderin laden particle staining in the lungs of buffer-treated + CVB-infected or vaccinated + CVB-infected mice. For (A)–(D), a score of 0 indicates healthy tissue and a score of 4 indicates highly damaged tissue. Each mouse is represented by an individual symbol and shown are the mean values ±SD ∗p < 0.05, ∗∗∗∗p < 0.001, as compared by the unpaired t-test. (E−L) Representative images of H&E-stained pancreas (E−H) and lung (I–L) from buffer + CVB1 (E and I), CVB1 vaccine + CVB1 (F and J), buffer + CVB3 (G and K), and CVB3 vaccine + CVB (H and L)-treated F508del mice on day 4 post-infection. In (I), the insert is a 5× magnification of the original image and the yellow arrows show hemosiderin laden particles. See also Figures S5 and S6.
Figure 6
Figure 6
Individuals with CF mount a similar level of immunity to poliovirus vaccine as healthy controls Serum was collected from blood taken from CF patients at their annual check-up meeting (n = 65) or from healthy controls included in other studies at the Karolinska Institute (n = 33). Neutralizing antibodies (nAB) specific for polio 1 (A) and polio 3 (B) were measured by standard plaque reduction assay. The data are expressed as a log4 of 4-fold dilutions (1:4 to 1:16,384 dilutions). The solid lines represent the median values and the dotted lines represent the cut-off for protective antibody titers (≥1:8 for polio 1 and 3). No significant differences were observed between the two groups using an unpaired t-test.

References

    1. Asner S., Waters V., Solomon M., Yau Y., Richardson S.E., Grasemann H., Gharabaghi F., Tran D. Role of respiratory viruses in pulmonary exacerbations in children with cystic fibrosis. J. Cyst. Fibros. 2012;11:433–439. doi: 10.1016/j.jcf.2012.04.006. - DOI - PMC - PubMed
    1. Browning M.J., Lim M.T.C., Kenia P., Whittle M., Doffinger R., Barcenas-Morales G., Kumararatne D., Viskaduraki M., O'Callaghan C., Gaillard E.A. Pneumococcal polysaccharide vaccine responses are impaired in a subgroup of children with cystic fibrosis. J. Cyst. Fibros. 2014;13:632–638. doi: 10.1016/j.jcf.2014.02.002. - DOI - PubMed
    1. de Almeida M.B., Zerbinati R.M., Tateno A.F., Oliveira C.M., Romão R.M., Rodrigues J.C., Pannuti C.S., da Silva Filho L.V.F. Rhinovirus C and respiratory exacerbations in children with cystic fibrosis. Emerg. Infect. Dis. 2010;16:996–999. - PMC - PubMed
    1. Dijkema J.S., van Ewijk B.E., Wilbrink B., Wolfs T.F.W., Kimpen J.L.L., van der Ent C.K. Frequency and duration of Rhinovirus infections in children with cystic fibrosis and healthy controls: a longitudinal cohort study. Pediatr. Infect. Dis. J. 2016;35:379–383. doi: 10.1097/INF.0000000000001014. - DOI - PubMed
    1. Dowaikh H., Morfin-Sherpa F., Reix P. Acute chest pain in an adolescent with cystic fibrosis in September: would you have thought about this? Pediatr. Pulmonol. 2017;52:E70–E72. doi: 10.1002/ppul.23746. - DOI - PubMed

LinkOut - more resources