

Global nitrogen input on wetland ecosystem: The driving mechanism of soil labile carbon and nitrogen on greenhouse gas emissions
- PMID: 36157707
- PMCID: PMC9488104
- DOI: 10.1016/j.ese.2020.100063
Global nitrogen input on wetland ecosystem: The driving mechanism of soil labile carbon and nitrogen on greenhouse gas emissions
Abstract
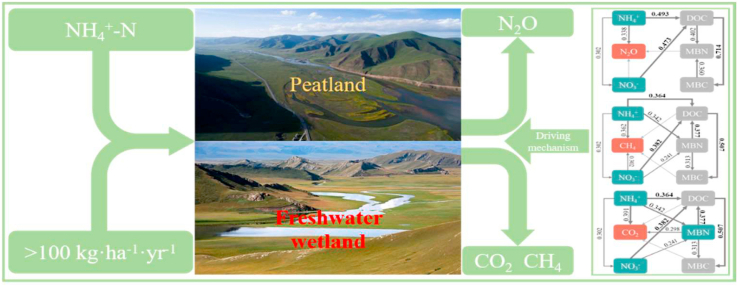
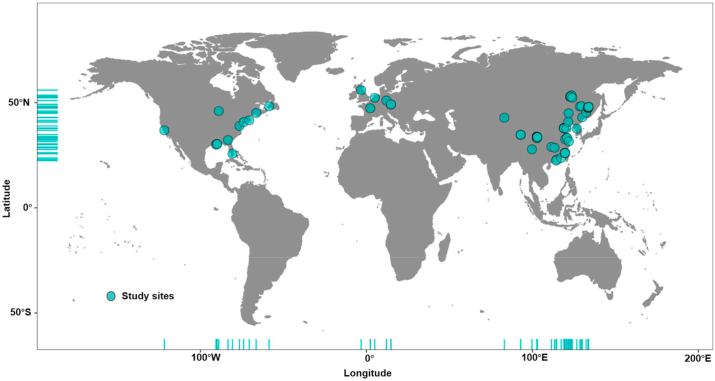
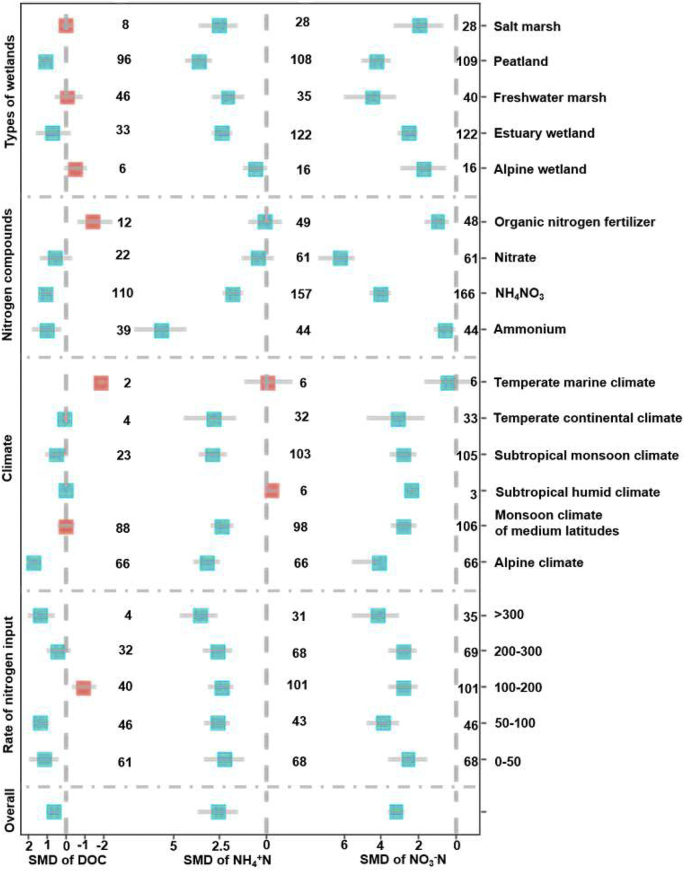
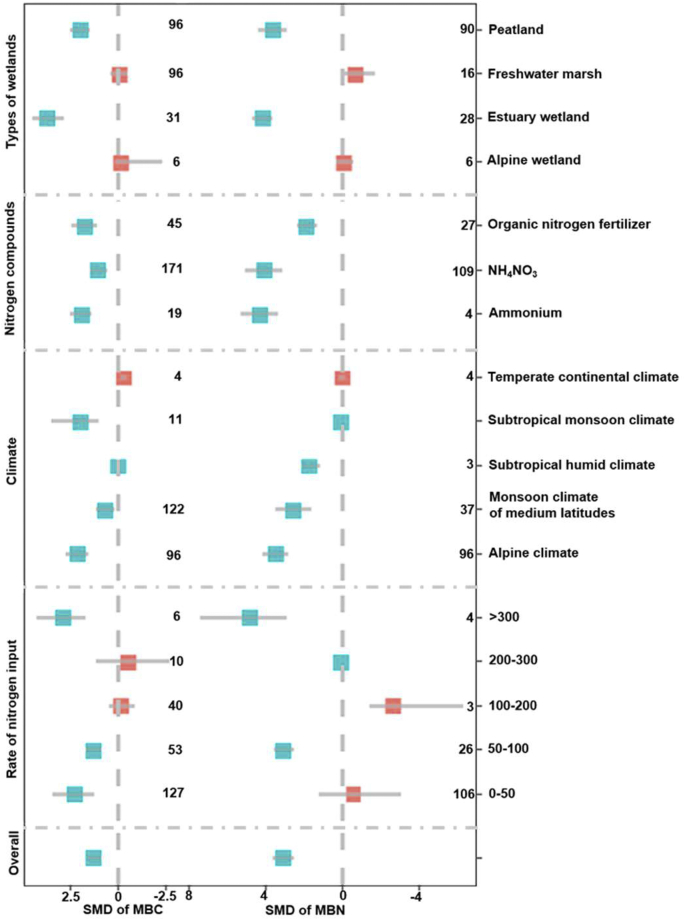
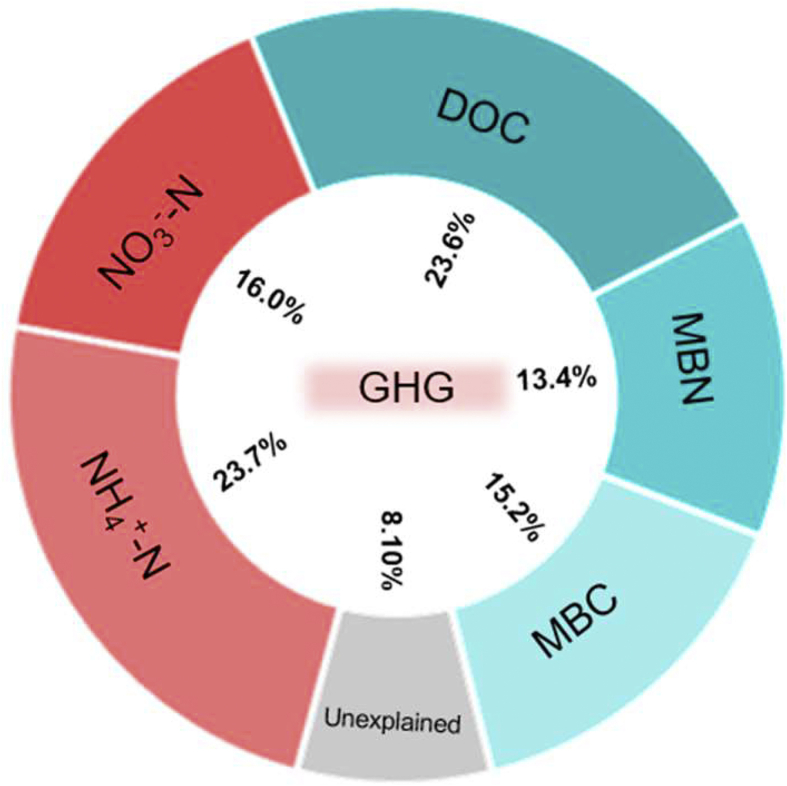
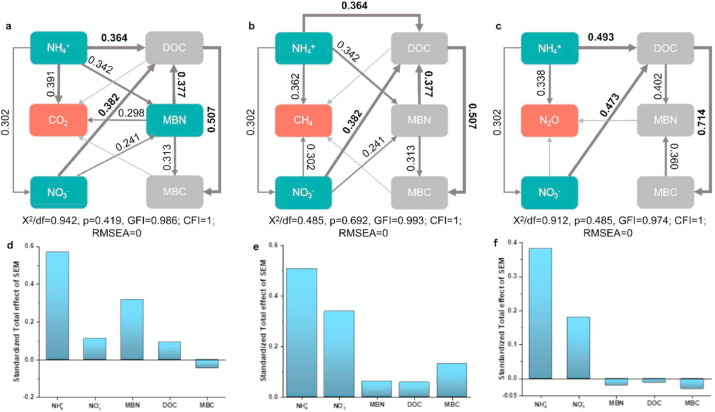
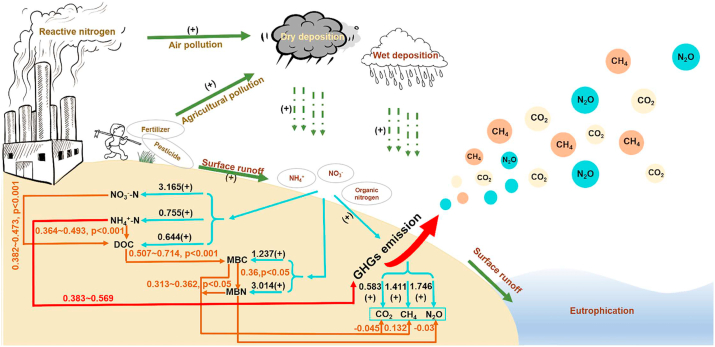
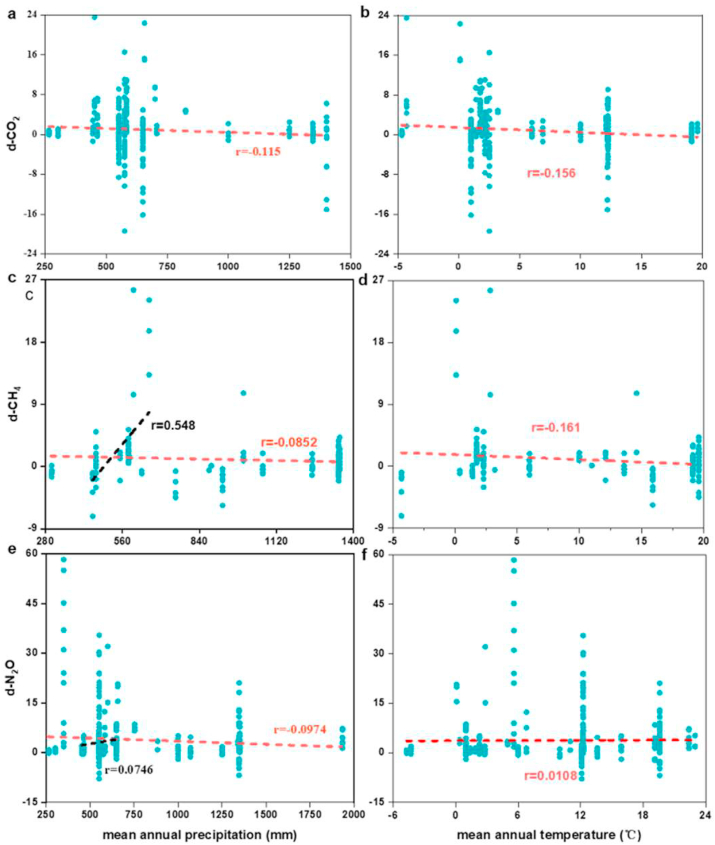
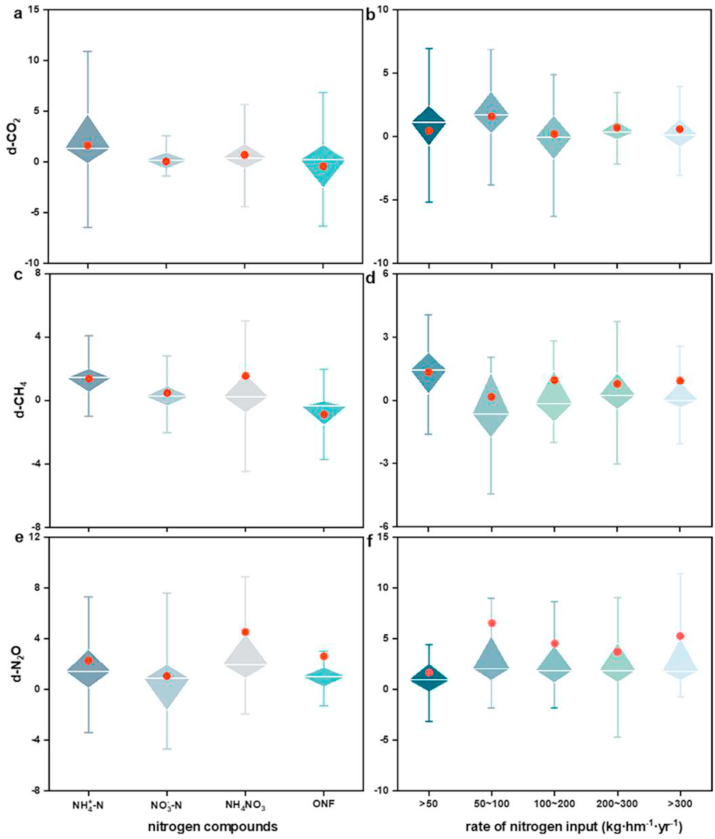
Greenhouse gas emissions from wetlands are significantly promoted by global nitrogen input for changing the rate of soil carbon and nitrogen cycling, and are substantially affected by soil labile carbon and nitrogen conversely. However, the driving mechanism by which soil labile carbon and nitrogen affect greenhouse gas emissions from wetland ecosystems under global nitrogen input is not well understood. Working out the driving factor of nitrogen input on greenhouse gas emissions from wetlands is critical to reducing global warming from nitrogen input. Thus, we synthesized 72 published studies (2144 paired observations) of greenhouse gas fluxes and soil labile compounds of carbon and nitrogen (ammonium, nitrate, dissolved organic carbon, soil microbial biomass nitrogen and carbon), to understand the effects of labile carbon and nitrogen on greenhouse gas emissions under global nitrogen input. Across the data set, nitrogen input significantly promoted carbon dioxide, methane and nitrous oxide emissions from wetlands. In particular, at lower nitrogen rates (<100 kg ha-1·yr-1) and with added ammonium compounds, freshwater wetland significantly promoted carbon dioxide and methane emissions. Peatland was the largest nitrous oxide source under these conditions. This meta-analysis also revealed that nitrogen input stimulated dissolved organic carbon, ammonium, nitrate, microbial biomass carbon and microbial biomass nitrogen accumulation in the wetland ecosystem. The variation-partitioning analysis and structural equation model were used to analyze the relationship between the greenhouse gas and labile carbon and nitrogen further. These results revealed that dissolved organic carbon (DOC) is the primary factor driving greenhouse gas emission from wetlands under global nitrogen input, whereas microbial biomass carbon (MBC) more directly affects greenhouse gas emission than other labile carbon and nitrogen.
Keywords: Fertilization; Greenhouse gas; Nitrogen deposition; Soil labile compounds; Wetland.
© 2020 The Authors.
Conflict of interest statement
The authors declare that they have no known competing financial interests or personal relationships that could have appeared to influence the work reported in this paper.
Figures

References
-
- Galloway J.N., Dentener F.J., Capone D.G., Boyer E.W., Howarth R.W., Seitzinger S.P., Asner G.P., Cleveland C.C., Green P.A., Holland E.A., Karl D.M., Michaels A.F., Porter J.H., Townsend A.R., Vorosmarty C.J. Nitrogen cycles: past, present, and future. Biogeochemistry. 2004;70(2):153–226. doi: 10.1007/s10533-004-0370-0. - DOI
-
- Song C., Liu D., Song Y., Mao R. Effect of nitrogen addition on soil organic carbon in freshwater marsh of Northeast China. Environ. Earth Sci. 2013;70(4):1653–1659. doi: 10.1007/s12665-013-2252-z. - DOI
-
- Yamamoto A., Akiyama H., Nakajima Y., Hoshino Y.T. Estimate of bacterial and fungal N2O production processes after crop residue input and fertilizer application to an agricultural field by N-15 isotopomer analysis. Soil Biol. Biochem. 2017;108:9–16. doi: 10.1016/j.soilbio.2017.01.015. - DOI
-
- Tao B., Wang Y., Yu Y., Li Q., Luo C., Zhang B. Interactive effects of nitrogen forms and temperature on soil organic carbon decomposition in the coastal wetland of the Yellow River Delta, China. Catena. 2018;165:408–413. doi: 10.1016/j.catena.2018.02.025. - DOI
Publication types
LinkOut - more resources
Full Text Sources
Research Materials
