. 2022 Sep 9:10:958566.
doi: 10.3389/fcell.2022.958566. eCollection 2022.

Perilipin-2 promotes lipid droplet-plasma membrane interactions that facilitate apocrine lipid secretion in secretory epithelial cells of the mouse mammary gland

Affiliations

Perilipin-2 promotes lipid droplet-plasma membrane interactions that facilitate apocrine lipid secretion in secretory epithelial cells of the mouse mammary gland

Jenifer Monks et al. Front Cell Dev Biol. .

Abstract

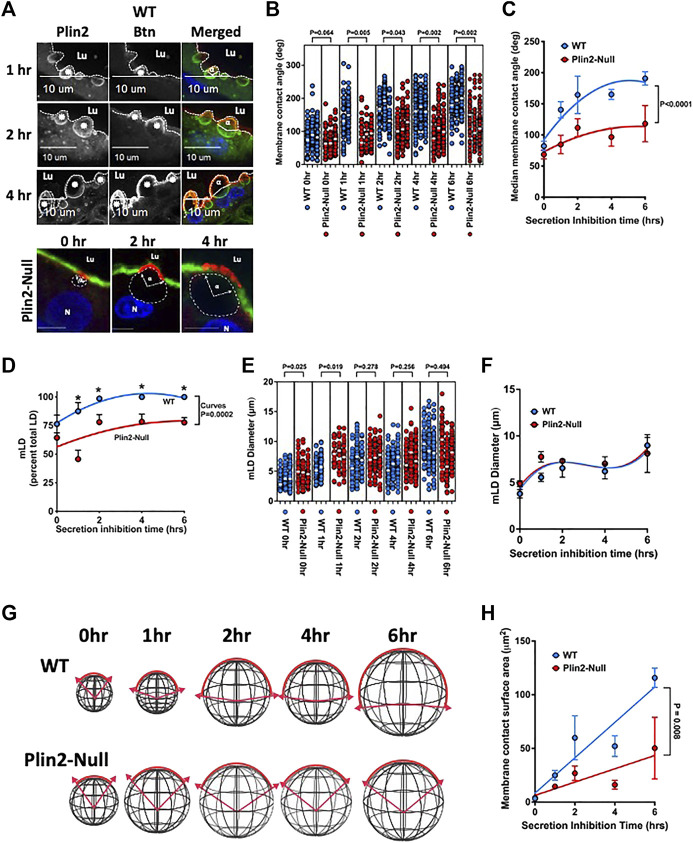
Secretory epithelial cells (sMEC) in mammary glands of lactating animals secrete lipids by a novel apocrine mechanism in which cytoplasmic lipid droplets (LD) contact and are enveloped by elements of the apical plasma membrane (APM) before being released into the lumen of the gland as membrane bound structures. The molecular properties of LD-APM contacts and the mechanisms regulating LD membrane envelopment and secretion are not fully understood. Perilipin-2 (Plin2) is a constitutive LD protein that has been proposed to tether LD to the APM through formation of a complex with the transmembrane protein, butyrophilin1a1 (BTN) and the redox enzyme, xanthine oxidoreductase (XOR). Using mice lacking Plin2 and physiological inhibition of apocrine lipid secretion, we demonstrate that LD-APM contact and envelopment are mechanistically distinct steps that they are differentially regulated by Plin2 and independent of LD secretion. We find that Plin2 is not required for formation of LD-APM contacts. However, it increases the percentage of LD that contact the APM and mediates enlargement of the LD-APM contact zone as LD undergo membrane envelopment. The effects of Plin2 LD-APM interactions are associated with increased abundances of BTN, XOR and Cidea, which are implicated as mediators of LD-APM contact formation, on membranes surrounding secreted LD, and with promotion of glycocalyx remodeling at LD-APM contact sites. We propose that Plin2 does not directly mediate contact between LD and the APM but acts by enhancing molecular interactions that stabilize LD-APM contacts and govern membrane envelopment of LD during apocrine lipid secretion. Plin2 does not appear to significantly affect the lipid content of milk in fully lactating animals, but it does increase lipid secretion at the onset of lactation in primaparous dams, which suggest a role in facilitating apocrine lipid secretion in sMEC during their initial transition to a secretory phenotype.

Keywords: apocrine secretion; lipid droplet; mammary gland; molecular interaction; perilipin 2/adipophilin; plasma membrane; secretory epithelium.


Conflict of interest statement

The authors declare that the research was conducted in the absence of any commercial or financial relationships that could be construed as a potential conflict of interest.

Figures

FIGURE 1
FIGURE 1
LD-APM contacts. (A) Electron tomograms from mammary glands of WT and Plin2-Null dams at L10. Left panels show lower magnification images of mammary alveoli, the box outlines contact between a LD and the apical membrane that is further magnified in insets and subsequent images in the middle and right panels. Red arrowheads in the right panels indicate LD-APM contact zones. Scale bars are indicated in each panel. (B) Mammary alveoli from WT and Plin2-Null mammary glands at L10 immunostained for Cidea (green) to identify LD and with Alexa594-WGA (red) to identify the apical plasma membrane (APM). Left panels show LD contacting the APM (asterisks). LD-APM contact sites are identified by Cidea concentration at the APM (white arrows). Right panels are higher magnification images of LD-APM contacts (white arrows) in WT and Plin2-Null sMEC showing membrane contact angles (α). Scale bars = 10 µm. (C) LD-APM contact angles quantified in sMEC from 20–40 randomly selected mammary alveoli from 3 WT (blue) and Plin2-Null (red) dams. Horizontal bars indicate median membrane contact angles. Average median membrane contact angles ±SEM are shown above each group. p value for group differences determined by nested t test is shown at the top of figure. (D) Histogram showing size distributions of membrane contact angles for each genotype. (E) Diameters of LD contacting the APM (mLD) in sMEC from 20–40 randomly selected mammary alveoli from 3 WT and Plin2-Null dams. Horizontal bars indicate median diameters. Average median mLD diameters ±SEM are shown above each group. p-values for group differences were determined by nested t-test and are shown at the top of figure. (F) Histogram showing the mLD size distribution for each genotype. (G) Percentage of LD contacting the APM. Values are averages ±SEM from sMEC in 20–40 randomly selected alveoli from 3 WT and Plin2-Null dams. p-values were determined by Students t-test.
FIGURE 2
FIGURE 2
LD-APM envelopment. (A) Immunofluorescence images showing time-dependent expansion of LD-APM contacts following the inhibition of apocrine lipid secretion in sMEC from WT and Plin2-NULL mammary glands. Sections from WT cells immunostained for Plin2 (green in merged panels) and BTN (red in merged panels) to identify LD (asterisks) and LD-APM contacts respectively. LD-APM contact angles (α) are indicated in merged panels. Apical borders are indicated by the dotted line, luminal space is labeled (Lu) and scale bars are indicated. Sections from Plin2-Null glands were stained for BTN (red) and Alexa488-labled WGA to identify LD-APM contact sites and apical borders respectively. LD in these images were localized by autofluorescence and outlined by dashed lines. LD-APM contact angles (α), luminal space (Lu) and nuclei (N) are labeled. Scale bars are 10 µm. (B) Changes in LD-APM contact angles in WT and Plin2-Null sMEC following secretion inhibition. LD-APM contact angles were quantified in sMEC from 20–40 randomly selected mammary alveoli from 3 WT and Plin2-Null dams at each time point, except 1h in which measurements were from 2 WT to 3 Plin2-Null dams. White bars indicate median membrane contact angles. p values for group differences were determined by nested t-test and are shown above each comparison. (C) Curves describing changes in median LD-APM contact angles following inhibition were generated using centered second order polynomial least-squares-fit (Prism 9.3.1). Values are means ± SEM (N = 3, 60–80 alveoli/dam). p value corresponds to differences between curves determined by extra sum-of-squares F test. (D) The percentage of LD contacting the APM (mLD) following secretion inhibition in WT and Plin2-Null dams. Curves were generated using centered second order polynomial least-squares-fit (Prism 9.3.1). Values are averages ±SEM (N = 3, 60–80 alveoli/dam). p value corresponds to differences between curves determined by extra sum-of-squares F test. (E) Effects of inhibiting secretion on mLD diameters from WT and Plin2-Null dams. mLD diameters were quantified in sMEC from 20–40 randomly selected mammary alveoli from 3 WT and Plin2-Null dams at each time point. White bars indicate median values. p values for group differences at each time point were determined by nested t-test and are shown above each comparison. (F) Curves describing effects of secretion inhibition time on median diameters of mLD were generated using centered third order polynomial least-squares-fit (Prism 9.3.1). Values are averages ±SEM (N = 3, 60–80 alveoli/dam). (G) Diagrams depicting how measured changes in LD diameters and LD-APM contact angles are projected to affect the extent LD-APM engagement in WT and Plin2-Null dams at 0, 1, 2, 4, or 6 h after inhibiting secretion. (H) Change in calculated membrane area contacting LD in WT and Plin2-Null dams as a function of time after inhibiting secretion. Curves were generated using linear least-squares-fit. p-values refer to differences in the slopes of the curves determined by extra sum-of-squares F test.
FIGURE 3
FIGURE 3
Milk fat globule membrane (MFGM) protein composition. (A) Volcano plots showing log2 fold change in normalized spectral abundance factor (NSAF) ratios for proteins in WT and Plin2-Null MFGM versus −log10 of their q-values, multiple unpaired t tests with FDR = 1%. For purposes of display, proteins present in WT MFGM but absent in Plin2-Null MFGM were assigned NSAF ratios of 1,000 (Log2 = 10). Proteins present in Plin2-Null MFGM but absent in WT MFGM were assigned NSAF ratios of 0.001 (Log2 = −10). Proteins with q-values ≤ 0.000001 are assigned values of 0.000001 (log10 = 6). WT enriched MFGM proteins are right and Plin2-Null enriched MFGM proteins are left of the vertical dotted line. Proteins found at LD-APM contact sites, BTN, XOR, Cidea and Plin2, are indicated by green diamond symbols. The horizontal line indicates q = 0.01. (B) STRING networks of proteins elevated (q > 0.01) in WT MFGM were identified using Cytoscape 3.9.1. Proteins forming a network with Plin2 include those implicated in formation of LD-APM contacts (XOR, BTN and Cidea) and Rab18 and FABP3. (C) Average ±SEM XOR:BTN and Cidea:BTN NSAF ratios in WT and Plin2-Null MFGM. Asterisk indicates p < 0.05, Students t-test. (D) Average ±SEM Rab18:BTN and Fabp3:BTN NSAF ratios in WT and Plin2-Null MFGM. Asterisk indicates p < 0.05, Students t-test. (E) STRING networks of proteins elevated (q < 0.01) in Plin2-Null MFGM are enriched in ER/chaperone and lipid metabolism proteins.
FIGURE 4
FIGURE 4
Molecular interactions at LD-APM contacts. Representative images of XOR (green/monochrome) or Cidea (green/monochrome) and BTN (red/monochrome) immunofluorescence (A) or Rab18 (green/monochrome) and BTN (red/monochrome) immunofluorescence (D) at LD-APM contacts in WT mammary glands following litter removal for 2 h at L10 to inhibit milk secretion. LD in images are indicated by asterisks and outlined by dotted white lines. Blue fluorescence in D is Alexa633-tagged wheatgerm agglutinin staining of the APM glycocalyx. Bar is 10 µ. (B,C,E) Pearson’s correlation coefficients describing immunofluorescence overlap between BTN and XOR (B), BTN and Cidea (C), or BTN and Rab18 (E) in 40–60 sMEC/animal from 3–4 WT and Plin2-Null dams following litter removal for 2 h at L10. Median values are indicated by white bars and average medians ±SEM are shown above each group. p-values for group differences were determined by nested t-test and are shown at the top of each figure. Pearson’s coefficients of 1, 0 and −1 respectively represent perfect positive correlation (Corr), no correlation (Uncorr.) and perfect negative correlation (Anti-corr.).
FIGURE 5
FIGURE 5
Glycocalyx remodeling at LD-APM contacts. (A) Representative 3D-projection images of mammary gland sections prepared from WT or Plin2-Null dams following removal of their litters for 2 h at L10 to inhibit milk secretion. The sections were immunostained with antibodies to BTN and XOR to identify LD-APM contacts and with Alexa633-tagged WGA (fl-WGA) to identify the glycocalyx. The images show exclusion of fl-WGA (blue green) from a BTN and XOR positive APM domain in WT sMEC, and partial exclusion of fl-WGA from a BTN and XOR positive APM domain in a Plin2 sMEC. Scale bars are 2 µm. (B,C) Pearson’s correlation coefficients describing the overlap between fl-WGA and BTN (B) or XOR (C) in 40–60 sMEC/animal from WT and Plin2-Null dams prepared as described in (A). Median values are indicated by white bars and average medians ±SEM are shown above each group. p-values for group differences were determined by nested t-test and are shown at the top of each figure. Pearson’s coefficients of 1, 0 and −1 represent perfect correlation (Corr), no correlation (Uncorr.) and perfect negative correlation (Anti-corr.) respectively as shown in each figure.
FIGURE 6
FIGURE 6
Apocrine lipid secretion in primiparous mice. (A) Representative histological images of mammary alveoli from primiparous WT and Plin2-Null mice on lactation day 1 (L1). Alveolar lumens (Lu) of WT mice are extensively filled with MFG (black arrow heads) the structures of secreted milk lipids. In contrast, LD appear to be retained in the epithelium (back arrow) and MFG are present in limited numbers in alveolar lumens of Plin2-Null dams. (B) Histological quantitation of luminal MFG. The data show the percentage of WT (N = 5, blue) and Plin2-Null (N = 6, red) mammary alveoli scored as having >3 MFG (score = 2); two or fewer (score = 1) or 0 (score = 0) MFG in their lumens at L1. p values were calculated by Students t-test from the results of 6 random sections per dam. (C,D) Histochemical quantitation of luminal areas in alveoli in sections from WT and Plin2-Null mammary gland at L1 (C) and P19 (D). (E) Representative images of BTN (green/monochrome) and Cidea (red/monochrome) immunofluorescence in mammary glands of WT and Plin2-Null at P19. (F) Quantitation of LD diameters in mammary alveoli WT and Plin2-Null dams at P19. White bars are median values. Average median LD diameters are shown above each genotype. p-value of group differences was determined by nested t-test and is shown at the top of the figure.
FIGURE 7
FIGURE 7
Model of LD-APM interactions and proposed roles of Plin2 in apocrine lipid secretion. Apocrine lipid secretion is proposed to involve four distinct steps: (1) LD transport to the APM; (2) formation of LD-APM contacts mediated by interactions between BTN and XOR (and possibly Cidea) and stabilized by Plin2; (3) Plin2 regulated envelopment of APM-bound LD and glycocalyx remodeling; (4) oxytocin dependent secretion of APM-enveloped LD to form milk fat globules (MFG).

References

    1. Chong B. M., Russell T. D., Schaack J., Orlicky D. J., Reigan P., Ladinsky M., et al. (2011). The adipophilin C-terminus is a self-folding membrane binding domain that is important for milk lipid secretion. J. Biol. Chem. 286, 23254–23265. 10.1074/jbc.M110.217091 - DOI - PMC - PubMed
    1. Deng Y., Zhou C., Mirza A. H., Bamigbade A. T., Zhang S., Xu S., et al. (2021). Rab18 binds PLIN2 and ACSL3 to mediate lipid droplet dynamics. Biochim. Biophys. Acta. Mol. Cell Biol. Lipids 1866 (7), 158923. 10.1016/j.bbalip.2021.158923 - DOI - PubMed
    1. DePeters E. J., Hovey R. C. (2009). Methods for collecting milk from mice. J. Mammary Gland. Biol. Neoplasia 14 (4), 397–400. 10.1007/s10911-009-9158-0 - DOI - PMC - PubMed
    1. Dickow J. A., Larsen L. B., HaMMershojM., Wiking L. (2011). Cooling causes changes in the distribution of lipoprotein lipase and milk fat globule membrane proteins between the skim milk and cream phase. J. Dairy Sci. 94 (2), 646–656. 10.3168/jds.2010-3549 - DOI - PubMed
    1. Heid H. W., Keenan T. W. (2005). Intracellular origin and secretion of milk fat globules. Eur. J. Cell Biol. 84 (2-3), 245–258. 10.1016/j.ejcb.2004.12.002 - DOI - PubMed