Pitx3 deficiency promotes age-dependent alterations in striatal medium spiny neurons
- PMID: 36158557
- PMCID: PMC9490232
- DOI: 10.3389/fnagi.2022.960479
Pitx3 deficiency promotes age-dependent alterations in striatal medium spiny neurons
Abstract
Background: The classical motor symptoms of Parkinson's disease (PD) are tightly linked to the gradual loss of dopamine within the striatum. Concomitantly, medium spiny neurons (MSNs) also experience morphological changes, such as reduced dendritic complexity and spine density, which may be potentially associated with motor dysfunction as well. Thus, MSNs may serve as the emerging targets for PD therapy besides the midbrain dopaminergic neurons.
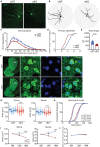
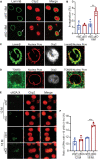
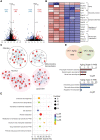
Results: To comprehensively examine pathological alterations of MSNs longitudinally, we established a TH Cre/ Pitx3 fl/fl (Pitx3cKO ) mouse model that developed canonical PD features, including a significant loss of SNc DAergic neurons and motor deficits. During aging, the targeted neurotransmitter, MSNs morphology and DNA methylation profile were significantly altered upon Pitx3 deficiency. Specifically, dopamine, GABA and glutamate decreased in the model at the early stage. While nuclear, soma and dendritic atrophy, as well as nuclear invaginations increased in the aged MSNs of Pitx3cko mice. Furthermore, more nuclear DNA damages were characterized in MSNs during aging, and Pitx3 deficiency aggravated this phenomenon, together with alterations of DNA methylation profiling associated with lipoprotein and nucleus pathway at the late stage.
Conclusion: The early perturbations of the neurotransmitters within MSNs may potentially contribute to the alterations of metabolism, morphology and epigenetics within the striatum at the late stage, which may provide new perspectives on the diagnosis and pathogenesis of PD.
Keywords: DNA methylation; Parkinson’s disease; aging; medium spiny neurons; neuronal morphology.
Copyright © 2022 Chen, Yang, Shao, Kim, Wang, Wang, Wu, Xu and Le.
Conflict of interest statement
The authors declare that the research was conducted in the absence of any commercial or financial relationships that could be construed as a potential conflict of interest.
Figures


Similar articles
-
Differential Synaptic Remodeling by Dopamine in Direct and Indirect Striatal Projection Neurons in Pitx3-/- Mice, a Genetic Model of Parkinson's Disease.J Neurosci. 2018 Apr 11;38(15):3619-3630. doi: 10.1523/JNEUROSCI.3184-17.2018. Epub 2018 Feb 26. J Neurosci. 2018. PMID: 29483281 Free PMC article.
-
Remodeling of the dendritic structure of the striatal medium spiny neurons accompanies behavioral recovery in a mouse model of Parkinson's disease.Neurosci Lett. 2013 Dec 17;557 Pt B:95-100. doi: 10.1016/j.neulet.2013.10.049. Epub 2013 Oct 28. Neurosci Lett. 2013. PMID: 24176882
-
The essential role of transcription factor Pitx3 in preventing mesodiencephalic dopaminergic neurodegeneration and maintaining neuronal subtype identities during aging.Cell Death Dis. 2021 Oct 27;12(11):1008. doi: 10.1038/s41419-021-04319-x. Cell Death Dis. 2021. PMID: 34707106 Free PMC article.
-
Differential striatal spine pathology in Parkinson's disease and cocaine addiction: a key role of dopamine?Neuroscience. 2013 Oct 22;251:2-20. doi: 10.1016/j.neuroscience.2013.07.011. Epub 2013 Jul 16. Neuroscience. 2013. PMID: 23867772 Free PMC article. Review.
-
Striatal plasticity in parkinsonism: dystrophic changes in medium spiny neurons and progression in Parkinson's disease.J Neural Transm Suppl. 2006;(70):67-70. doi: 10.1007/978-3-211-45295-0_12. J Neural Transm Suppl. 2006. PMID: 17017511 Review.
Cited by
-
The Crucial Roles of Pitx3 in Midbrain Dopaminergic Neuron Development and Parkinson's Disease-Associated Neurodegeneration.Int J Mol Sci. 2023 May 11;24(10):8614. doi: 10.3390/ijms24108614. Int J Mol Sci. 2023. PMID: 37239960 Free PMC article. Review.
-
The inflammatory injury in the striatal microglia-dopaminergic-neuron crosstalk involved in Tourette syndrome development.Front Immunol. 2023 Apr 28;14:1178113. doi: 10.3389/fimmu.2023.1178113. eCollection 2023. Front Immunol. 2023. PMID: 37187752 Free PMC article.
-
Machine learning for classification of pediatric bipolar disorder with and without psychotic symptoms based on thalamic subregional structural volume.BMC Psychiatry. 2025 Jun 3;25(1):574. doi: 10.1186/s12888-025-07018-5. BMC Psychiatry. 2025. PMID: 40462037 Free PMC article.
-
The nuclear envelope and nuclear pore complexes in neurodegenerative diseases.Front Cell Dev Biol. 2025 May 13;13:1550859. doi: 10.3389/fcell.2025.1550859. eCollection 2025. Front Cell Dev Biol. 2025. PMID: 40433544 Free PMC article. Review.
References
-
- Calabresi P., Mercuri N. B., Sancesario G., Bernardi G. (1993). Electrophysiology of dopaminedenervated striatal neurons. Implications for Parkinson’s disease. Brain 116, 433–52. - PubMed
LinkOut - more resources
Full Text Sources

