. 2022 Aug 24:29:803-822.
doi: 10.1016/j.omtn.2022.08.028. eCollection 2022 Sep 13.

MicroRNA-dependent inhibition of WEE1 controls cancer stem-like characteristics and malignant behavior in ovarian cancer

Affiliations

MicroRNA-dependent inhibition of WEE1 controls cancer stem-like characteristics and malignant behavior in ovarian cancer

Jin Gu Cho et al. Mol Ther Nucleic Acids. .

Abstract

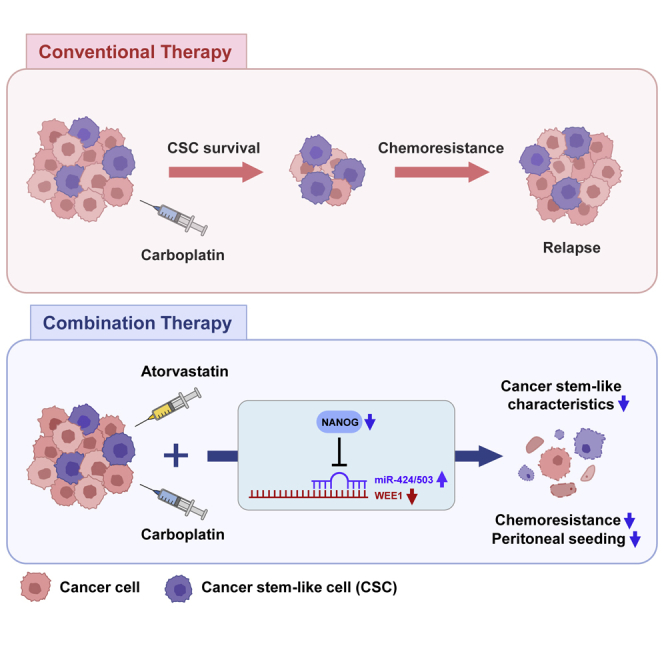
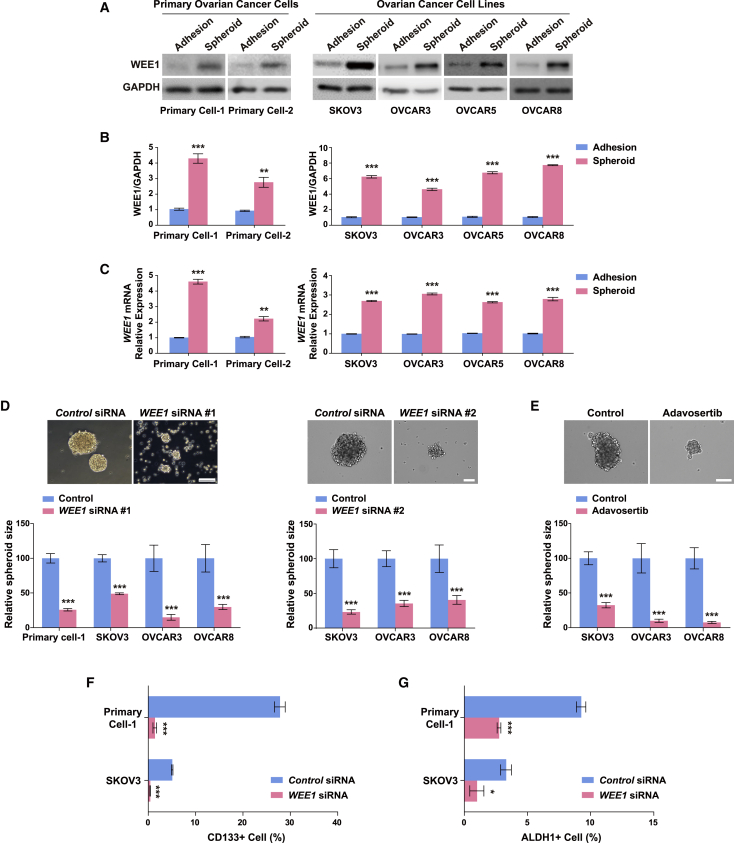
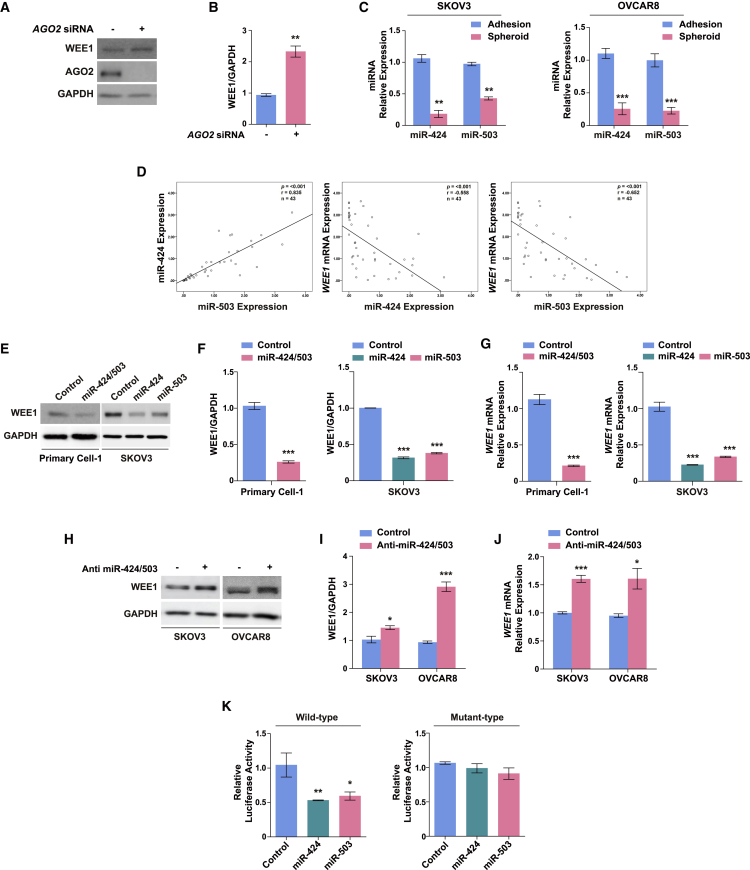
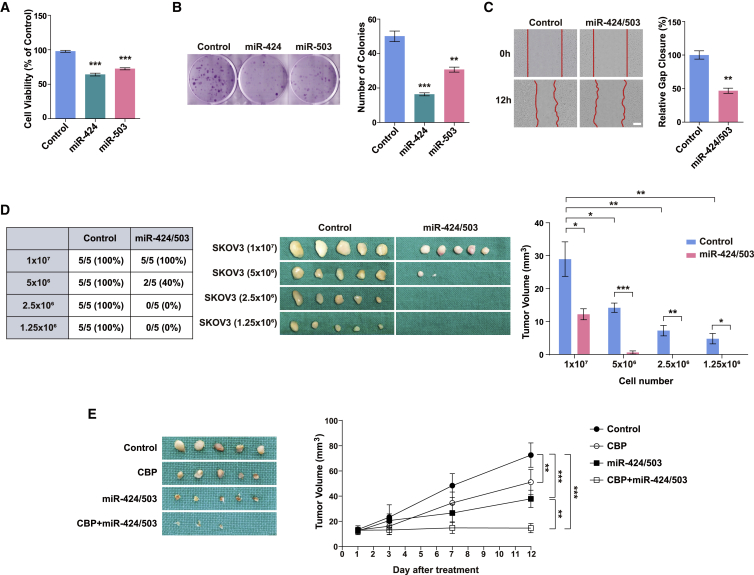
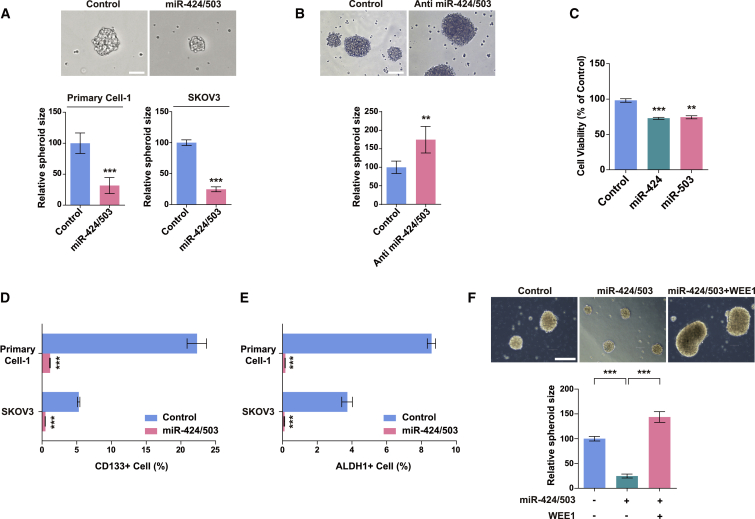
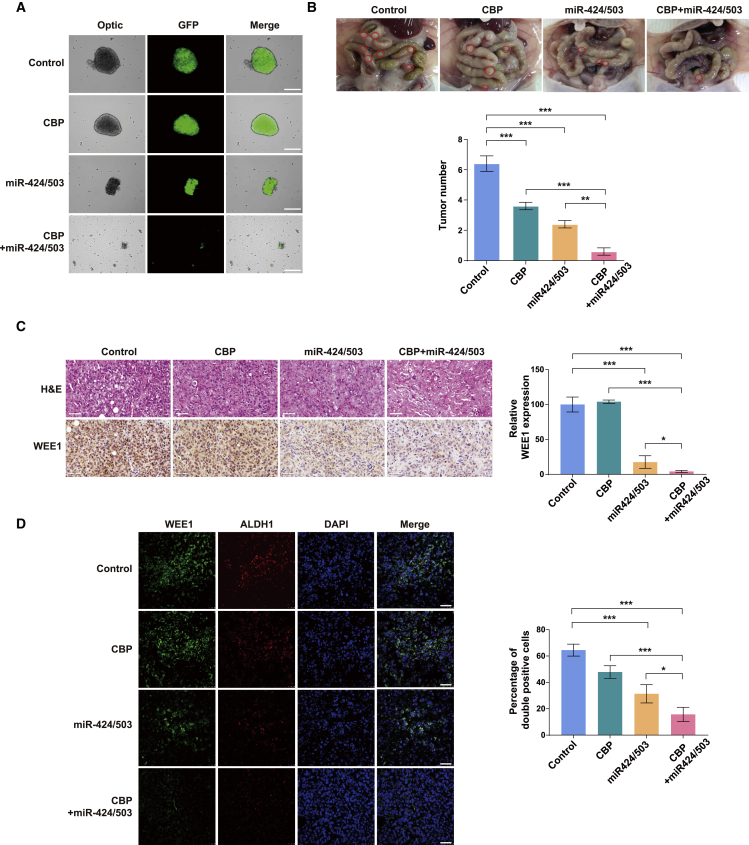
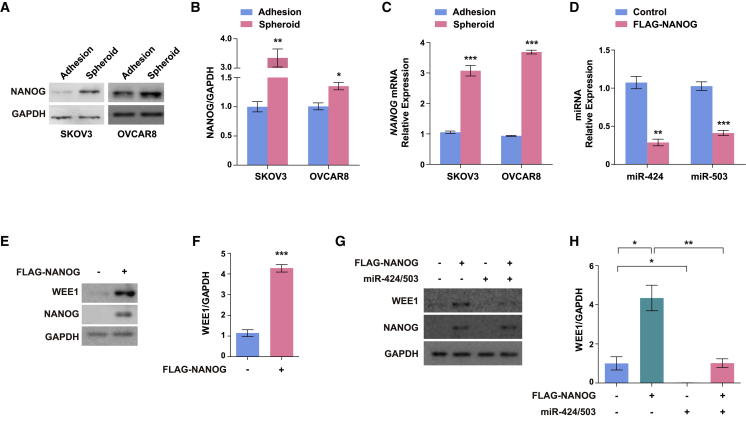
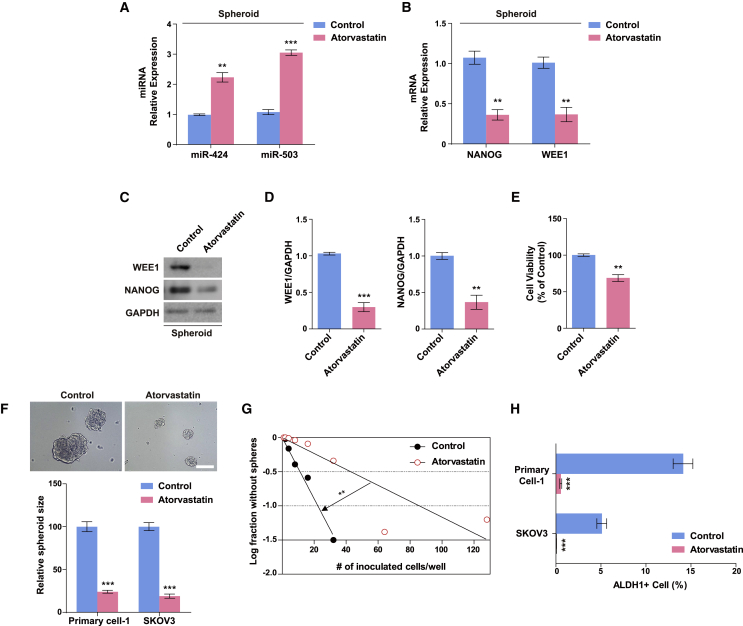
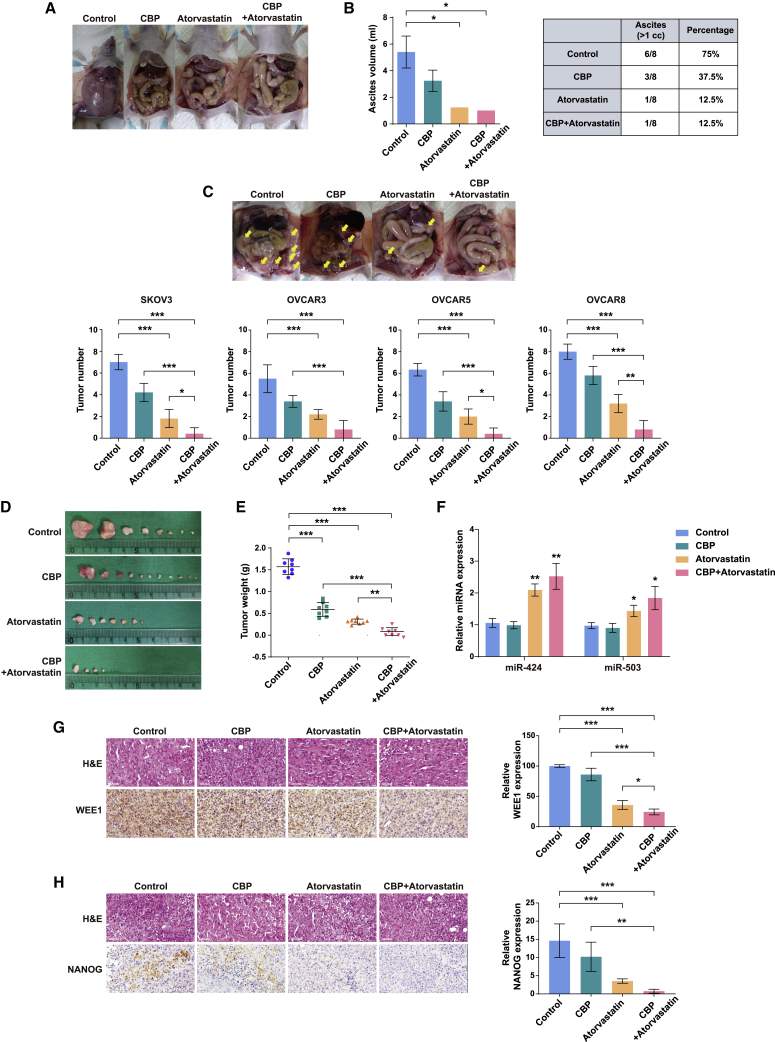
Cancer stem-like cells (CSCs) have been suggested to be responsible for chemoresistance and tumor recurrence owing to their self-renewal capacity and differentiation potential. Although WEE1 is a strong candidate target for anticancer therapies, its role in ovarian CSCs is yet to be elucidated. Here, we show that WEE1 plays a key role in regulating CSC properties and tumor resistance to carboplatin via a microRNA-dependent mechanism. We found that WEE1 expression is upregulated in ovarian cancer spheroids because of the decreased expression of miR-424 and miR-503, which directly target WEE1. The overexpression of miR-424/503 suppressed CSC activity by inhibiting WEE1 expression, but this effect was reversed on the restoration of WEE1 expression. Furthermore, we demonstrated that NANOG modulates the miR-424/503-WEE1 axis that regulates the properties of CSCs. We also demonstrated the pharmacological restoration of the NANOG-miR-424/503-WEE1 axis and attenuation of ovarian CSC characteristics in response to atorvastatin treatment. Lastly, miR-424/503-mediated WEE1 inhibition re-sensitized chemoresistant ovarian cancer cells to carboplatin. Additionally, combined treatment with atorvastatin and carboplatin synergistically reduced tumor growth, chemoresistance, and peritoneal seeding in the intraperitoneal mouse models of ovarian cancer. We identified a novel NANOG-miR-424/503-WEE1 pathway for regulating ovarian CSCs, which has potential therapeutic utility in ovarian cancer treatment.

Keywords: MT: Non-coding RNAs; NANOG; WEE1; atorvastatin; carboplatin; chemoresistance; microRNA-424; microRNA-503; ovarian cancer; ovarian cancer spheroids; ovarian cancer stem-like cell.


Conflict of interest statement

The authors declare no competing interests.

Figures

None
Graphical abstract
Figure 1
Figure 1
WEE1 upregulation in ovarian cancer spheroids regulates cancer stem cell-like properties Comparison of WEE1 protein (A and B) and mRNA (C) expression in adherent and spheroid cultures of various ovarian cancer cell lines and primary ovarian cancer cells. (D) Representative images of spheroids after WEE1 knockdown in SKOV3 cells. The sizes of spheroids in primary ovarian tumor cells and various ovarian cancer cell lines (SKOV3, OVACAR3, and OVCAR8) after WEE1 knockdown. Scale bars: 100 μm. (E) Representative images of SKOV3 spheroids after treatment with 200 nM adavosertib. The sizes of the spheroids formed from SKOV3, OVACAR3, and OVCAR8 cells treated with 200 nM adavosertib were significantly smaller compared with the control. Scale bar: 100 μm. Fluorescence-activated cell sorting analysis of the CD133+ (F) and ALDH1+ (G) population in primary ovarian cancer cells and SKOV3 cells after WEE1 knockdown. ∗p < 0.05, ∗∗p < 0.01, ∗∗∗p < 0.001 for comparisons indicated by unpaired two-tailed Student’s t test. Error bars, standard error of the mean.
Figure 2
Figure 2
miR-424 and miR-503 directly target WEE1 in ovarian cancer cells (A and B) WEE1 protein expression after AGO2 siRNA transfection in SKOV3 cells. (C) Mature miR-424 and miR-503 expression in SKOV3 and OVCAR8 adherent cells and spheroids. (D) Linear correlation between miR-424 and miR-503 expression. Inverse correlation between WEE1 mRNA expression and miR-424/miR-503 expression in ovarian tumor tissues. Relationships between variables were determined by the Pearson correlation coefficient. WEE1 protein (E and F) and mRNA (G) expression in response to the overexpression of miR-424, miR-503, or both (miR-424/503) in primary ovarian cancer cells and SKOV3 cells. (H–J) WEE1 protein and mRNA expression after transfection with anti-miR-424/503 in SKOV3 and OVCAR8 cells. (K) Targeting of the WEE1 3′ untranslated region (UTR) via miR-424 and miR-503 overexpression in SKOV3 cells. Luciferase activity data for constructs with the wild-type and mutant 3′ UTR constructs are shown. ∗p < 0.05, ∗∗p < 0.01, ∗∗∗p < 0.001 compared with controls by unpaired two-tailed Student’s t test or one-way analysis of variance (ANOVA) with Bonferroni’s multiple comparison test. Error bars, standard error of the mean.
Figure 3
Figure 3
miR-424 and miR-503 act as tumor suppressors in vitro and in vivo (A) Cell viability after the overexpression of miR-424 and miR-503 in adherent SKOV3 cells. (B) Colony formation was determined using crystal violet staining 14 days after the miR-424 and miR-503 overexpression in adherent SKOV3 cells. Representative images of the (C) migration assay after miR-424/503 overexpression in adherent SKOV3 cells. Scale bar: 200 μm. (D) Incidence and size of subcutaneous tumors in nude mice at 14 days after injection with control or miR-424/503-overexpressing SKOV3 cells. The graphs show significantly decreased tumor size in mice injected with miR-424/503-overexpressing cells compared with that in mice injected with control cells. ∗p < 0.05, ∗∗p < 0.01, ∗∗∗p < 0.001 compared with controls by unpaired two-tailed Student’s t test or two-way ANOVA with Bonferroni’s multiple comparison test. Error bars, standard error of the mean. (E) Therapeutic efficacy of lentivirus-expressing miR-424/503 on established xenografts compared with the Virus Scramble xenografts. ∗∗p < 0.01, ∗∗∗p < 0.001 by mixed model for repeated data with Bonferroni’s multiple comparison test.
Figure 4
Figure 4
miR-424 and miR-503 inhibit cancer stem cell-like properties in ovarian cancer cells The sizes of spheroids after the overexpression (A) or inhibition (B) of miR-424/503 in primary ovarian tumor cells and SKOV3 cells. Scale bars: 100 μm. (C) Cell viability after the overexpression of miR-424 and miR-503 in SKOV3 spheroids. (D and E) Fluorescence-activated cell sorting analysis of the CD133- and ALDH1+ subpopulation in primary ovarian cancer cells and SKOV3 cells after miR-424/503 overexpression. (F) Representative images of SKOV3 spheroids, and WEE1 protein expression levels after concurrent miR-424/503 and WEE1 overexpression. Scale bar: 250 μm. ∗∗p < 0.01, ∗∗∗p < 0.001 compared with controls by unpaired two-tailed Student’s t test or one-way ANOVA with Bonferroni’s multiple comparison test. Error bars, standard error of the mean.
Figure 5
Figure 5
Effect of miR-424/503 expression on the reduction of chemoresistance (A) Representative images of SKOV3 spheroids in the four different groups. miR-424/503 overexpression enhanced the dissociation of spheroids under carboplatin (CBP) treatment. Scale bar: 250 μm. (B) Representative images of the peritoneal cavities of mice at 4 weeks after implantation. Total tumor number graphs show decreased peritoneal metastasis in the CBP, miR-424/503, and CBP/miR-424/503 groups compared with the control group. The CBP/miR-424/503 significantly lowered the tumor number compared with the CBP or miR-424/503 group. Based on α = 0.05, the effect size of the four groups (n = 32) is 2.57, and the power is 0.99 or higher. ∗∗p < 0.01, ∗∗∗p < 0.001 by one-way ANOVA with Bonferroni’s multiple comparison test. (C) Hematoxylin and eosin staining and immunostaining for WEE1 in tumors from the four different groups. Scale bar: 50 μm. (D) Representative fluorescence profiles for ALDH1, WEE1, and ALDH1/WEE1 colocalization in the CBP, miR-424/503, and CBP/miR-424/503 groups compared with that in the control group. The graphs show significantly decreased fluorescence intensities for ALDH1, WEE1, and ALDH1/WEE1 (co-localization) in the miR-424/503 overexpression and miR-424/503 overexpression/carboplatin combination group compared with that in mice injected with control cells. Scale bar: 50 μm. ∗p < 0.05, ∗∗∗p < 0.001 by one-way ANOVA, with Bonferroni’s post hoc test.
Figure 6
Figure 6
NANOG upregulates WEE1 expression by downregulating miR-424 and miR-503 expression (A–C) Protein and mRNA levels of NANOG in SKOV3 and OVCAR8 adherent cells and spheroids. (D) Mature miR-424 and miR-503 expression in response to NANOG overexpression. (E and F) WEE1 protein expression in response to NANOG overexpression. (G and H) WEE1 protein expression in response to miR-424/503 overexpression with concurrent NANOG overexpression. ∗p < 0.05, ∗∗p < 0.01, ∗∗∗p < 0.001 compared with controls by unpaired two-tailed Student’s t test or one-way ANOVA with Bonferroni’s multiple comparison test. Error bars, standard error of the mean.
Figure 7
Figure 7
Atorvastatin regulates ovarian cancer stem cell-like properties by modulating the NANOG-miR-424/503-WEE1 axis in SKOV3 spheroids (A) Mature miR-424 and miR-503 expression in SKOV3 spheroids in response to treatment with 10 μM atorvastatin. NANOG and WEE1 mRNA (B) and protein (C and D) expression in SKOV3 spheroids in response to treatment with 10 μM atorvastatin. (E) Viability of SKOV3 spheroids after treatment with 10 μM atorvastatin for 24 h. (F) Representative images of SKOV3 spheroids after treatment with 10 μM atorvastatin. The sizes of the spheroids formed from SKOV3 cells treated with 10 μM atorvastatin were significantly smaller compared with the control. ∗∗p < 0.01, ∗∗∗p < 0.001 compared with controls by unpaired two-tailed Student’s t test (A–E). Error bars, standard error of the mean. (G) Limiting dilution assay showing the decreased self-renewal activity of SKOV3 spheroids in response to treatment with 10 μM atorvastatin. ∗∗p < 0.01 for groups (control, atorvastatin), cells/well, and groups × cells/well by two-way ANOVA with Bonferroni’s multiple comparison test. (H) Fluorescence-activated cell sorting analysis of ALDH1+ SKOV3 spheroids after treatment with 10 μM atorvastatin. Scale bar: 100 μm. ∗∗∗p < 0.001 compared with controls by unpaired two-tailed Student’s t test. Error bars, standard error of the mean.
Figure 8
Figure 8
Combined treatment with carboplatin and atorvastatin inhibited ovarian cancer in the ovarian cancer xenograft mouse model (A) Representative images of ascites development at 4 weeks after tumor implantation. (B) Graphs showing significantly decreased ascites development in the atorvastatin or atorvastatin/carboplatin (CBP) treatment groups compared with that in the CBP treatment group (n = 8) (measurement >1 cc). ∗p < 0.05 compared with controls by one-way ANOVA with Bonferroni’s multiple comparison test. Error bars, standard error of the mean. The standard deviation is zero because the number of cases is one in atorvastatin and atorvastatin/CBP groups. (C) Representative images of the peritoneal cavities of mice showing a reduction in peritoneal tumors in the CBP, atorvastatin, and atorvastatin/CBP groups compared with that in the control group and quantification of peritoneal metastases. (D and E) Comparative images and tumor weight analysis showed that the atorvastatin/CBP group had higher metastasis-suppressive ability than the CBP and atorvastatin groups. Based on α = 0.05, the effect size of the four groups (n = 32) is 4.35, and the power is 0.99 or higher. The sum of all visible tumor weights in each mouse was used as its tumor weight, and each point represents tumor volumes from eight mice. ∗∗p < 0.01, ∗∗∗p < 0.001 by one-way ANOVA with Bonferroni’s multiple comparison test. (F) Mature miR-424 and miR-503 expression in xenograft tumors for four groups. ∗p < 0.05, ∗∗p < 0.01 compared with controls by unpaired two-tailed Student’s t test. (G and H) Hematoxylin and eosin staining and immunostaining for WEE1 and NANOG in xenograft tumors for four groups. Scale bars: 50 μm. ∗p < 0.05, ∗∗p < 0.01, ∗∗∗p < 0.001 by one-way ANOVA with Bonferroni’s multiple comparison test.

References

    1. Sankaranarayanan R., Ferlay J. Worldwide burden of gynaecological cancer: the size of the problem. Best Pract. Res. Clin. Obstet. Gynaecol. 2006;20:207–225. - PubMed
    1. Ferlay J., Shin H.R., Bray F., Forman D., Mathers C., Parkin D.M. Estimates of worldwide burden of cancer in 2008: GLOBOCAN 2008. Int. J. Cancer. 2010;127:2893–2917. - PubMed
    1. Jung E., Koh D., Lim Y., Shin S.Y., Lee Y.H. Overcoming multidrug resistance by activating unfolded protein response of the endoplasmic reticulum in cisplatin-resistant A2780/CisR ovarian cancer cells. BMB Rep. 2020;53:88–93. - PMC - PubMed
    1. Steg A.D., Bevis K.S., Katre A.A., Ziebarth A., Dobbin Z.C., Alvarez R.D., Zhang K., Conner M., Landen C.N. Stem cell pathways contribute to clinical chemoresistance in ovarian cancer. Clin. Cancer Res. 2012;18:869–881. - PMC - PubMed
    1. Bapat S.A., Mali A.M., Koppikar C.B., Kurrey N.K. Stem and progenitor-like cells contribute to the aggressive behavior of human epithelial ovarian cancer. Cancer Res. 2005;65:3025–3029. - PubMed