. 2022 Aug 24:29:862-870.
doi: 10.1016/j.omtn.2022.08.030. eCollection 2022 Sep 13.

FASTAptameR 2.0: A web tool for combinatorial sequence selections

Affiliations

FASTAptameR 2.0: A web tool for combinatorial sequence selections

Skyler T Kramer et al. Mol Ther Nucleic Acids. .

Abstract

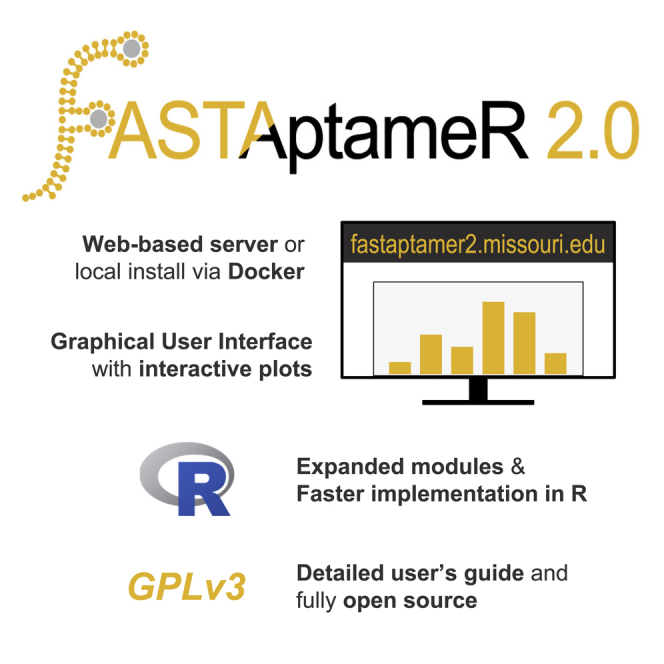
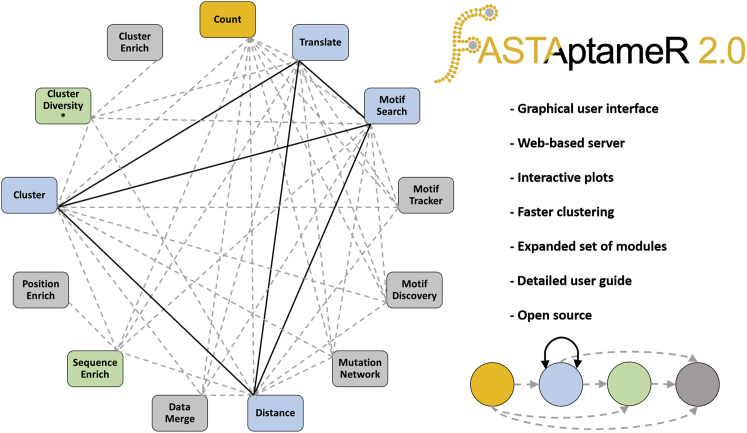
Combinatorial selections are powerful strategies for identifying biopolymers with specific biological, biomedical, or chemical characteristics. Unfortunately, most available software tools for high-throughput sequencing analysis have high entrance barriers for many users because they require extensive programming expertise. FASTAptameR 2.0 is an R-based reimplementation of FASTAptamer designed to minimize this barrier while maintaining the ability to answer complex sequence-level and population-level questions. This open-source toolkit features a user-friendly web tool, interactive graphics, up to 100 times faster clustering, an expanded module set, and an extensive user guide. FASTAptameR 2.0 accepts diverse input polymer types and can be applied to any sequence-encoded selection.

Keywords: MT: Bioinformatics; Next-generation sequencing; SELEX; aptamer; combinatorial selection; directed evolution; phage display; ribozyme; sequence analysis; synthetic biology.


Conflict of interest statement

The authors declare no competing interests.

Figures

None
Graphical abstract
Figure 1
Figure 1
General overview, module connectivity, and major new features of FASTAptameR 2.0 The gold node (the Count module) is the required first step of every user-customized workflow. Blue nodes (such as the Distance module) are either intermediate or final steps of workflows. Gray nodes (such as the Motif Tracker module) are final steps of workflows, and green nodes (such as the Sequence Enrich module) exclusively feed into gray nodes. Solid black edges are bidirectional, whereas dashed gray edges are unidirectional. The asterisk with the Cluster Diversity module is to indicate that the population must be clustered at some step before its use. Most module outputs are downloadable as FASTA, CSV, or both.
Figure 2
Figure 2
Example plots in a Cluster module workflow, using the 70HRT14 population as an example (A) This line plot of the relationship between sequence rank and abundance (from the Count module) suggests that the population is dominated by a few sequences (convergence) due to its relatively steep slope and the magnitude of the y axis. (B) These histograms of LEDs suggest that many sequences in this population are similar to its most abundant sequence and that the region of sequence space surrounding the most abundant sequence is well-sampled, which can indicate biochemical significance. For the top plot, each unique sequence is equally weighted, whereas each unique sequence in the bottom plot is weighted by abundance. (C) A 3-mer matrix was generated from clustered sequences and visualized as a PCA plot where colors correspond to clusters.
Figure 3
Figure 3
Cluster and position enrichment plots (A) The cluster boxplot showing how clustered sequences in 70HRT14 enrich in 70HRT15. Cluster 2 of 70HRT14, for example, is highly enriched in 70HRT15 due to the presence of the F1Pk, which is implicated in target binding to HIV-1 RT. The 25th and 75th quartiles are respectively represented by the bottom and top of each box. The line in the middle of the box represents the median. Whiskers are at most 1.5 ∗ IQR (interquartile range), and any points beyond that are shown as outliers. The red marker indicates where the seed sequence of the cluster falls. (B) The x axis of the bar plot also shows the user-defined reference sequence, and the y axis shows the average enrichment of each non-reference residue at each position. The red text below this panel shows the portion of the query sequence that matches the linear F1Pk motif. Black horizontal lines show the left-inclusive average enrichment score of each user-defined region. The regions corresponding to the F1Pk motif have the lowest regional average of enrichment scores, indicating the importance of this motif for this selection experiment. (C) The x axis of the heatmap shows the user-defined reference sequence, and the y axis shows all possible residues at each position. Colors depict the average enrichment of each possible non-reference residue. (D) The experimentally determined secondary structure of the F1Pk motif.

References

    1. Gibney E., Van Noorden R., Ledford H., Castelvecchi D., Warren M. ’Test-tube’ evolution wins chemistry nobel prize. Nature. 2018;562:176. - PubMed
    1. Strack R. Noncanonical amino acids on display. Nat. Methods. 2020;17:461. - PubMed
    1. Yang Z., Chen F., Chamberlin S.G., Benner S.A. Expanded genetic alphabets in the polymerase chain reaction. Angew. Chem. Int. Ed. Engl. 2010;49:177–180. - PMC - PubMed
    1. Hoshika S., Leal N.A., Kim M.-J., Kim M.-S., Karalkar N.B., Kim H.-J., Bates A.M., Watkins N.E., SantaLucia H.A., Meyer A.J., et al. Hachimoji DNA and RNA: a genetic system with eight building blocks. Science. 2019;363:884–887. - PMC - PubMed
    1. Hwang G.T., Romesberg F.E. Unnatural substrate repertoire of a, b, and x family DNA polymerases. J. Am. Chem. Soc. 2008;130:14872–14882. - PMC - PubMed

LinkOut - more resources