. 2022 Sep 9:12:966361.
doi: 10.3389/fcimb.2022.966361. eCollection 2022.

Gut and oral microbiota associations with viral mitigation behaviors during the COVID-19 pandemic

Affiliations

Gut and oral microbiota associations with viral mitigation behaviors during the COVID-19 pandemic

Kelvin Li et al. Front Cell Infect Microbiol. .

Abstract

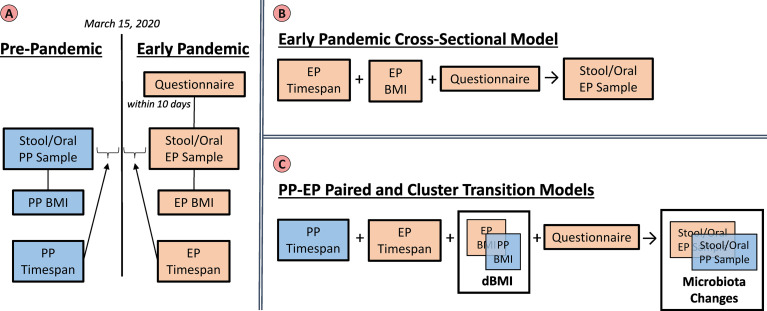
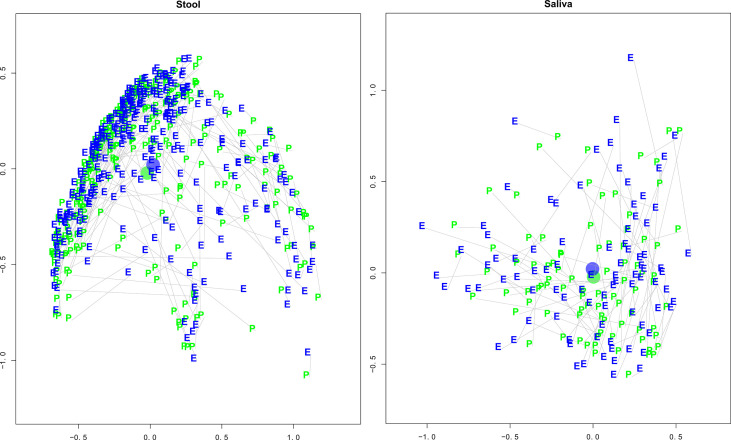
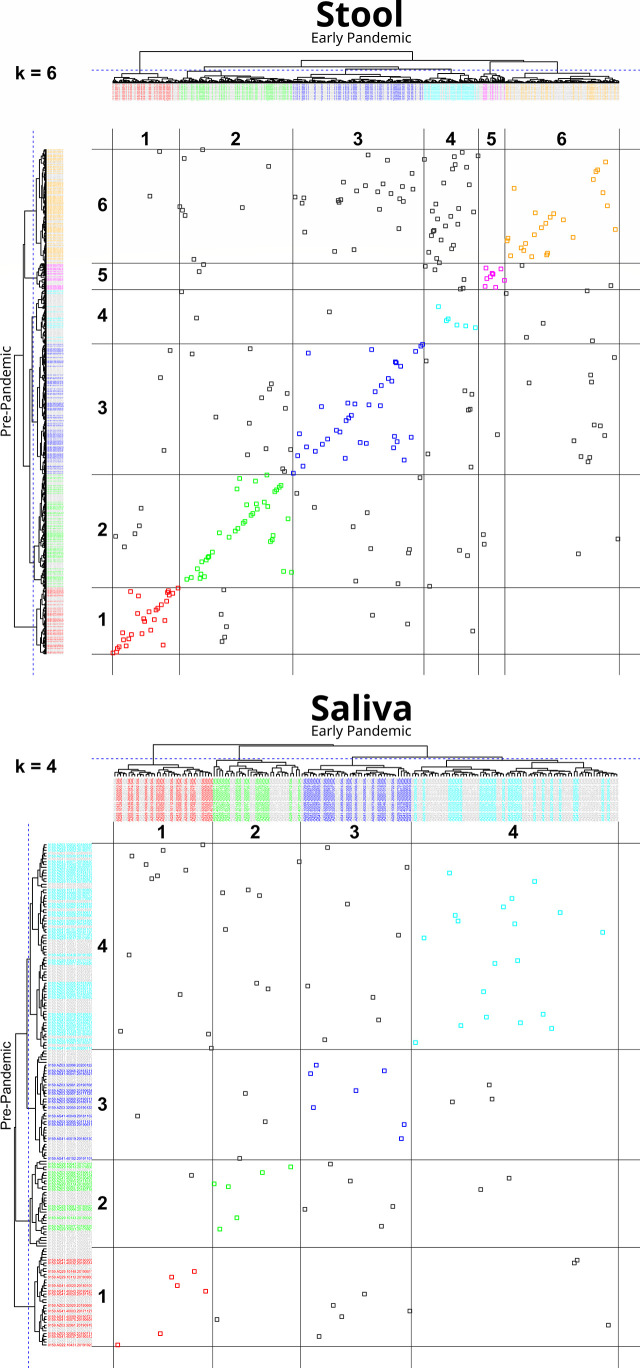
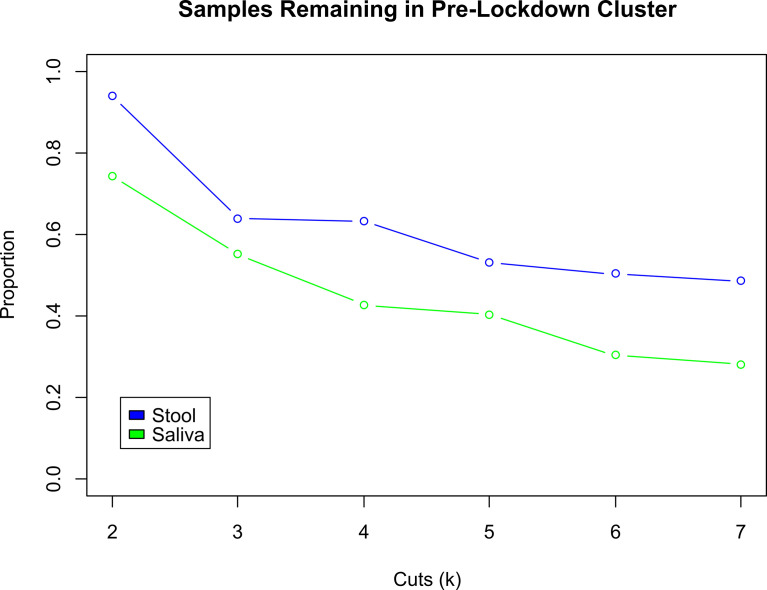
Imposition of social and health behavior mitigations are important control measures in response to the coronavirus disease 2019 (COVID-19) pandemic caused by the Severe Acute Respiratory Syndrome Coronavirus 2 (SARS-CoV-2). Although postulated that these measures may impact the human microbiota including losses in diversity from heightened hygiene and social distancing measures, this hypothesis remains to be tested. Other impacts on the microbiota and host mental and physical health status associations from these measures are also not well-studied. Here we examine changes in stool and oral microbiota by analyzing 16S rRNA gene sequence taxonomic profiles from the same individuals during pre-pandemic (before March 2020) and early pandemic (May-November 2020) phases. During the early pandemic phase, individuals were also surveyed using questionnaires to report health histories, anxiety, depression, sleep and other lifestyle behaviors in a cohort of predominantly Caucasian adults (mean age = 61.5 years) with the majority reporting at least one underlying co-morbidity. We identified changes in microbiota (stool n = 288; oral n = 89) between pre-pandemic and early pandemic time points from the same subject and associated these differences with questionnaire responses using linear statistical models and hierarchical clustering of microbiota composition coupled to logistic regression. While a trend in loss of diversity was identified between pre-pandemic and early pandemic time points it was not statistically significant. Paired difference analyses between individuals identified fewer significant changes between pre-pandemic and early pandemic microbiota in those who reported fewer comorbidities. Cluster transition analyses of stool and saliva microbiota determined most individuals remained in the same cluster assignments from the pre-pandemic to early pandemic period. Individuals with microbiota that shifted in composition, causing them to depart a pre-pandemic cluster, reported more health issues and pandemic-associated worries. Collectively, our study identified that stool and saliva microbiota from the pre-pandemic to early pandemic periods largely exhibited ecological stability (especially stool microbiota) with most associations in loss of diversity or changes in composition related to more reported health issues and pandemic-associated worries. Longitudinal observational cohorts are necessary to monitor the microbiome in response to pandemics and changes in public health measures.

Keywords: 16S rRNA gene amplicon sequencing; COVID-19; ecological stability; gut microbiota; microbiome; saliva microbiota.


Conflict of interest statement

The authors declare that the research was conducted in the absence of any commercial or financial relationships that could be construed as a potential conflict of interest.

Figures

Figure 1
Figure 1
Variables and Models. The left panel (A) summarizes the groups of variables that were utilized in the analyses. Pre-pandemic (PP) (blue) and Early Pandemic (EP) (beige) variables include the taxonomic profiles from sequencing microbiota samples, BMIs interpolated based on the sample collection dates, and timespans relative to March 15, 2020. The questionnaire responses were only collected during the early pandemic. The top right panel (B) illustrates the early pandemic cross-sectional model. Here, only the EP variables: timespan, BMI, and questionnaire were utilized to build a model to predict the EP stool or saliva microbiota. The lower right panel (C) represents the variables included in the paired and cluster transition models. Both the PP and EP timespans, as well as questionnaire responses were included in the models. The BMI and microbiota profiles were included in the model as their relative changes which could be calculated per subject.
Figure 2
Figure 2
Stool and Saliva Pre- and Early Pandemic Paired MDS plots. These multi-dimensional scaling (MDS) plots illustrate each subject’s taxonomic compositional similarity between pre- and early pandemic samples in context with the samples of the cohort. The left and right panels represent the intra-cohort separation of stool and saliva samples, respectively. The green “pre” and blue “early” labels indicate the MDS estimated locations of pre- and early pandemic samples, respectively. A grey line connects pre- and early pandemic samples from the same subject. The blue and green circles represent the centroids of the pre- and early pandemic samples. After controlling for questionnaire responses, the bootstrapped regression identified that pre- vs early pandemic samples had a statistically significant separation (coef = 1.1404, p-val < 0.0001), but saliva did not (coef = 0.1421, p-val = 0.8461).
Figure 3
Figure 3
Cluster transition plot for Stool at k=6 and Saliva at k=4. Cluster transition plots provide a visualization of the degree to which an early pandemic sample’s composition has changed relative to its pre-pandemic composition to warrant a change in its cluster membership. Hierarchical clustering and tree cutting (to form discrete clusters) is inherently an iterative process. In this figure, only one slice at k = 6, for stool, and k = 4, for saliva (labeled on the top left of each plot), were selected for illustrative purposes, although cuts k from 2 to 7 were also calculated. The dendrogram from hierarchically clustering of pre- and early pandemic samples are drawn on the top and left margins. The left margin dendrogram have pre-pandemic samples colored by their cluster identifier, while early pandemic samples are colored grey. Similarly, but complementarily, the top margin dendrogram has early pandemic samples colored by cluster identifier, but pre-pandemic samples are colored grey. In the field of the plot, each point represents the intersection of pre- and early pandemic samples. If both pre- and early pandemic samples are in the same cluster, then they are colored by their cluster identity, otherwise they are colored grey. Gridlines are drawn in the field to help identify cluster boundaries. When pre- to early pandemic samples have changed less in their composition, their points will be colored and lie across a diagonal from bottom-left to top-right. Examples of noteworthy observations from the stool transition plot includes the number of pre-pandemic cluster 6 (Bacteroides and Escherichia Shigella) members that have moved into cluster 4 (Bacteroides, Faecalibacterium) early pandemic, or that none of the pre-pandemic members of cluster 1 (Prevotella, Prevotellaceae, and Lactobacillus) have moved into cluster 6. Comparing the stool and saliva cluster transition plots provides a visualization of the stronger coherence of early pandemic samples to their pre-pandemic counterparts in stool.
Figure 4
Figure 4
Comparison of Proportion of Subjects Changing Clusters between Stool and Saliva. These two curves illustrate the change in the proportion of early pandemic samples that remain in the same cluster as their pre-pandemic sample, for stool (blue) and saliva (green) samples. As the hierarchically clustered samples are cut from k = 2 to 7 clusters, the cluster sizes decrease and become more exclusive. Thus, any two samples that are in the same cluster when k = 7 are more similar to each other, than when k was smaller, e.g., 2. Across all cuts k, the early pandemic stool samples tend to be consistently closer to their pre-pandemic mates, than the saliva samples. At k = 2, the proportion of pre- and early pandemic stool samples that in the same cluster are 93.8%, compared to 74.2% in saliva. At k = 7, 48.6% of stool vs. 28.1% of saliva pre- and early pandemic samples are collocated in the same cluster.

References

    1. Aitchison J. (1982). The statistical analysis of compositional data. J. R. Stat. Society: Ser. B (Methodological) 44 (2), 139–160. doi: 10.1111/j.2517-6161.1982.tb01195.x - DOI
    1. Arora T., Grey I. (2020). Health behaviour changes during COVID-19 and the potential consequences: A mini-review. J. Health Psychol. 25 (9), 1155–1163. doi: 10.1177/1359105320937053 - DOI - PubMed
    1. Atzrodt C. L., Maknojia I., McCarthy R. D. P., Oldfield T. M., Po J., Ta K. T. L., et al. . (2020). A guide to COVID-19: A global pandemic caused by the novel coronavirus SARS-CoV-2. FEBS J. 287 (17), 3633–3650. doi: 10.1111/febs.15375 - DOI - PMC - PubMed
    1. Bavel J. J. V., Baicker K., Boggio P. S., Capraro V., Cichocka A., Cikara M., et al. . (2020). Using social and behavioural science to support COVID-19 pandemic response. Nat. Hum. Behav. 4 (5), 460–471. doi: 10.1038/s41562-020-0884-z - DOI - PubMed
    1. Blix I., Birkeland M. S., Thoresen S. (2021). Worry and mental health in the covid-19 pandemic: vulnerability factors in the general Norwegian population. BMC Public Health 21 (1), 928. doi: 10.1186/s12889-021-10927-1 - DOI - PMC - PubMed

Publication types

Substances