. 2022 Sep 8;2(9):100289.
doi: 10.1016/j.crmeth.2022.100289. eCollection 2022 Sep 19.

A next-generation iPSC-derived forebrain organoid model of tauopathy with tau fibrils by AAV-mediated gene transfer

Affiliations

A next-generation iPSC-derived forebrain organoid model of tauopathy with tau fibrils by AAV-mediated gene transfer

Hiroko Shimada et al. Cell Rep Methods. .

Abstract

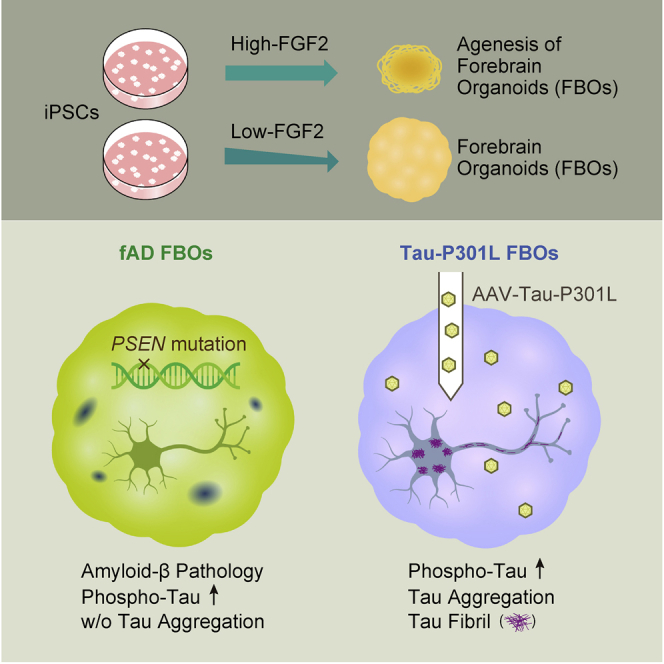
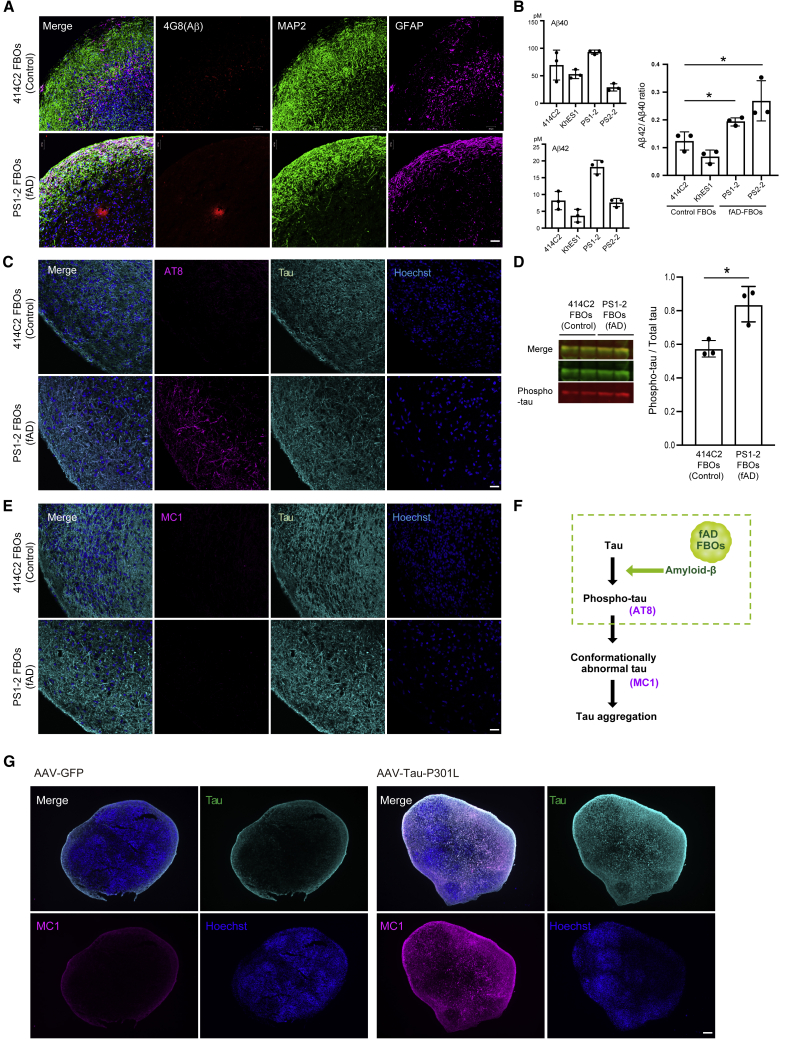
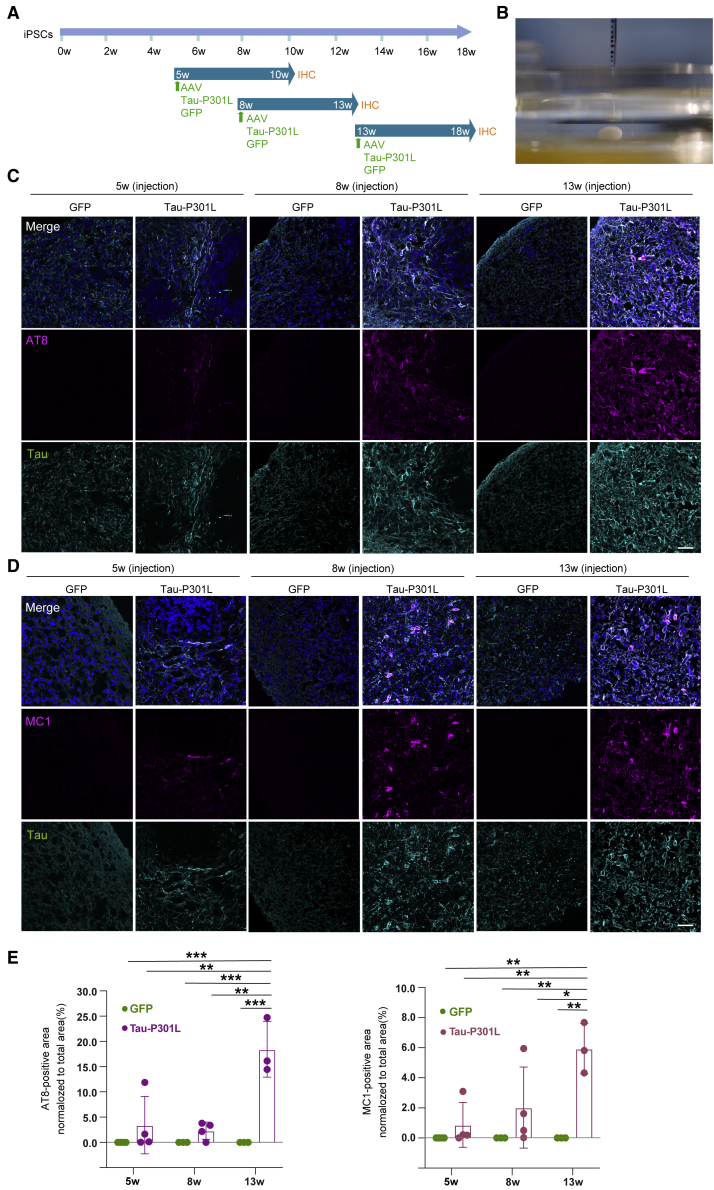
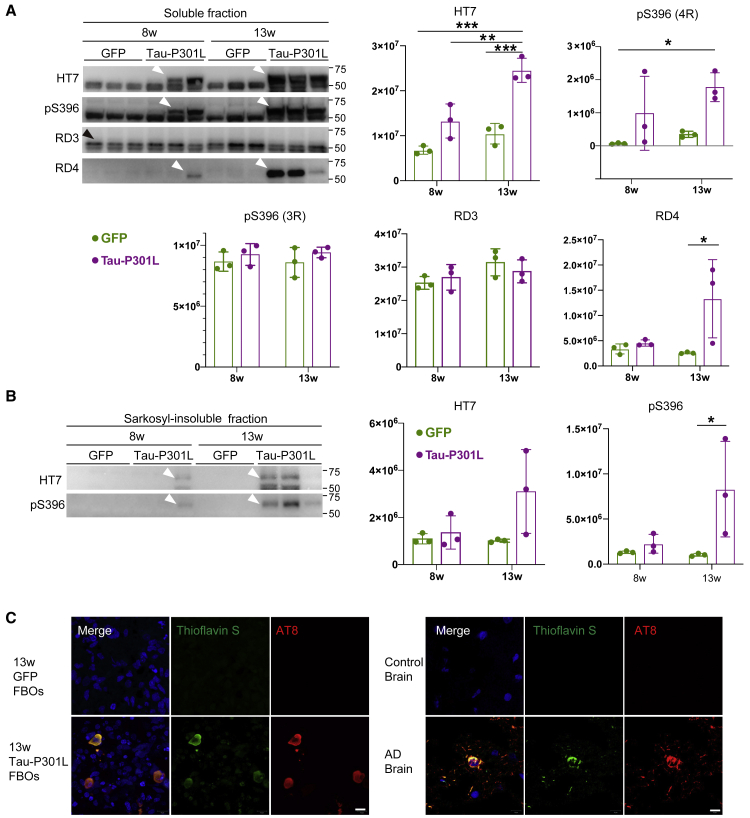
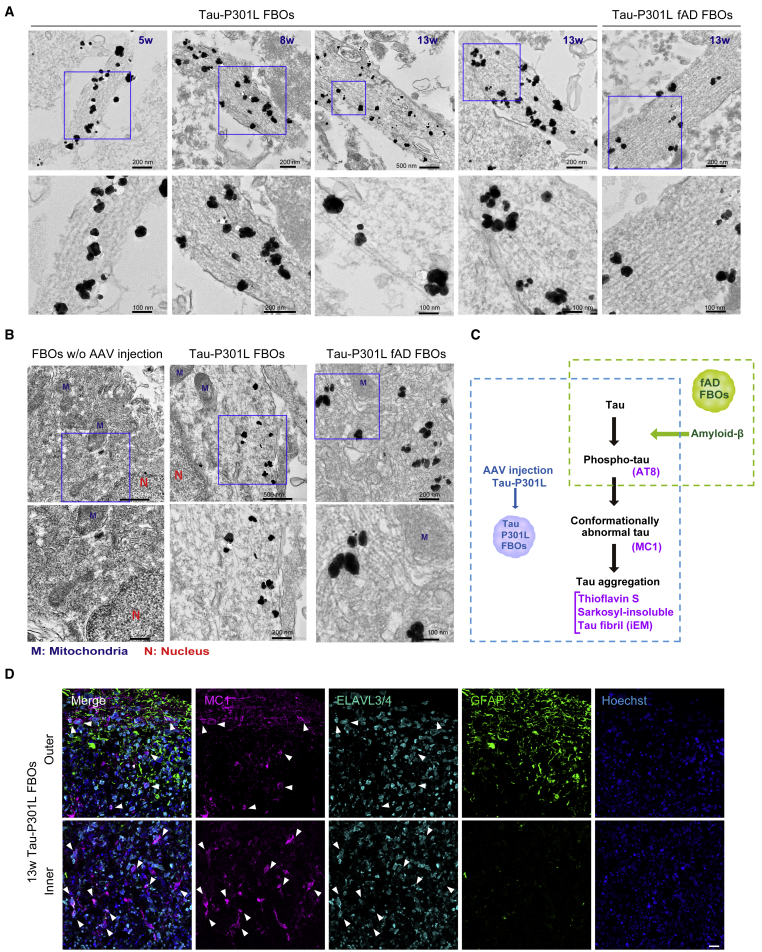
It is known that the human cellular models of Alzheimer's disease (AD) and tauopathy can only recapitulate the very early stage of the disease. To overcome these limitations, we developed a technology to make forebrain organoids (FBOs) from feeder-free induced pluripotent stem cells (iPSC)s by regulating a FGF2 concentration and applied this method to generate FBOs from patients with familial AD (fAD FBOs). The obtained fAD FBOs recapitulated the amyloid-β pathology and increased tau phosphorylation but not tau aggregates. To fully induce the tau pathology, FBOs were injected with adeno-associated virus (AAV)-expressing P301L mutant tau. In these Tau-P301L FBOs, tau fibrils were observed in the neuronal cell body and neurites with immunoelectron microscopy, in addition to the sarkosyl-insoluble and thioflavin S-positive phospho-tau aggregates. Collectively, this model can be used as a platform for investigating pathogenetic mechanisms and evaluation of target molecules for drug discovery for tauopathy.

Keywords: AAV; Alzheimer's disease; FGF2; brain organoids; feeder-free iPSCs; tau; tauopathy.


Conflict of interest statement

H.O. is a scientific consultant for SanBio, Co., Ltd., and K Pharma, Inc. H.S. declares non-financial competing interests. H.A. and J.K. are full-time employees of Eisai, a pharmaceutical company listed on the Tokyo Stock Exchange (TYO:4523) for the period in which the data reported in this study were generated. Y.S. and T.K. are the founders of ALAN, Inc., and held shares in ALAN, Inc. There are two international patent applications related to this work, and these application numbers are PCT/JP2020/025605 (H.O. and H.S.) and PCT/JP2022/12502 (H.O., H.S., Y.S., and T.K.).

Figures

None
Graphical abstract
Figure 1
Figure 1
A FGF2 concentration in feeder-free iPSCs contributes to forebrain identity acquisition in EBs (A) Schematic illustration of generating EBs and neuroepithelia from feeder-free iPSCs with high (100 ng/mL, high-FGF2 iPSCs) or low (10 ng/mL, low-FGF2 iPSCs) concentrations of FGF2. (B) Representative images of high- or low-FGF2 iPSCs (201B7), EBs, and neuroepithelia. n > 30. Scale bar, 300 μm. (C) Diameter of high- or low-FGF2 EBs generated from high- or low-FGF2 iPSCs cultured for 3, 4, and 10 weeks. Greater than 6 EBs from three different batches. (D) Volcano plot of differential gene expression in high- versus low-FGF2 iPSCs by DEG analysis. The expression difference is considered significant for a log2 fold change of >1 (outer pink dash vertical line) and a p value of <0.00124 corresponding to 0.05 in adjusted p value (pink dash horizontal line). See also Table S1. (E) Volcano plot of differential gene expression in high- versus low-FGF2 EBs by DEG analysis. The expression difference is considered significant for a log2 fold change of >1 (outer pink dash vertical line) and a p value of <0.00242 corresponding to 0.05 in adjusted p value (pink dash horizontal line). See also Table S1. (F) Enrichment analysis for GO biological process of significant up- or down-regulated genes between high- and low-FGF2 iPSCs. Six top terms are shown. See also Figure S1A and Table S1. (G) Enrichment analysis for GO biological process of significant up- or down-regulated genes between high- and low-FGF2 EBs. Six top terms are shown. See also Figure S1B and Table S1. (H) Heatmap of neural stem/progenitor cell (NS/PC), forebrain, midbrain, hindbrain, and spinal cord marker gene expression in high- and low-FGF2 iPSCs (n = 3), and high- and low-FGF2 EBs on day 7 (n = 5). See also Figure S2A. (I) PCA map showing PC1 and PC3 of high- and low-FGF2 iPSCs and high- and low-FGF2 EBs (pink triangle: high-FGF2 iPSCs; green circle: low-FGF2 iPSCs; purple triangle: high-FGF2 EBs; blue circle: low-FGF2 EBs). See also Figure S2B. (J) Immunohistochemical staining of the forebrain marker FOXG1 and the neural progenitor marker SOX2 in high- (left panel) or low-FGF2 (right panel) neuroepithelia derived from 201B7 iPSC line on day 14 (n = 3). The nuclei were stained with Hoechst 33258. Scale bar, 50 μm. See also Figures S2C–S2F.
Figure 2
Figure 2
Amyloid-β and tau pathology in day 120 fAD FBOs (A) Immunohistochemical staining for amyloid-β (4G8: red), MAP2 (green), and GFAP (magenta) in day 120 414C2 (control) FBOs and PS1-2 (fAD) FBOs. Images are representative of 414C2 (control) FBOs and PS1-2 (fAD) FBOs that were imaged with these markers (n = 3). The nuclei were stained with Hoechst 33258 (blue). Scale bar, 50 μm. See also Figures S3A–S3C. (B) The Aβ42/Aβ40 ratio was significantly different between control FBOs (iPSCs: 414C2, ESCs: KhES1) and fAD-FBOs (PS1-2, PS2-2). The concentrations of Aβ42 and Aβ40 in the culture medium of day 120 control FBOs and fAD FBOs with 2–3 mm in diameter were measured by ELISA (n = 3). Error bars represent ± SEM of three organoids. Statistical significance was determined using unpaired Student’s t test (∗p < 0.05). (C) Immunostaining for phospho-tau (AT8: magenta) and total tau (cyan) in day 120 414C2 (control) FBOs and PS1-2 (fAD) FBOs. Images are representative of 414C2 (control) FBOs and PS1-2 (fAD) FBOs that were imaged with these markers (n = 3). The nuclei were stained with Hoechst 33258. Scale bar, 50 μm. (D) Western blot analysis of RIPA buffer-soluble fractions using tau antibody and AT8 for phospho-tau. Quantification of ratio of phospho-tau/total tau protein revealed a significant difference between 414C2 (control) and PS1-2 (fAD) FBOs. Error bars represent ± SEM of three organoids. Statistical significance was determined using an unpaired Student’s t test (∗p < 0.05) (n = 3). (E) Immunostaining for aggregated tau (MC1: magenta) and total tau (cyan) in day 120 414C2 (control) FBOs and PS1-2 (fAD) FBOs. Images are representative of 414C2 (control) FBOs and PS1-2 (fAD) FBOs that were imaged with these markers (n = 3). The nuclei were stained with Hoechst 33258. Scale bar, 50 μm. (F) Schematic representation of phenotypes in fAD FBOs. Amyloid-β pathology and phospho-tau were observed, but tau aggregation was not developed in fAD FBOs. (G) Representative images of PS1-2 (fAD) FBOs overexpressing GFP (left panels) or Tau-P301L (right panels) by AAV injection immunostained for aggregated tau (MC1: magenta) and total tau (RTM38: cyan). The nuclei were stained with Hoechst 33258 (blue). The FBOs were analyzed 5 weeks after AAV injection. Images are representative of PS1-2 (fAD) FBOs overexpressing GFP or Tau-P301L that were imaged with these markers (n = 2, GFP: n = 3, Tau-P301L). Scale bar, 200 μm.
Figure 3
Figure 3
Tau-P301L overexpression in FBOs by AAV injection (A) Schematic of AAV injection into FBOs. AAV expressing GFP or Tau-P301L was injected into FBOs at 5, 8, and 13 weeks. Five weeks after AAV injection, the FBOs were processed for immunohistochemistry. (B) A representative image of AAV injection into FBOs. A needle stick in an FBO. (C) Immunofluorescence analysis of phospho-tau (AT8: magenta) and total tau (RTM38: cyan) in 5-, 8-, and 13-week 201B7 (control) FBOs. Images are representative of 201B7 (control) FBOs overexpressing GFP or Tau-P301L that were imaged with these markers (n = 3 or 4). The nuclei were stained with Hoechst 33258 (blue). Scale bar, 50 μm. See also Figures S4A, S5, and S6. (D) Immunofluorescence analysis of aggregated tau (MC1: magenta) and total tau (RTM38: cyan) in 5-, 8-, and 13-week 201B7 (control) FBOs. Images are representative of 201B7 (control) FBOs overexpressing GFP or Tau-P301L that were imaged with these markers (n = 3 or 4). The nuclei were stained with Hoechst 33258 (blue). Scale bar, 50 μm. See also Figures S4B, S5, S6, and S7. (E) The values shown in the graph are the areas of AT8- (left) or MC1-positive (right) area normalized to the total area. The data are expressed as the mean values ± SEM. For statistical analysis, two-way ANOVA was used (∗p < 0.04, ∗∗p < 0.006, ∗∗∗p < 0.001) (n = 3 or 4). See also Table S2.
Figure 4
Figure 4
Detection of aggregated phospho-tau in the sarkosyl-insoluble fractions of Tau-P301L FBOs (A) Total tau, phospho-tau, and tau isoform levels in the soluble fractions of 8- and 13-week 201B7 (control) FBOs overexpressing GFP or Tau-P301L. The white arrowheads indicate 4R-tau. The black arrowhead indicates 3R-tau. The data are expressed as the mean values ± SEM. For statistical analysis, two-way ANOVA was used (∗p < 0.05, ∗∗p < 0.004, ∗∗∗p < 0.0008) (n = 3). See also Table S2. (B) Total tau and phospho-tau levels in the sarkosyl-insoluble fractions of 8- and 13-week 201B7 (control) FBOs overexpressing GFP or Tau-P301L. The arrowheads indicate 4R-tau. The data are expressed as the mean values ± SEM. For statistical analysis, two-way ANOVA was used (∗p = 0.0436) (n = 3). See also Table S2. (C) Tau inclusions in 13-week 201B7 (control) FBOs overexpressing GFP or Tau-P301L, and the brains of a control and a patient with AD were stained with thioflavin S and AT8. Images are representative of 201B7 (control) FBOs overexpressing GFP or Tau-P301L that were imaged with these markers (n = 3). Scale bar, 10 μm.
Figure 5
Figure 5
iEM revealed the presence of tau fibrils labeled with a MC1 antibody in neurites and cell bodies (A) Filamentous assemblies labeled with a MC1 antibody were detected in neurites in 5-, 8-, and 13-week Tau-P301L FBOs (201B7 [control]). The bottom panels show enlarged images of the corresponding top panels. The pictures on the right show 13-week Tau-P301L fAD FBO (PS2-2). The black dots indicate a MC1 antibody bound with nanogold-conjugated anti-mouse secondary antibodies. Images are representative of 201B7 (control) and PS2-2 (fAD) FBOs overexpressing Tau-P301L. n = 2, 5- and 8-week 201B7; n = 3, 13-week 201B7; n = 1, 13-week PS2-2. The nanogold signals were enhanced with silver enhancement solution. (B) MC1-labeled tau fibrils were randomly distributed in cell bodies only in 13-week 201B7 (control) and PS2-2 (fAD) FBOs overexpressing Tau-P301L. Images are representative of 201B7 and PS2-2 FBOs overexpressing Tau-P301L. n = 3, 13-week 201B7, n = 1, 13-week PS2-2. N, nucleus; M, mitochondria. (C) Schematic representation of phenotypes in fAD FBOs and Tau-P301L FBOs. Amyloid-β pathology and phospho-tau were observed in fAD FBOs, and tau pathology such as tau fibrils recognized by iEM was found in Tau-P301L FBOs. (D) Immunostaining for markers of aggregated tau (MC1: magenta), neurons (ELAVL3/4: cyan), and astrocytes (GFAP: green) in 13-week Tau-P301L 201B7 (control) FBOs to identify cells with tau accumulation. The top panels show the outer part of the FBOs, and the bottom panels show the inner part of the FBOs. The arrowheads indicate MC1 and ELAVL3/4 double-positive cells. Images are representative of 201B7 (control) FBOs overexpressing Tau-P301L (n = 3). The nuclei were stained with Hoechst 33258 (blue). Scale bar, 50 μm.

References

    1. Aoyagi H., Hasegawa M., Tamaoka A. Fibrillogenic nuclei composed of P301L mutant tau induce elongation of P301L tau but not wild-type tau. J. Biol. Chem. 2007;282:20309–20318. - PubMed
    1. Arber C., Lovejoy C., Wray S. Stem cell models of Alzheimer's disease: progress and challenges. Alzheimer's Res. Ther. 2017;9:42. - PMC - PubMed
    1. Bhaduri A., Andrews M.G., Mancia Leon W., Jung D., Shin D., Allen D., Jung D., Schmunk G., Haeussler M., Salma J., et al. Cell stress in cortical organoids impairs molecular subtype specification. Nature. 2020;578:142–148. - PMC - PubMed
    1. Centeno E.G.Z., Cimarosti H., Bithell A. 2D versus 3D human induced pluripotent stem cell-derived cultures for neurodegenerative disease modelling. Mol. Neurodegener. 2018;13:27. - PMC - PubMed
    1. Choi S.H., Kim Y.H., Hebisch M., Sliwinski C., Lee S., D'Avanzo C., Chen H., Hooli B., Asselin C., Muffat J., et al. A three-dimensional human neural cell culture model of Alzheimer's disease. Nature. 2014;515:274–278. - PMC - PubMed

Publication types