. 2022 Sep 8:13:971506.
doi: 10.3389/fpls.2022.971506. eCollection 2022.

Metabolomic and transcriptomic analyses reveal the mechanism of sweet-acidic taste formation during pineapple fruit development

Affiliations

Metabolomic and transcriptomic analyses reveal the mechanism of sweet-acidic taste formation during pineapple fruit development

Yuyao Gao et al. Front Plant Sci. .

Abstract

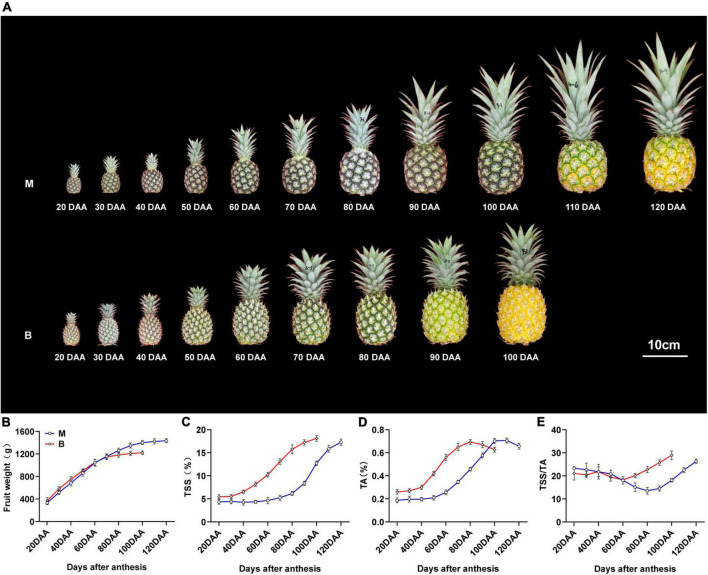
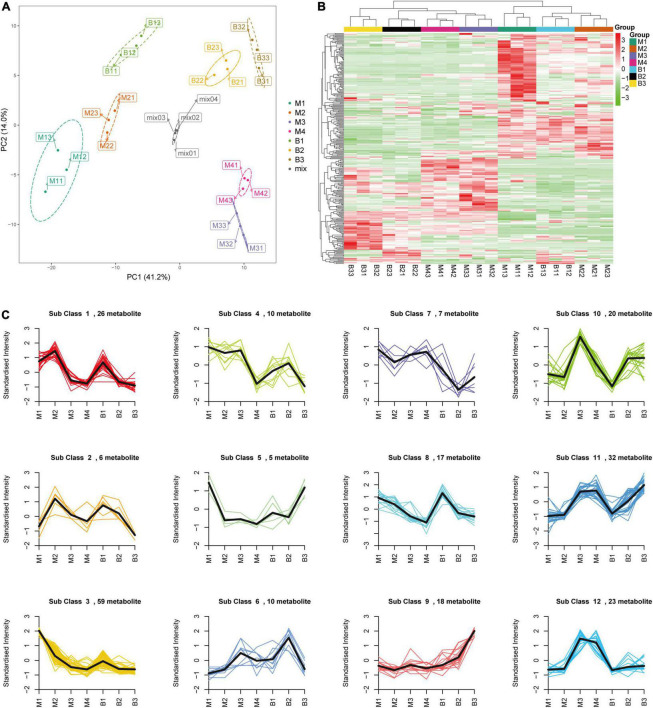
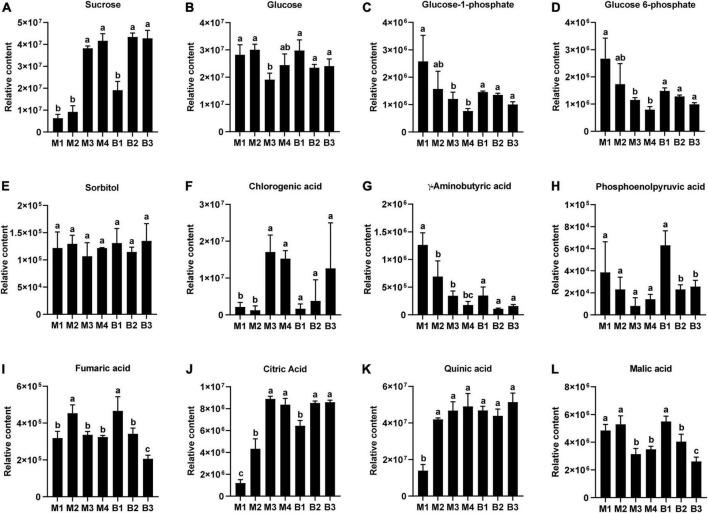
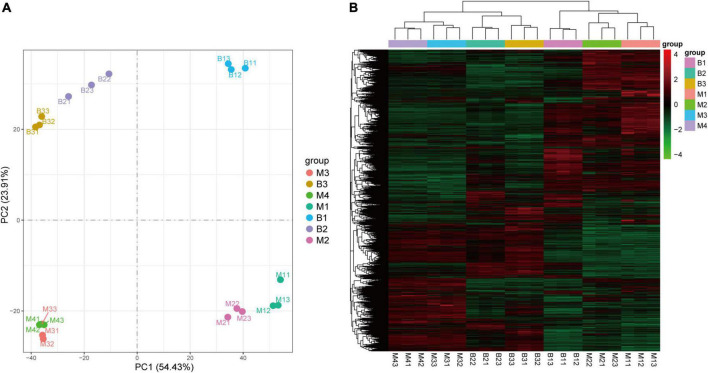
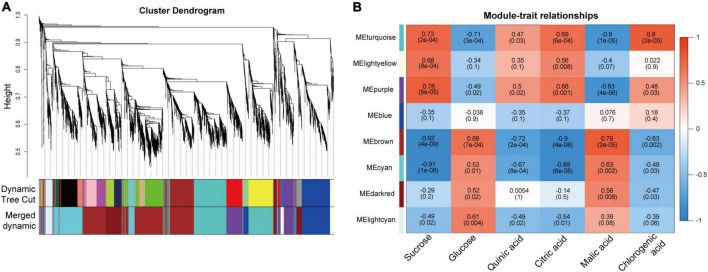
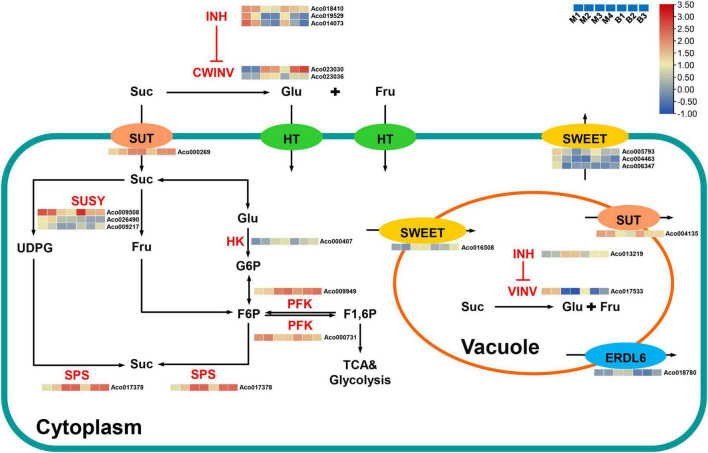
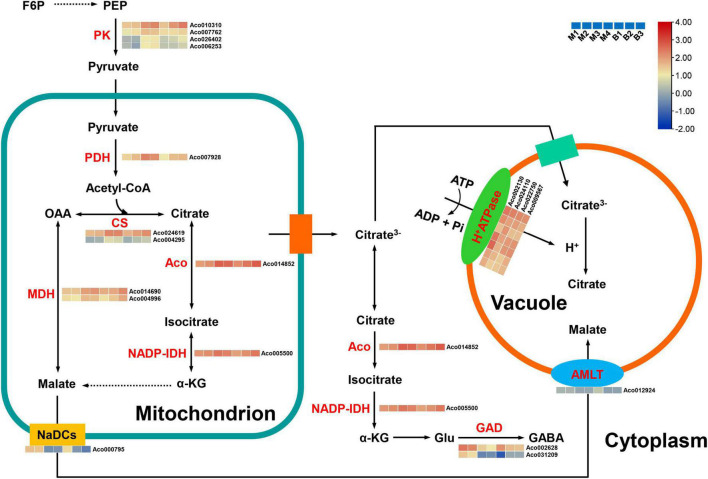
Pineapple (Ananas comosus L.) is one of the most valuable subtropical fruit crop in the world. The sweet-acidic taste of the pineapple fruits is a major contributor to the characteristic of fruit quality, but its formation mechanism remains elusive. Here, targeted metabolomic and transcriptomic analyses were performed during the fruit developmental stages in two pineapple cultivars ("Comte de Paris" and "MD-2") to gain a global view of the metabolism and transport pathways involved in sugar and organic acid accumulation. Assessment of the levels of different sugar and acid components during fruit development revealed that the predominant sugar and organic acid in mature fruits of both cultivars was sucrose and citric acid, respectively. Weighted gene coexpression network analysis of metabolic phenotypes and gene expression profiling enabled the identification of 21 genes associated with sucrose accumulation and 19 genes associated with citric acid accumulation. The coordinated interaction of the 21 genes correlated with sucrose irreversible hydrolysis, resynthesis, and transport could be responsible for sucrose accumulation in pineapple fruit. In addition, citric acid accumulation might be controlled by the coordinated interaction of the pyruvate-to-acetyl-CoA-to-citrate pathway, gamma-aminobutyric acid pathway, and tonoplast proton pumps in pineapple. These results provide deep insights into the metabolic regulation of sweetness and acidity in pineapple.

Keywords: Ananas comosus; citric acid; fruit quality; metabolic genes; sucrose; transporter genes.


Conflict of interest statement

The authors declare that the research was conducted in the absence of any commercial or financial relationships that could be construed as a potential conflict of interest.

Figures

FIGURE 1
FIGURE 1
Changes in fruit morphology and physiological index and fruit weight during fruit development and maturity. (A) Pineapple cultivars M and B fruits at different developmental stages. (B) Fruit weight in the fruit at different developmental stages. (C) TSS in the fruit at different developmental stages. (D) TA in the fruit at different developmental stages. (E) TSS/TA in the fruit at different developmental stages. DAA, days after anthesis; Data were the mean ± standard error from three biological replicate assays.
FIGURE 2
FIGURE 2
PCA (A), HCA (B), and K-means clustering (C) of the metabolites from the developing pineapple flesh. M1, M2, M3, and M4 represented fruit flesh samples for M at 40, 80, 100, and 120 DAA, respectively, B1, B2, and B3 represented fruit flesh samples for B at 40, 80, and 100 DAA, respectively. In the heatmap, each sample was represented by a single column, and each metabolite was visualized in a row. Red showed high abundance, and green exhibited relatively low metabolite abundance. 12 clusters (Sub class 1–12) of 233 differential metabolites were divided based on the dynamic changes of metabolites from different developmental stages for the two cultivars.
FIGURE 3
FIGURE 3
Changes in the relative contents of the main sugars and organic acids in pineapple fruits at four different stages (40, 80, 100, and 120 DAA) for M (M1, M2, M3, and M4) and three different stages (40, 80, and 100 DAA) for B (B1, B2 and B3). (A) Sucrose, (B) glucose, (C) glucose 1-phosphate, (D) glucose 6-phosphate, (E) sorbitol, (F) chlorogenic acid, (G) gamma-aminobutyric acid, (H) phosphoenolpyruvic acid, (I) fumaric acid, (J) citric acid, (K) quinic acid, (L) malic acid. For each cultivar, bars with the same lowercase letter (a, b, or c) indicate no significant differences (p < 0.05).
FIGURE 4
FIGURE 4
PCA (A) and HCA (B) of genes in pineapple fruits at different developmental stages of M and B. M1, M2, M3, and M4 represented fruit flesh samples for M at 40, 80, 100, and 120 DAA, respectively, B1, B2, and B3 represented fruit flesh samples for B at 40, 80, and 100 DAA, respectively.
FIGURE 5
FIGURE 5
Result of gene coexpression modules associated with sugars and organic acids in pineapple fruits at different developmental stages of M and B. (A) Clustering dendrogram presenting 11 modules of coexpressed genes based on WGCNA. (B) Correlations coefficient and significance between modules and sucrose, glucose, quinic acid, citric acid, malic acid, chlorogenic acid, where each grid contained the corresponding correlation and p-value.
FIGURE 6
FIGURE 6
Relative expression of 15 genes involved in sugar and organic acid metabolism and transport during different developmental stages of M and B by qRT-PCR (A) and correlation analysis between RNA-Seq and qRT-PCR data (B).
FIGURE 7
FIGURE 7
Regulatory model and expression levels of the genes related to sucrose metabolism and accumulation in pineapple fruits. From blue to red in the heatmap indicates the expression levels of the genes ranging from low to high in two pineapple cultivars throughout fruit development. M1, M2, M3, and M4 represented fruit flesh samples for M at 40, 80, 100, and 120 DAA, respectively, and B1, B2, and B3 represented fruit flesh samples for B at 40, 80, and 100 DAA, respectively. CWINV, cell wall invertase; CWINH, cell-wall invertase inhibitor; VINV, vacuolar acid invertase; VINH, vacuolar acid invertase inhibitor; SUSY, sucrose synthase; SPS, sucrose phosphate synthase; HK, hexokinase; PFK, phosphofructokinase; SUT, sucrose transporters; SWEET, sugars will eventually be exported transporter; ERDL6, glucose exporter early response to dehydration like 6; Suc, sucrose; Glc, glucose; Fru, fructose; UDPG, UDP-glucose; G6P, glucose-6-phosphate; F6P, fructose-6-phosphate; F1, 6P, fructose-1, 6-phosphate.
FIGURE 8
FIGURE 8
Regulatory model and expression levels of the genes related to citric acid and malic acid metabolism and accumulation in pineapple fruits. From blue to red in the heatmap indicates the expression levels of the genes ranging from low to high in two pineapple cultivars throughout fruit development. M1, M2, M3, and M4 represented fruit flesh samples for M at 40, 80, 100, and 120 DAA, respectively, and B1, B2, and B3 represented fruit flesh samples for B at 40, 80, and 100 DAA, respectively. PK, pyruvate kinase; PDH, pyruvate dehydrogenase; CS, citrate synthase, ACO, aconitase; MDH, malate dehydrogenase; NADP-IDH, isocitrate dehydrogenase NADP; GAD, glutamate decarboxylase; ALMT, aluminum-activated malate transporter; NaDCs, sodium-dependent dicarboxylate transporter. PEP, phosphoenolpyruvate; a-KG, a-ketoglutarate; Glu, glutamate; GABA, γ-aminobutyric acid.

Similar articles

Cited by

References

    1. Ali M. M., Hashim N., Aziz S. A., Lasekan O. (2020). Pineapple (Ananas comosus): A comprehensive review of nutritional values, volatile compounds, health benefits, and potential food products. Food Res. Int. 137:109675. 10.1016/j.foodres.2020.109675 - DOI - PubMed
    1. Antony E., Taybi T., Courbot M., Mugford S. T., Smith J. A. C., Borland A. M. (2008). Cloning, localization and expression analysis of vacuolar sugar transporters in the CAM plant Ananas comosus (pineapple). J. Exp. Bot. 59 1895–1908. 10.1093/jxb/ern077 - DOI - PubMed
    1. Arampath P. C., Dekker M. (2019). Bulk storage of mango (Mangifera indica L.) and pineapple (Ananas comosus L.) pulp: Effect of pulping and storage temperature on phytochemicals and antioxidant activity. J. Sci. Food Agric. 99 5157–5167. 10.1002/jsfa.9762 - DOI - PMC - PubMed
    1. Aslam M., Deng L., Wang X. B., Wang Y. (2019). Expression patterns of genes involved in sugar metabolism and accumulation during peach fruit development and ripening. Sci. Hortic. 257:108633. 10.1016/j.scienta.2019.108633 - DOI
    1. Batista-Silva W., Nascimento V. L., Medeiros D. B., Nunes-Nesi A., Ribeiro D. M., Zsögön A., et al. (2018). Modifications in organic acid profiles during fruit development and ripening: Correlation or causation? Front. Plant Sci. 9:1689. 10.3389/fpls.2018.01689 - DOI - PMC - PubMed

LinkOut - more resources