

The DEAD box RNA helicase DDX42 is an intrinsic inhibitor of positive-strand RNA viruses
- PMID: 36161446
- PMCID: PMC9638865
- DOI: 10.15252/embr.202154061
The DEAD box RNA helicase DDX42 is an intrinsic inhibitor of positive-strand RNA viruses
Abstract
Genome-wide screens are powerful approaches to unravel regulators of viral infections. Here, a CRISPR screen identifies the RNA helicase DDX42 as an intrinsic antiviral inhibitor of HIV-1. Depletion of endogenous DDX42 increases HIV-1 DNA accumulation and infection in cell lines and primary cells. DDX42 overexpression inhibits HIV-1 infection, whereas expression of a dominant-negative mutant increases infection. Importantly, DDX42 also restricts LINE-1 retrotransposition and infection with other retroviruses and positive-strand RNA viruses, including CHIKV and SARS-CoV-2. However, DDX42 does not impact the replication of several negative-strand RNA viruses, arguing against an unspecific effect on target cells, which is confirmed by RNA-seq analysis. Proximity ligation assays show DDX42 in the vicinity of viral elements, and cross-linking RNA immunoprecipitation confirms a specific interaction of DDX42 with RNAs from sensitive viruses. Moreover, recombinant DDX42 inhibits HIV-1 reverse transcription in vitro. Together, our data strongly suggest a direct mode of action of DDX42 on viral ribonucleoprotein complexes. Our results identify DDX42 as an intrinsic viral inhibitor, opening new perspectives to target the life cycle of numerous RNA viruses.
Keywords: DDX42 DEAD-box RNA helicase; RNA viruses; intrinsic immunity; viral inhibition.
© 2022 The Authors. Published under the terms of the CC BY NC ND 4.0 license.
Figures
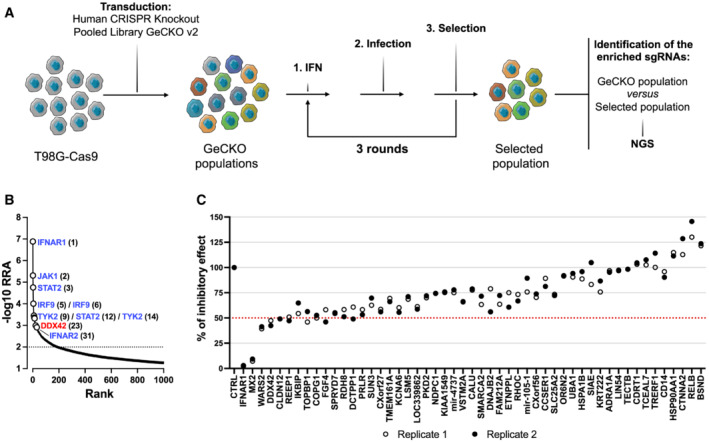
- A
Screen strategy. GeCKO cell populations (obtained by transduction of T98G/Cas9 cells with GeCKO v2 LV library) were IFN‐treated, challenged with HIV‐1 LVs coding for an antibiotic resistance gene and selected. Three rounds of IFN treatment, infection and selection were performed. Genomic DNAs of initial GeCKO and 3‐time selected populations were extracted, the sgRNA‐coding sequences amplified and sequenced.
- B
Candidate gene identification. MAGeCK computational statistical tool (Li et al, 2014) was used to establish a Robust Rank Aggregation (RRA) score for each gene based on sgRNA enrichment and number of sgRNAs per gene. Genes belonging to the type 1 IFN response pathway (in blue) and DDX42 (in red) are shown (respective ranks into brackets) for 2 independent screens (the results of which were merged in the analysis). The dashed line indicates the significance threshold.
- C
Candidate validation. T98G/Cas9/CD4/CXCR4/Firefly KO populations were generated for the 25 top hits of each screen. The control (CTRL) condition represents the mean of 4 negative CTRL populations, obtained with 4 non‐targeting sgRNAs; IFNAR1 and MX2 KO populations were used as positive controls. KO cell populations were treated with IFN and infected with HIV‐1 Renilla (NL4‐3/Nef‐IRES‐Renilla) and luciferase signals were measured 30 h later (Renilla signals were normalized to Firefly). IFN inhibition (i.e. ratio of untreated / IFN‐treated conditions) was calculated and set at 100% inhibition for CTRL. Data from technical duplicates are shown.
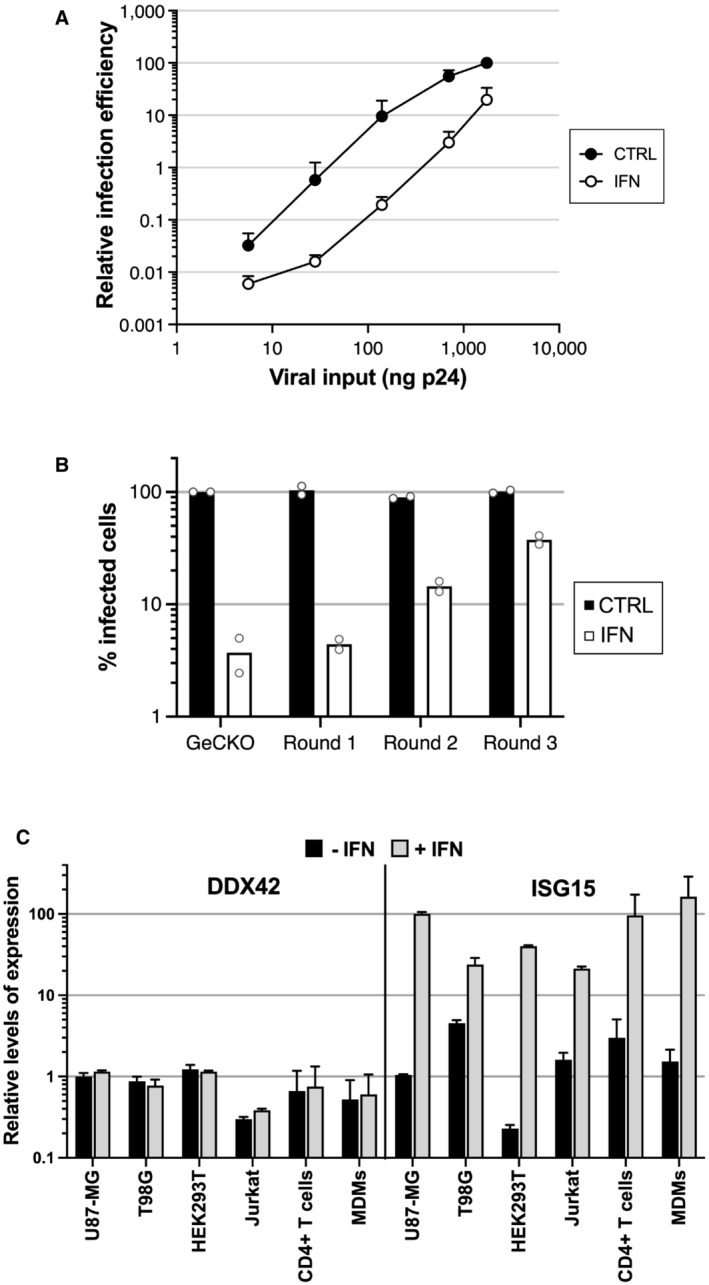
- A
T98G/Cas9/CD4/CXCR4/Firefly cells were pre‐treated with IFN for 24 h prior to infection with increasing doses of NL4‐3 Renilla (NL4‐3/Nef‐IRES‐Renilla) (indicated in ng p24Gag). Renilla activity was normalized to Firefly activity and the relative infection efficiencies are shown. Data represent the average and standard deviation (s.d.) of 3 biological replicates.
- B
GeCKO control cells and enriched cells from 3 successive rounds of selection (Round 1, 2, and 3, as indicated) were treated with IFN or not and infected with GFP‐expressing lentiviral vectors. The percentage of infected cells was evaluated by flow cytometry 2 days post‐infection. Data represent the average of 2 biological replicates.
- C
The indicated primary cells or immortalized cell cultures were treated with IFN for 24 h or left untreated. RNA was subsequently extracted and DDX42 and ISG15 (a prototype ISG) mRNA levels were quantified by RT‐qPCR; ActinB and GAPDH were used as endogenous controls. The bar chart shows the relative levels of expression of DDX42 and ISG15 in the presence or absence of IFN treatment. Data represent the mean ± S.E.M of 3 biological replicates.
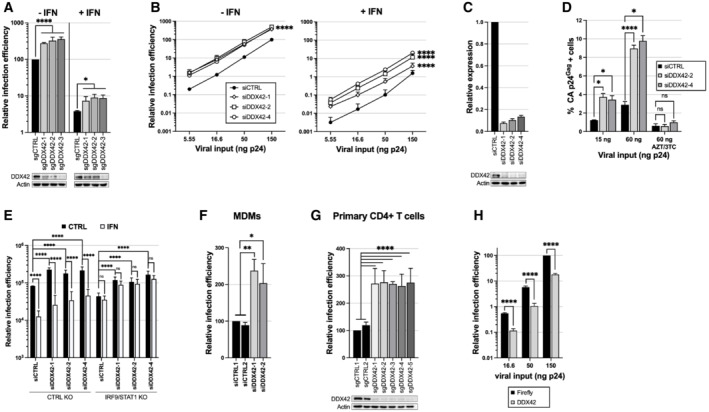
- A
Top: DDX42 KO and CTRL KO U87‐MG/CD4/CXCR4/Cas9/Firefly cells were generated using 3 sgRNAs and 4 non‐targeting sgRNAs, respectively (for CTRL, the average of data obtained with 4 cell populations is shown). Cells were treated or not with IFN 24 h prior to infection with HIV‐1 Renilla (NL4‐3/Nef‐IRES‐Renilla). Relative luminescence results for IFN‐treated and ‐untreated conditions are shown. Two‐way ANOVA on log‐transformed data with Sidak's test. Bottom: Immunoblot analysis of DDX42 levels is shown for 1 CTRL and DDX42‐depleted populations; Actin served as a loading control.
- B
siRNA‐transfected U87‐MG/CD4/CXCR4 cells were treated or not with IFN for 24 h prior to infection with HIV‐1 Renilla. Relative luminescence results for IFN‐treated and ‐untreated conditions are shown. Multiple linear regression analysis.
- C
DDX42 silencing efficiency measured by RT‐qPCR (top) and immunoblot (bottom) in parallel samples from B.
- D
DDX42‐depleted cells were infected with HIV‐1 (WT NL4‐3), and infection efficiency was measured by CA p24Gag intracellular staining and flow cytometry analysis. When indicated, cells were treated with azidothymidine (AZT) and lamivudine (3TC). Two‐way ANOVA on log‐transformed data with Dunnett's test.
- E
CTRL and IRF9/STAT1 KO cells were pre‐treated or not with IFN for 24 h and infected with HIV‐1 Renilla (NL4‐3/Nef‐IRES‐Renilla). Infection efficiency was assessed 24 h later by measuring Renilla activity. Two‐way ANOVA on log‐transformed data with Dunnett's test.
- F
siRNA‐transfected MDMs were infected with a CCR5‐tropic version of HIV‐1 Renilla (NL4‐3/R5/Nef‐IRES‐Renilla). Relative luminescence results from biological triplicates performed with cells from different donors are shown. Two‐way ANOVA on log‐transformed data with Dunnett's test.
- G
Primary CD4+ T cells were electroporated with Cas9‐sgRNA RNPs using 2 non‐targeting sgRNAs (sgCTRL1 and 2) and 5 sgRNAs targeting DDX42. Top: Cells were then infected with HIV‐1 Renilla (NL4‐3/Nef‐IRES‐Renilla) and relative infection efficiencies obtained with cells from 3 donors are shown. Two‐way ANOVA on log‐transformed data with Dunnett's test. Bottom: DDX42 protein levels were determined by immunoblot, Actin served as a loading control. A representative immunoblot is shown.
- H
Firefly‐ or DDX42‐expresssing U87‐MG/CD4/CXCR4 cells were infected with HIV‐1 Renilla (NL4‐3/Nef‐IRES‐Renilla). Relative infection efficiencies are shown. Multiple linear regression analysis.
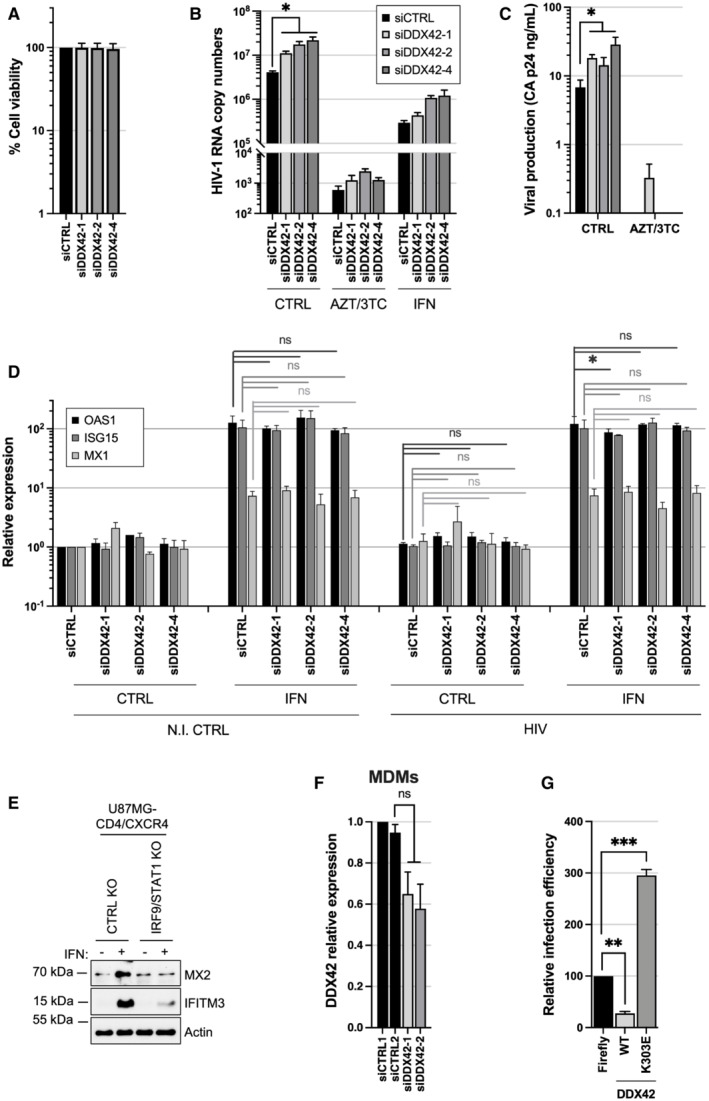
- A
Cell viability of siRNA‐transfected U87‐MG/CD4/CXCR4 cells was assessed 72 h post‐transfection by measuring ATP levels. Data represent the mean ± S.E.M of 3 biological replicates.
- B
U87‐MG/CD4/CXR4 cells were transfected with siRNAs, pre‐treated or not with IFN and infected with WT HIV‐1 (NL4‐3) in the presence or not of reverse transcription inhibitors (AZT/3TC). 48 h later, cells were lysed, RNA extracted and RT‐qPCR analysis performed to measure HIV‐1 RNAs. Data represent the mean ± S.E.M of 4 biological replicates. Two‐way ANOVA on log‐transformed data with Sidak's test.
- C
Supernatants from (B) were harvested 48 h post‐infection and AlphaLisa used to measure CA p24Gag production. Data represent the mean ± S.E.M of 4 biological replicates. Two‐tailed, unpaired t test.
- D
RT‐qPCR analysis was performed RNA samples from (B) to measure relative expression of the ISG OAS1, ISG15, and MX1 (normalized to actin and GAPDH). Data represent the mean ± S.E.M of 4 biological replicates. Two‐way ANOVA with Dunnett's test.
- E
U87‐MG/CD4/CXCR4 cells were transduced to express Cas9 and sgRNAs either targeting nothing (CTRL) or IRF9 and STAT1 (IRF9/STAT1). After 2 weeks, cells were treated or not with IFN, and, 48 h later, IFITM3 and MX2 induction was analyzed by immunoblotting, Actin served as a loading control. A representative immunoblot is shown.
- F
siRNA‐transfected MDMs were harvested 48 h post‐transfection for RNA extraction and quantification of DDX42 mRNA levels by RT‐qPCR. Actin and GAPDH were used as endogenous controls. Data represent the mean ± S.E.M of 3 biological replicates performed with cells from different blood donors (parallel samples from Fig 2E). One‐way ANOVA with Dunnett's test.
- G
U87‐MG/CD4/CXCR4 cells were transduced with lentiviral vectors expressing either Firefly (negative control), WT DDX42 (WT) or a motif I point mutant, which has an impaired ATPase activity (K303E). Transduced cells were infected with HIV‐1 Renilla (NL4‐3/Nef‐IRES‐Renilla) and the infection efficiency was assessed 24 h later by measuring Renilla activity. Data represent the mean ± S.E.M of 3 biological replicates. Two‐way ANOVA on log‐transformed data with Dunnett's test.
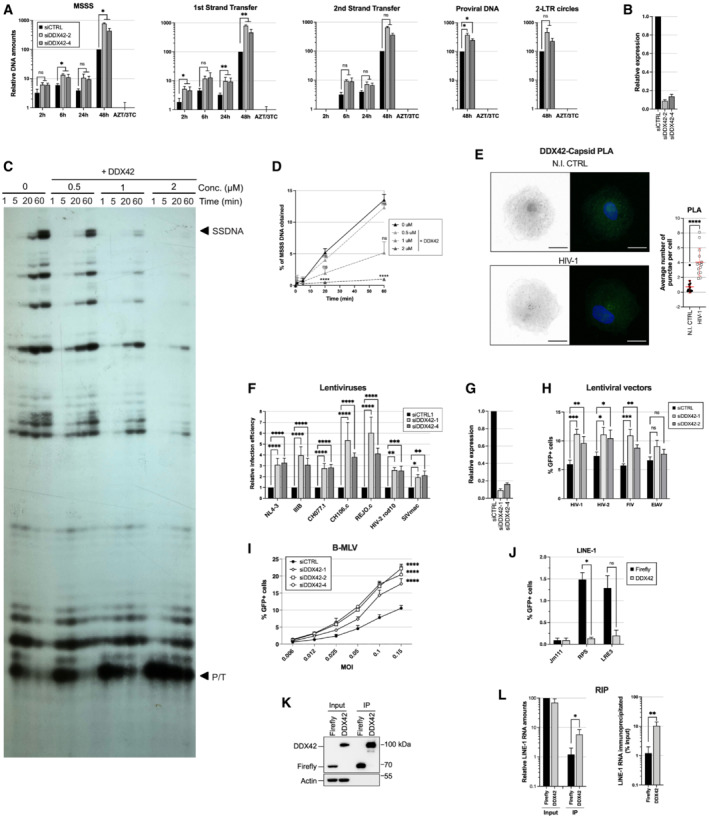
- A
siRNA‐transfected U87‐MG/CD4/CXCR4 cells were infected with WT HIV‐1 (NL4‐3) and relative amounts of Minus Strand Strong Stop (MSSS), 1st and 2nd Strand Transfer DNAs, and nuclear forms of HIV‐1 DNA (proviral DNA, and 2‐LTR circles) were quantified by qPCR. DNAs from cells infected for 48 h in the presence of AZT and 3TC were used as a control. Mixed‐effects analysis on log‐transformed data with Dunnett's test.
- B
Silencing efficiency in parallel samples from A.
- C
Heat‐annealed ODN/RNA 1–294 complex was incubated with HIV‐1 RT and increasing concentrations of recombinant DDX42. Reverse transcription was initiated by addition of the four dNTPs. Extension was for 1, 5, 20 or 60 min and samples were analyzed by PAGE 8% (P/T: primer/template; SSDNA: Strong‐Stop DNA). A representative autoradiograph is shown.
- D
Quantification of 3 biological replicates performed as in C. Two‐way ANOVA on log‐transformed data with Dunnett's test.
- E
PLAs were performed in MDMs infected with HIV‐1 or not (N.I. CTRL), using anti‐Capsid and anti‐DDX42 antibodies (nuclei stained with Hoechst). Images were acquired using a LSM880 Airyscan microscope. Left: representative images, scale‐bar: 10 μm. Right: Average punctae quantified per cell in 3 biological replicates done on MDMs from different donors with mean ± SD (n > 65 cells per condition). Mann–Whitney test.
- F
siRNA‐transfected TZM‐bl cells were infected with the indicated VSV‐G‐pseudotyped, replication competent viruses and β‐galactosidase signals measured 24 h later. Two‐way ANOVA on log‐transformed data with Dunnett's test.
- G
Silencing efficiency in parallel samples from (F).
- H
siRNA‐transfected U87‐MG/CD4/CXCR4 cells were infected with HIV‐1‐ HIV‐2‐ FIV‐ EIAV‐based, GFP‐coding LVs and infection efficiency was scored 24 h later by measuring the percentage of GFP expressing cells by flow cytometry. Two‐way ANOVA on log‐transformed data with Dunnett's test.
- I
siRNA‐transfected U87‐MG/CD4/CXCR4 cells were infected with GFP‐coding B‐MLV retroviral vector and infection efficiency measured 24 h later by flow cytometry. Simple linear regression analysis.
- J
HEK293T were co‐transfected with GFP‐coding LINE‐1 plasmids (RPS‐GFP or LRE3‐GFP) or with an inactive LINE‐1 plasmid (JM111) together with either a Firefly‐ or DDX42‐coding plasmid. GFP expression was measured by flow cytometry 7 days later. Two‐way ANOVA on log‐transformed data with Sidak's test.
- K
HEK293T were co‐transfected with pRPS‐GFP and a Flag‐Firefly‐ (negative control) or Flag‐DDX42‐coding plasmid, followed by Flag immunoprecipitation and immunoblot analysis. A representative immunoblot is shown.
- L
Left, RNA extraction and LINE‐1 RT‐qPCR on parallel samples from (K). Two‐way ANOVA on log‐transformed data with Sidak's test. Right, Percentage of immunoprecipitated RNA. T‐test on log‐transformed data.
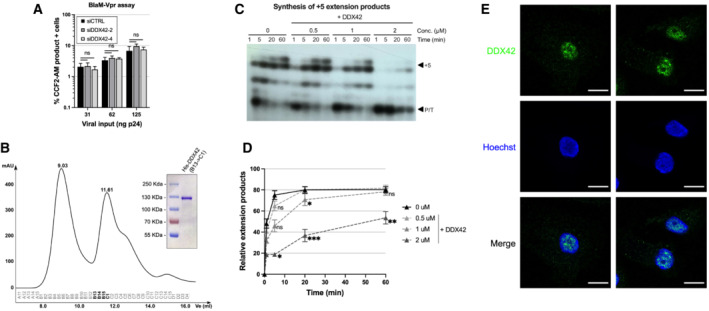
- A
DDX42‐depleted U87‐MG/CD4/CXCR4 cells were infected with the indicated amounts of NL4‐3/Nef‐IRES‐Renilla viruses carrying the β‐lactamase (BlaM)‐Vpr fusion protein for 3 h. The cells were subsequently loaded with CCF2‐AM substrate dye for 2 h, washed extensively and incubated for another 16 h for the reaction to develop. Cells positive for the CCF2‐AM product were scored by flow cytometry. Data represent the mean ± S.E.M of 3 biological replicates. Two‐way ANOVA on log‐transformed data with Dunnett's test. P values are denoted as follow: ns, not significant, *P < 0.05, **P < 0.01, ***P < 0.001, ****P < 0.0001.
- B
Elution profile of His‐DDX42. Top right, SDS‐PAGE followed by Coomassie coloration analysis of the pooled fractions.
- C
Heat‐annealed ODN/RNA 1–294 complex was incubated with HIV‐1 RT and the indicated, increasing concentrations of recombinant DDX42 (Fig EV3B). Reverse transcription was initiated by addition of dTTP, dGTP, dCTP and ddATP. Extension was for 1, 5, 20 or 60 min and samples were analyzed by PAGE 12% (P/T: primer/template; +5: extension of 5 nucleotides). A representative autoradiograph is shown.
- D
Quantified data correspond to the ratio of extension products / unextended P/T at different time points. Data represent the mean ± S.E.M of 4 biological replicates. Two‐way ANOVA on log‐transformed data with Dunnett's test. P values are denoted as follow: ns, not significant, *P < 0.05, **P < 0.01, ***P < 0.001.
- E
MDMs were fixed, endogenous DDX42 and the nuclei were visualized using DDX42‐specific antibodies and Hoechst staining, respectively, and confocal microscopy. Representative images are shown. Scale bar, 10 μm.
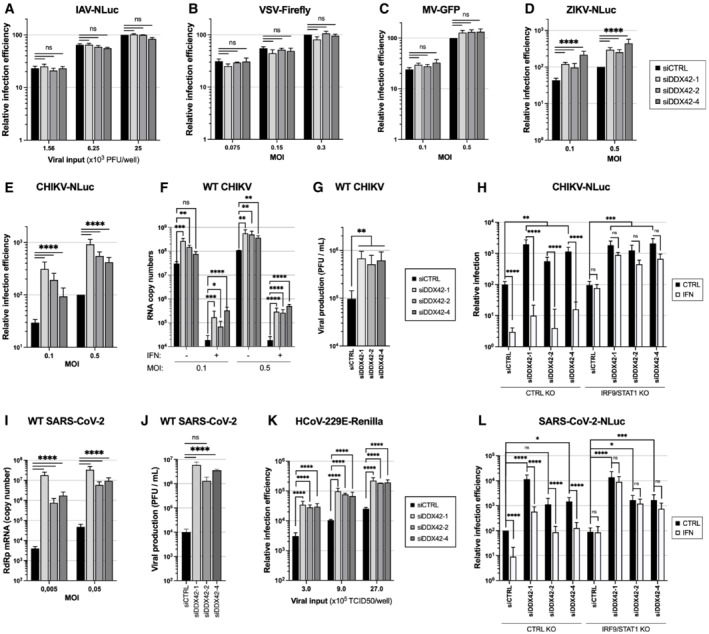
- A
Relative IAV‐Nanoluciferase (IAV‐NLuc) infection efficiency in siRNA‐transfected U87‐MG cells (Nanoluciferase activity 16 h post infection). Multiple linear regression analysis.
- B
Relative VSV‐Firefly infection efficiency in siRNA‐transfected U87‐MG cells (Firefly activity 24 h post infection). Multiple linear regression analysis.
- C
Relative MV‐GFP infection efficiency in siRNA‐transfected Huh‐7 cells (GFP+ cells scored 24 h post infection). Multiple linear regression analysis.
- D
Relative ZIKV‐Nanoluciferase infection efficiency in siRNA‐transfected U87‐MG cells (Nanoluciferase activity 24 h post infection). Multiple linear regression analysis.
- E
Relative CHIKV‐Nanoluciferase infection efficiency in siRNA‐transfected U87‐MG cells (Nanoluciferase activity 24 h post infection). Multiple linear regression analysis.
- F
WT CHIKV infection efficiency in control (−) and IFN‐treated (+), siRNA‐transfected U87‐MG cells analyzed by RT‐qPCR on genomic RNA. Two‐way ANOVA on log‐transformed data with Dunnett's test.
- G
Viral production in cell supernatants from U87‐MG cells with WT CHIKV (24 h post‐infection, MOI 1) measured by plaque assays. Two‐way ANOVA on log‐transformed data with Dunnett's test.
- H
CTRL and IRF9/STAT1 KO U87‐MG/CD4/CXCR4 cells were pre‐treated or not with IFN for 24 h and infected with CHIKV‐NLuc. Infection efficiency was assessed 24 h later by measuring Nanoluciferase activity. Two‐way ANOVA on log‐transformed data with Dunnett's test.
- I
Relative WT SARS‐CoV‐2 infection in siRNA‐transfected A549‐ACE2 cells (RdRp RT‐qPCR 48 h post‐infection). Mixed‐effects analysis on log‐transformed data with Dunnett's test.
- J
Viral production in A549‐ACE2 cell supernatants from I (48 h post‐infection, MOI 0.05) measured by plaque assays. Two‐way ANOVA on log‐transformed data with Dunnett's test.
- K
Relative HCoV‐229E‐Renilla infection efficiency in siRNA‐transfected Huh7.5.1 cells (Renilla activity 24 h post infection). Two‐way ANOVA on log‐transformed data with Dunnett's test.
- L
CTRL and IRF9/STAT1 KO A549‐ACE2 cells were pre‐treated or not with IFN for 24 h and infected with SARS‐CoV‐2‐Nanoluciferase. Infection efficiency was assessed 24 h later by measuring Nanoluciferase activity. Two‐way ANOVA on log‐transformed data with Dunnett's test.
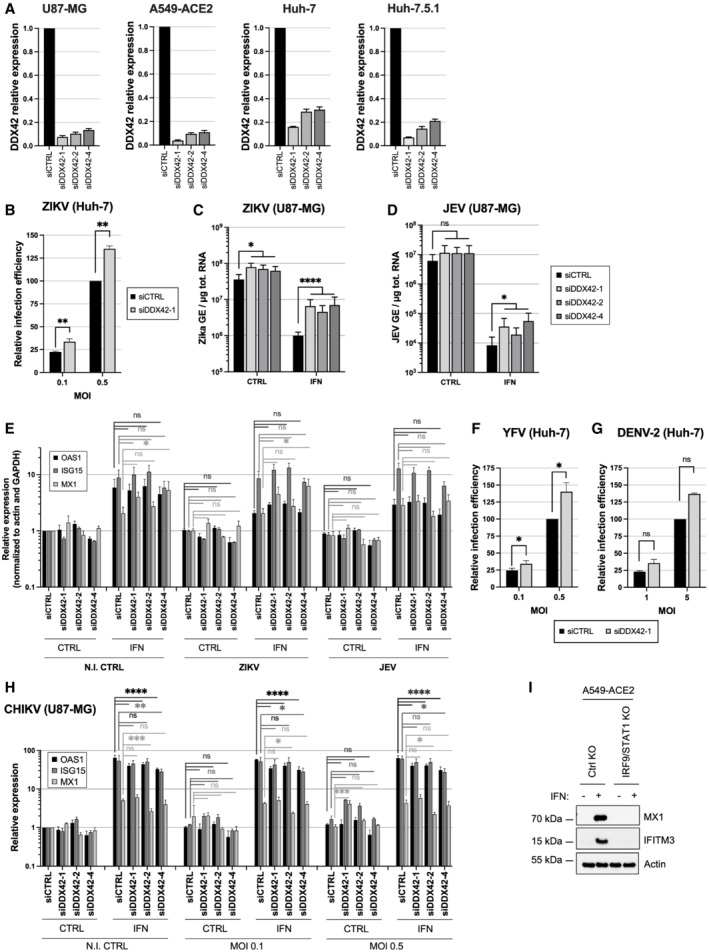
- A
DDX42 silencing efficiency in U87‐MG, A549‐ACE2, Huh‐7 and Huh‐7.5.1 cells.
- B
Relative ZIKV PF13 infection efficiency in siRNA‐transfected Huh‐7 cells analyzed by flow cytometry. Two‐way ANOVA with Sidak's test on log‐transformed data.
- C
ZIKV PF13 infection efficiency in control (CTRL) and IFN‐treated, siRNA‐transfected U87‐MG cells analyzed by RT‐qPCR and expressed as genome equivalents (GE) per μg of total cellular RNA. Two‐way ANOVA with Sidak's test on log‐transformed data.
- D
JEV infection efficiency in control (CTRL) and IFN‐treated, siRNA‐transfected U87‐MG cells analyzed by RT‐qPCR by RT‐qPCR and expressed as genome equivalents (GE) per μg of total cellular RNA. Two‐way ANOVA with Sidak's test on log‐transformed data.
- E
Relative expression of the ISGs OAS1, ISG15, and MX1 (normalized to actin and GAPDH) measured by RT‐qPCR in parallel samples from (C) and (D). Two‐way ANOVA with Dunnett's test.
- F
Relative YFV infection efficiency in siRNA‐transfected Huh‐7 cells analyzed by flow cytometry. Two‐way ANOVA with Sidak's test on log‐transformed data.
- G
Relative DENV‐2 infection efficiency in siRNA‐transfected Huh‐7 cells analyzed by flow cytometry. Two‐way ANOVA with Sidak's test on log‐transformed data.
- H
Relative expression of the ISGs OAS1, ISG15, and MX1 (normalized to actin and GAPDH) measured by RT‐qPCR in parallel samples from Fig 4F. Two‐way ANOVA with Dunnett's test.
- I
CTRL and IRF9/STAT1 KO A549‐ACE2 cells were pre‐treated or not with IFN for 24 h and lysed for immunoblot analysis to measure MX1 and IFITM3 induction, Actin served as a loading control. A representative immunoblot is shown.
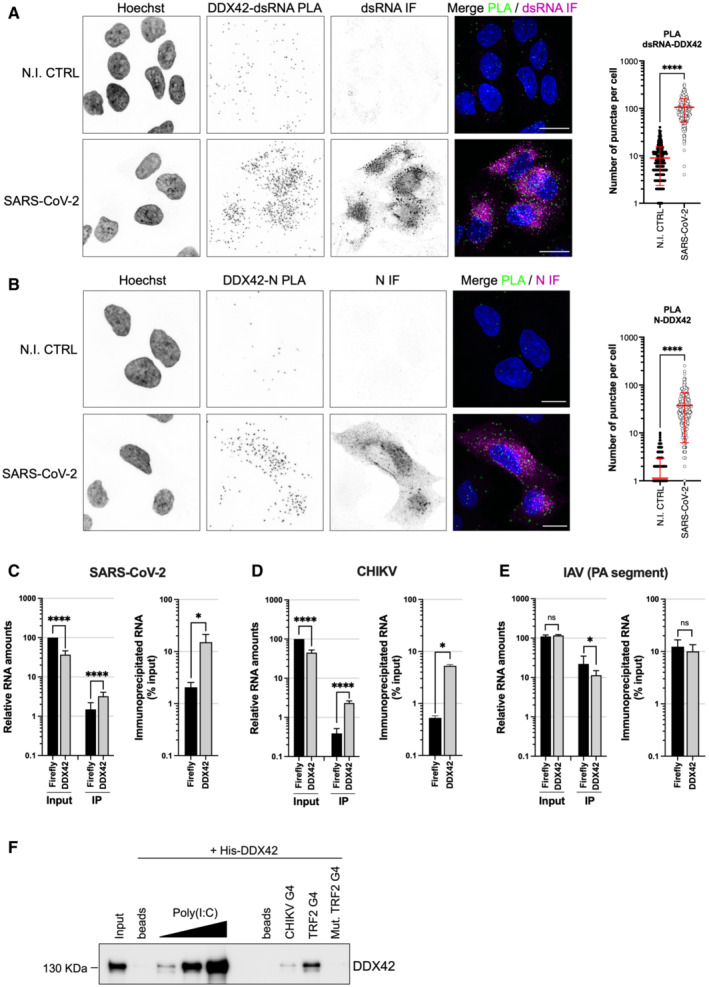
- A, B
(A) Left, A549‐ACE2 cells were infected or not with SARS‐CoV‐2 for 24 h prior to PLA using mouse anti‐dsRNA (J2) and rabbit anti‐DDX42 antibodies, followed by additional immunofluorescence (IF) staining with anti‐mouse Alexa Fluor 546 antibody (PLA in green, IF in magenta). Representative Z‐stack projection images are shown; scale bar: 15 μm. Right, Average punctae were quantified in 3 biological replicates with mean ± SD (n > 75 cells per condition). Mann–Whitney test. (B) Identical to A but using an anti‐N antibody instead of anti‐dsRNA antibody.
- C–E
(C) Left, Quantification of SARS‐CoV‐2 RNA by RT‐qPCR in RNA from total U87‐MG‐ACE2 cell lysates (input) and in Flag‐Firefly (negative control) and Flag‐DDX42 immunoprecipitation (IP). Multiple linear regression analysis on log‐transformed data. Right, Percentage of immunoprecipitated RNA. Paired t‐test on log‐transformed data. (D) Identical to C following CHIKV infection of U87‐MG cells. (E) Identical to C following IAV infection of U87‐MG cells.
- F
The following biotinylated RNAs were used to pull‐down recombinant DDX42 (Fig EV3B): poly(I:C), CHIKV G4, TRF2 G4 and a mutated TRF2 G4 sequence (Mut. TRF2 G4), and DDX42 was revealed by an immunoblot. A representative experiment out of 2 biological replicates is shown.

- A
Venn diagram showing the Differentially Expressed Genes (DEGs) overlap between siRNA conditions in U87‐MG cells, A549 cells and DEGs overlapping between U87‐MG and A549 cells using cutoff criteria of log2 fold change (log2FC) > 1 and P value < 0.05.
- B, C
Comparison of the effects of the different siRNAs tested in U87‐MG (B) and A549‐ACE2 (C) cells. For each cell type, pairwise fold‐change comparison of the effect of each siRNA are showed on the scatter plots on the left side. The heatmaps show the median fold‐change of the DEG involved in each pathway for each siRNA tested (right side). Gray boxes refer to non‐significantly enriched pathways.
References
-
- Bainbridge JW, Stephens C, Parsley K, Demaison C, Halfyard A, Thrasher AJ, Ali RR (2001) In vivo gene transfer to the mouse eye using an HIV‐based lentiviral vector; efficient long‐term transduction of corneal endothelium and retinal pigment epithelium. Gene Ther 8: 1665–1668 - PubMed
Publication types
MeSH terms
Substances
Associated data
- Actions
LinkOut - more resources
Full Text Sources
Molecular Biology Databases
Research Materials
Miscellaneous
