

Temperature Profiles of Sunlight-Exposed Surfaces in a Desert Climate: Determining the Risk for Pavement Burns
- PMID: 36161490
- PMCID: PMC10211493
- DOI: 10.1093/jbcr/irac136
Temperature Profiles of Sunlight-Exposed Surfaces in a Desert Climate: Determining the Risk for Pavement Burns
Abstract
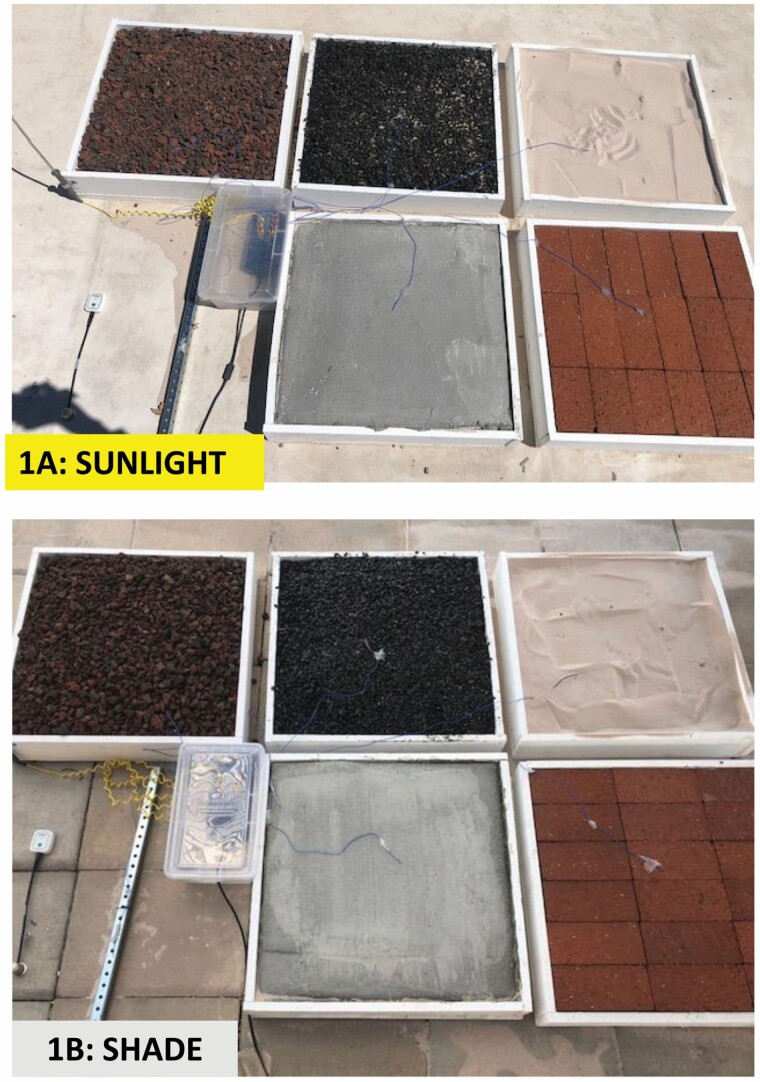
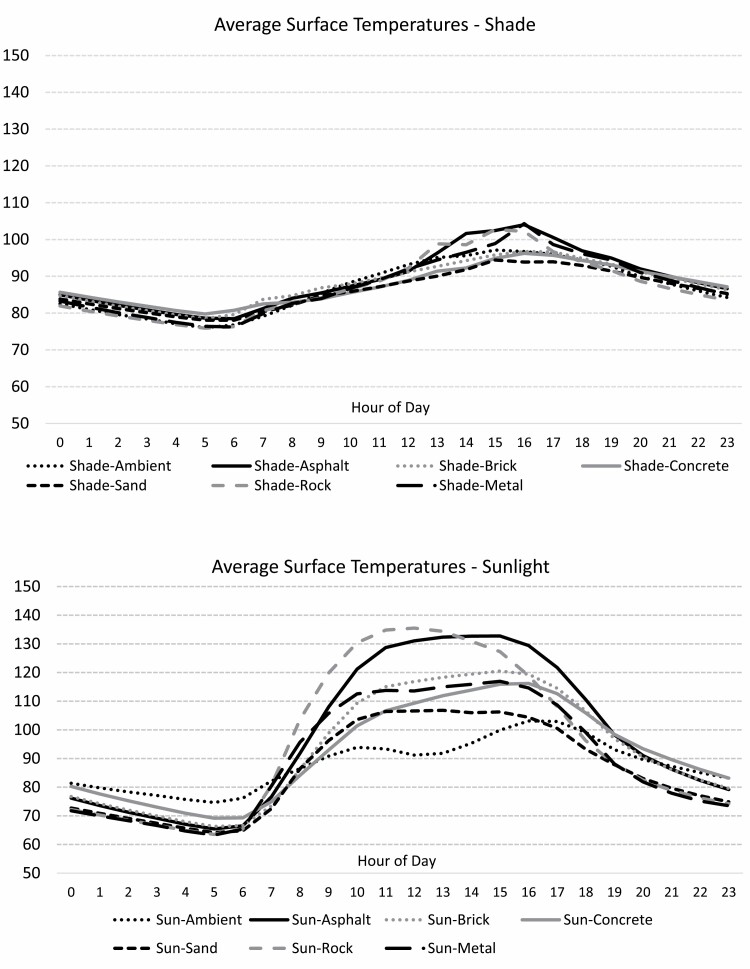
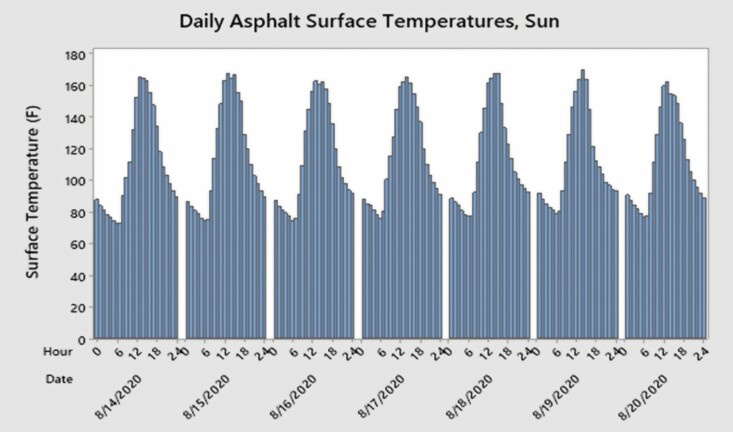
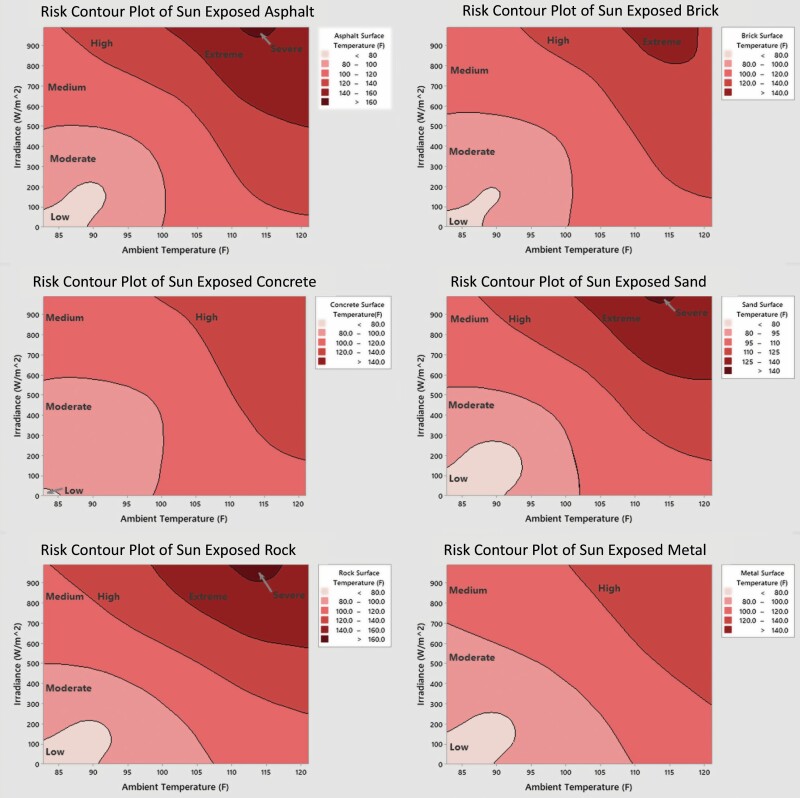
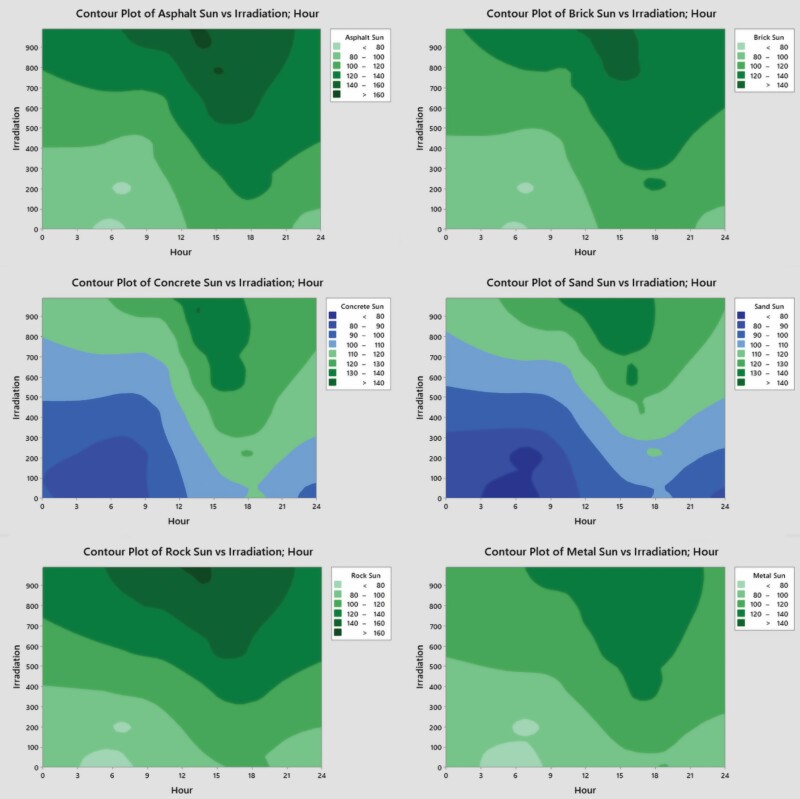
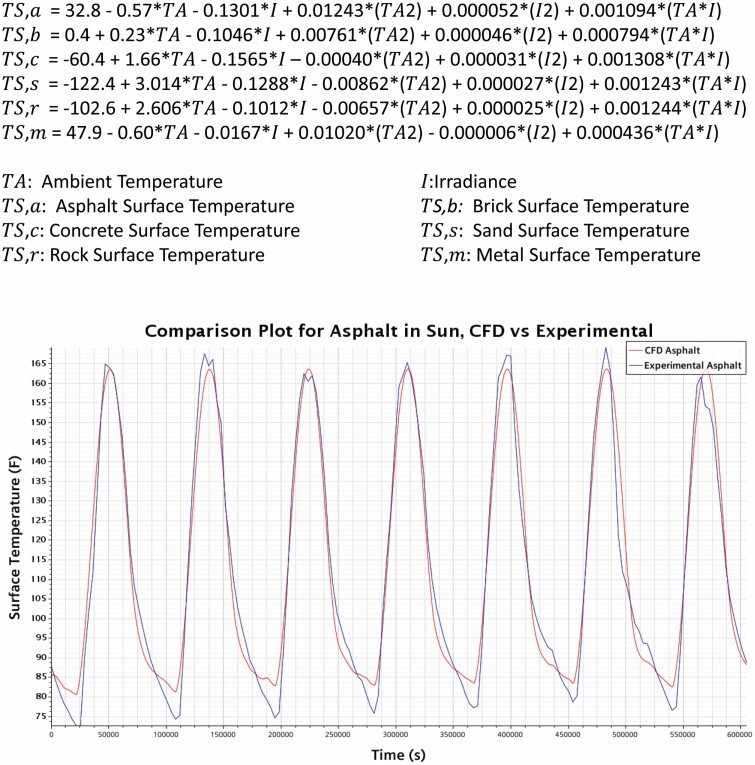
Plentiful sunlight and high temperatures in desert climates cause burn injuries from contact with sun-exposed surfaces. The peak temperature, times, and surfaces of greatest risk are not well described. This work recorded temperature measurements of six materials in a desert climate. Surface temperatures of asphalt, brick, concrete, sand, porous rock, and galvanized metal were measured throughout the summer, along with ambient temperature, and sunlight intensity. Samples were placed in both shade and direct sunlight for evaluation of sunlight effect. Seventy-five thousand individual measurements were obtained from March to August 2020. Maximum recorded temperatures for sunlight-exposed porous rock were 170°F, asphalt 166°F, brick 152°F, concrete 144°F, metal 144°F, and sand 143°F, measured on August 6, 2020 at 2:10 pm, when ambient temperature was 120°F and solar irradiation 940 W/m2. Sunlight-exposed materials ranged 36 to 56°F higher than shaded materials measured at the same time. The highest daily temperatures were achieved between 2:00 and 4:00 pm due to maximum solar irradiance. Contour plots of surface temperature as a function of both solar irradiation and time of day were created for all materials tested. A computational fluid dynamics model was created to validate the data and serve as a predictive model based upon temperature and sunlight inputs. This information is useful to inform the public of the risks of contact burn due to sunlight-exposed surfaces in a desert climate.
© The Author(s) 2022. Published by Oxford University Press on behalf of the American Burn Association. All rights reserved. For permissions, please e-mail: journals.permissions@oup.com.
Figures
Similar articles
-
A 5-Year Review of Pavement Burns From a Desert Burn Center.J Burn Care Res. 2019 Jun 21;40(4):422-426. doi: 10.1093/jbcr/irz049. J Burn Care Res. 2019. PMID: 31220264
-
Pavement Burns Treated at a Desert Burn Center: Analysis of Mechanisms and Outcomes.J Burn Care Res. 2020 Sep 23;41(5):951-955. doi: 10.1093/jbcr/iraa080. J Burn Care Res. 2020. PMID: 32442257
-
Variation of surface temperatures of different ground materials on hot days: Burn risk for the neuropathic foot.Burns. 2016 Mar;42(2):453-6. doi: 10.1016/j.burns.2015.08.026. Epub 2016 Jan 12. Burns. 2016. PMID: 26797153
-
Summer, sun and sepsis-The influence of outside temperature on nosocomial bloodstream infections: A cohort study and review of the literature.PLoS One. 2020 Jun 19;15(6):e0234656. doi: 10.1371/journal.pone.0234656. eCollection 2020. PLoS One. 2020. PMID: 32559761 Free PMC article. Review.
-
Global warming 2007. An update to global warming: the balance of evidence and its policy implications.ScientificWorldJournal. 2007 Mar 9;7:381-99. doi: 10.1100/tsw.2007.91. ScientificWorldJournal. 2007. PMID: 17370024 Free PMC article. Review.
Cited by
-
TRPA5 encodes a thermosensitive ankyrin ion channel receptor in a triatomine insect.iScience. 2024 Mar 20;27(4):109541. doi: 10.1016/j.isci.2024.109541. eCollection 2024 Apr 19. iScience. 2024. PMID: 38577108 Free PMC article.
-
Exploring Disparities in Pavement Burns: A Comparative Analysis of Housed and Unhoused Burn Patients.Eur Burn J. 2025 Jul 1;6(3):38. doi: 10.3390/ebj6030038. Eur Burn J. 2025. PMID: 40700334 Free PMC article.
-
Primary and Secondary Organic Aerosol Formation from Asphalt Pavements.Environ Sci Technol. 2023 Dec 5;57(48):20034-20042. doi: 10.1021/acs.est.3c06037. Epub 2023 Nov 6. Environ Sci Technol. 2023. PMID: 37931038 Free PMC article.
-
Variation in near-surface soil temperature drives plant assemblage differentiation across aspect.Ecol Evol. 2024 Jul 24;14(7):e11656. doi: 10.1002/ece3.11656. eCollection 2024 Jul. Ecol Evol. 2024. PMID: 39055775 Free PMC article.
-
The Individual-Level and Community-Level Social Determinants of Burn Injuries: A Single-Institution Study From the Southwestern United States.J Burn Care Res. 2025 Mar 4;46(2):307-317. doi: 10.1093/jbcr/irae131. J Burn Care Res. 2025. PMID: 38970618 Free PMC article.
References
-
- Pruitt BA, Wolf SE, Mason, JrAD. Epidemiological, demographic, and outcome characteristics of burn injury. Total Burn Care, 4th ed. 2012. p. 15–45. Elsevier, New York.
-
- Saquib SF, Carroll JT, Chestovich PJ. Seasonal impact in admissions and burn profiles in a desert burn unit. Burns Open 2021;5:45–49.
-
- Vega J, Chestovich P, Saquib S, Fraser D. A 5-year review of pavement burns from a desert burn center. J Burn Care Res 2019;40:422–6. - PubMed
-
- Sinha M, Salness R, Foster Ket al. Accidental foot burns in children from contact with naturally heated surfaces during summer months: experience from a regional burn center. J Trauma 2006;61:975–8. - PubMed
-
- Eisenberg MT, Saquib SF, Chestovich P. Pavement burns treated at a Desert Burn Center: analysis of mechanisms and outcomes. J Burn Care Res 2020;41:951–5. - PubMed
Publication types
MeSH terms
Substances
Grants and funding
LinkOut - more resources
Full Text Sources
Medical
