

The molecular architecture of cell cycle arrest
- PMID: 36161508
- PMCID: PMC9511499
- DOI: 10.15252/msb.202211087
The molecular architecture of cell cycle arrest
Abstract
The cellular decision governing the transition between proliferative and arrested states is crucial to the development and function of every tissue. While the molecular mechanisms that regulate the proliferative cell cycle are well established, we know comparatively little about what happens to cells as they diverge into cell cycle arrest. We performed hyperplexed imaging of 47 cell cycle effectors to obtain a map of the molecular architecture that governs cell cycle exit and progression into reversible ("quiescent") and irreversible ("senescent") arrest states. Using this map, we found multiple points of divergence from the proliferative cell cycle; identified stress-specific states of arrest; and resolved the molecular mechanisms governing these fate decisions, which we validated by single-cell, time-lapse imaging. Notably, we found that cells can exit into senescence from either G1 or G2; however, both subpopulations converge onto a single senescent state with a G1-like molecular signature. Cells can escape from this "irreversible" arrest state through the upregulation of G1 cyclins. This map provides a more comprehensive understanding of the overall organization of cell proliferation and arrest.
Keywords: cell cycle; proliferation; quiescence; senescence; single-cell.
©2022 The Authors. Published under the terms of the CC BY 4.0 license.
Figures
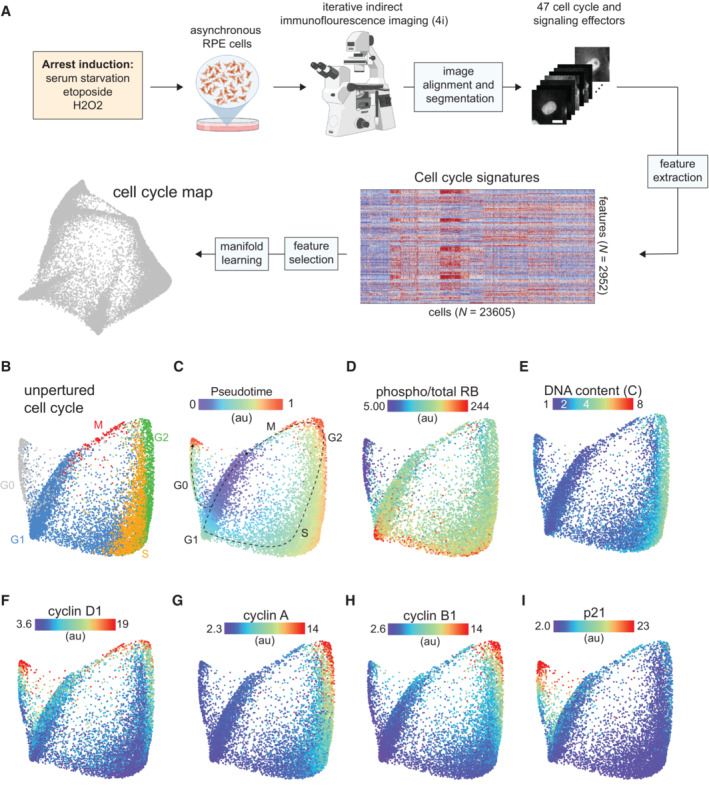
- A
Schematic of the experimental approach.
- B
Cell cycle map of unperturbed cells (N = 11,268 cells). Proliferative (G1/S/G2/M) and arrested (G0) cell cycle phases were predicted for each cell using a Gaussian‐mixture model and labeled on the map.
- C–I
(C) Diffusion pseudotime values, (D) phospho/total RB, (E) DNA content, (F) cyclin D1, (G) cyclin A, (H) cyclin B1 and (I) p21 of unperturbed cells are plotted on the map. Median nuclear values are shown for (D–I).

- A
Unified cell cycle map of unperturbed (gray) and serum‐starved cells (1 day: light blue, 7 days: dark blue, N = 3,007 cells). The proliferative cell cycle (dotted gray line) and the hypomitogenic arrest trajectory (black dotted line) are indicated on the map. Inset: Each treatment condition is shown individually on the unified map (other conditions are shown in lighter gray).
- B–F
(B) Diffusion pseudotime, (C) p21, (D) cyclin D1, (E) DNA content and (F) phospho/total RB of unperturbed (left panels) or serum‐starved cells (right panels) are plotted on the map.
- G
Time‐lapse imaging of cyclinD1‐mVenus intensity in unperturbed (control, green) and serum‐starved cells (blue). Cells were serum‐starved for at least 8 h prior to imaging. The solid line represents the population median and the shaded area indicates the 95% confidence interval. N = 105 control cells and N = 111 starved cells.
- H
Heatmap of feature intensity along the hypomitogenic arrest trajectory. Features were ordered by hierarchical clustering according to their dynamics along the arrest trajectory. Diffusion pseudotime values were binned and pseudotime values with < 15 cells were excluded from the visualization.
- I
Median nuclear p27 abundance in serum‐starved cells is plotted on the map.

Left: Distribution of nuclear intensity ratios of phospho/total RB in unperturbed RPE cells. A threshold value of 0.7 was used to label cells as arrested (low phospho/total RB) or actively cycling (high phospho/total RB). Right: Cycling and arrested labels are overlaid on the cell cycle map.
Cells from three technical replicates are labeled on the cell cycle map.

- A
Unified cell cycle map of unperturbed (gray) and etoposide‐treated cells (1 μM; 1 day: light green, 2 days: green, 3 days: dark green, 4 days: darker green – see inset, N = 4,315 cells). The unperturbed cell cycle trajectory (dotted gray line) and two arrest trajectories (into G02C and G04C; black dotted lines) are indicated on the map. Inset: Each condition is shown individually on the map (other conditions are shown in lighter gray).
- B–E
(B) Diffusion pseudotime, (C) DNA content, (D) phospho/total RB and (E) p21 of unperturbed (left panels) or etoposide‐treated cells (right panels) are plotted on the arrest architecture. Median nuclear values are shown.
- F
Time‐lapse imaging of CDK2 activity (DHB‐mCherry, gray) and p21‐YPet (green) intensity in etoposide‐treated cells. Schematic shows the two arrest trajectories observed following etoposide treatment. Cells that successfully complete G2 (“Mothers,” N = 32 cells) but arrest following cell division (“Daughters,” N = 45 cells) are shown in the two leftmost panels. Cells that arrest in G2 (N = 40 cells) are shown in the rightmost panel. The solid lines represent population medians and the shaded area indicates the 95% confidence interval.
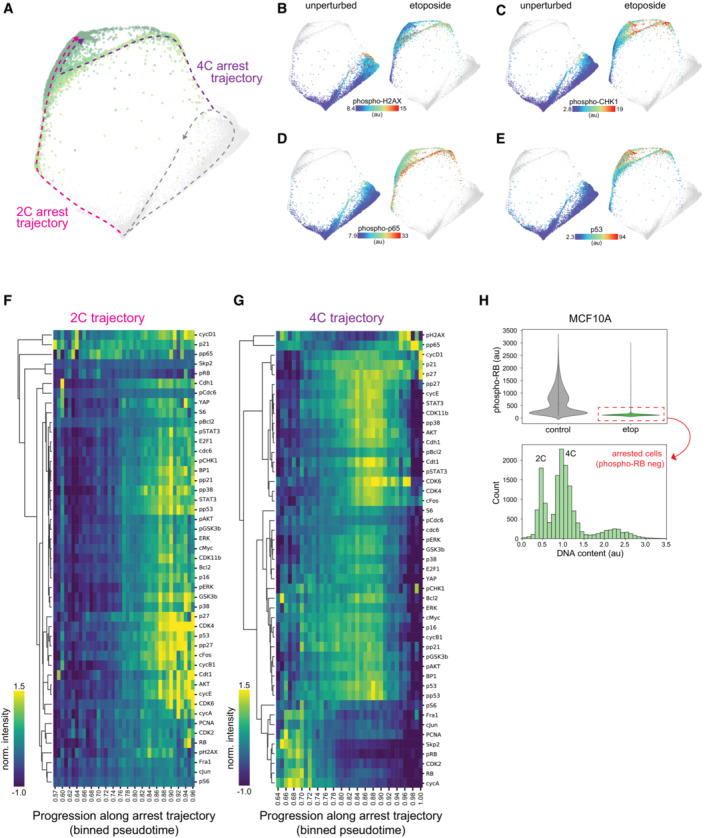
- A
Cell cycle map arrest of unperturbed (gray) and etoposide‐treated cells (1 μM; 1 day: light green, 2 days: green, 3 days: dark green, 4 days: darker green). The unperturbed cell cycle (dotted gray line) and two arrest trajectories (into 2C and 4C, pink and purple, respectively) are indicated on the map.
- B–E
(B) Phospho‐H2AX, (C) phospho‐CHK1, (D) phospho‐p65 and (E) p53 of unperturbed (left panels) or etoposide‐treated cells (right panels) are plotted on the arrest architecture. Median nuclear values are shown.
- F, G
Heatmap of feature intensity along the (F) 2C and (G) 4C arrest trajectories. Features were ordered by hierarchical clustering according to their dynamics along each arrest trajectory. Diffusion pseudotime values were binned and pseudotime values with < 15 cells were excluded from the visualization.
- H
Top: Nuclear phospho‐RB intensities of control and etoposide‐treated MCF10A cells (7 days, 1 μM). Dashed‐red box indicates arrested etoposide‐treated cells (phospho‐RB < 500 au). Bottom: Distribution of DNA content in arrested etoposide‐treated cells. Arrested MCF10A cells were observed with both 2C and 4C DNA content.

- A
Unified cell cycle map arrest of unperturbed (gray) and H2O2‐treated cells (200 μM; 1 day: light purple, 2 days: purple, 3 days: dark purple – see inset, N = 5,015 cells). The unperturbed cell cycle (dotted gray line) and two arrest trajectories (into G02C and G04C; black dotted lines) are indicated on the map. Inset: Each condition is shown individually on the map (other conditions are shown in lighter gray).
- B–G
(B) Phospho‐H2AX, (C) phospho‐CHK1, (D) p53, (E) p21, (F) phospho/total RB and (G) DNA content of unperturbed (left panels) or H2O2‐treated cells (right panels) are plotted on the arrest architecture. Median nuclear values are shown for B‐F.
- H, I
Distribution of (H) phospho‐H2AX and (I) phospho/total RB in individual cells following etoposide (1 μM) or H2O2 treatment (200 μM).

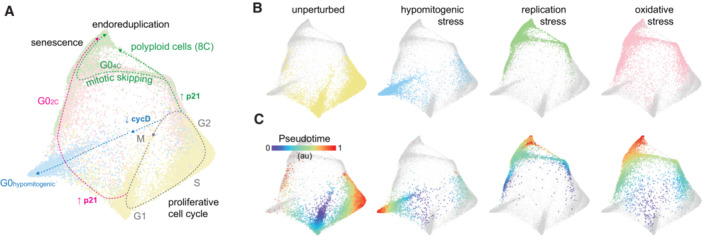
- A
Arrest architecture of replicative stress. 2C and 4C arrest trajectories are shown, the regions that correspond to mitotic skipping and the senescent state are annotated and the arrest trajectory of 8C polyploid cells is indicated. N = 4,315 cells.
- B
Progression of arrest states over time following etoposide treatment. Etoposide‐treated cells (upper panel: colored by condition, lower panel: colored by DNA content) populating 2C, 4C, 8C and senescent arrest states at each day of treatment (1–4 days).
- C
Distribution of senescence‐associated β‐galactosidase (SA‐βgal) activity in individual cells following etoposide treatment (1 μM, 0–4 days).
- D–K
(D) GSK3β, (E) phospho(Thr157)‐p27, (F) p27, (G) CDK4, (H) cyclin D1, (I) cyclin E, (J) cell area and (K) DNA:cytoplasm ratio of etoposide‐treated cells are plotted on the map. Median nuclear values are shown in D‐I. Area indicated with a dotted line represents the senescent region of the map.
- L–O
(L) Cyclin A, (M) cyclin B1, (N) CDH1 and (O) SKP2 of etoposide‐treated cells are plotted on the map. Median nuclear values are shown. Area indicated with a dotted line shows the trajectory of mitotic skipping and transition into senescence.

- A
Distribution of senescence‐associated β‐galactosidase (SA‐βgal) activity in individual cells following etoposide or palbociclib treatment (1 μM, 4/8 days). Control: N = 6,050 cells, etop 4 days: N = 409 cells, etop 8 days: N = 732 cells, palbo 4 days: N = 1837 cells, palbo 8 days: N = 1,677 cells. Statistical significance was determined using a one‐way analysis of variance (ANOVA) with Sidak's post hoc test (***P < 0.0001).
- B
Unified cell cycle map of the unperturbed (gray), palbociclib‐ (palbo, 1 μM, 4/8 days, blue) and etoposide‐ (etop,1 μM, 4/8 days, green) treated cells. Control: N = 10,499 cells, etop: N = 2,692 cells, palbo: N = 4,931 cells.
- C–K
(C) DNA content, (D) phospho/total RB, (E) p16, (F) TGFβ1, (G) IL‐6, (H) IL‐8, (I) phospho‐p38, (J) phospho‐STAT3 and (K) phospho‐STAT5 are plotted on the map. Median nuclear values are shown.

- A–L
(A) RPE cells with ≥4C DNA content were selected using the intensity of nuclear Hoechst staining. Cyclin A versus cyclin D1 intensity was plotted for each cell and overlaid with (B) condition labels (control vs. etoposide), (C) phospho‐RB intensity and (D) senescence‐associated β‐galactosidase (SA‐βgal) activity. The same analysis as above was performed on (E–H) MCF10A and (I–L) U‐2 OS cells.
- M
Distribution of DNA content in control (blue) and etoposide‐treated (green, 7 days, 1 μM) MCF10A cells. The percent of polyploid cells with DNA content = 8C is shown for both conditions.

- A
Arrest architecture of replicative stress. The trajectory of endoreduplication following cell cycle arrest and mitotic skipping indicated.
- B, C
(B) CDT1 and (C) E2F1 are plotted on the map. Dotted line indicates the trajectory to endoreduplication. Median nuclear values are shown.
- D
Representative single‐cell trace demonstrating mitotic skipping and endoreduplication following etoposide treatment (1 μM) by time‐lapse imaging. CDK2 activity (DHB‐mCherry, blue), cell cycle phase (PCNA‐mTq2, S phase shown as gray shaded area) and p21‐YPet intensity (green) are plotted versus time of etoposide treatment.
- E
Cyclin D1 abundance (left) and the proportion of polyploid cells (right), as measured by immunofluorescence and Hoechst staining, respectively, following siRNA‐mediated knockdown of cyclin D in control and etoposide‐treated cells. Boxplots show data from four independent replicates (gray circles).
- F
Cyclin D1 abundance (left) and the proportion of polyploid cells (right), as measured by immunofluorescence and Hoechst staining, respectively, following doxycycline (dox)‐induced upregulation of cyclin D1 in control and etoposide‐treated cells. Boxplots show data from six independent replicates (gray circles).
- G
Cyclin A abundance (left) and the proportion of polyploid cells (right), as measured by immunofluorescence and Hoechst staining, respectively, following doxycycline (dox)‐induced upregulation of cyclin A2 in control and etoposide‐treated cells. Boxplots show data from six independent replicates (gray circles).

- A
Unified cell cycle map of unperturbed (control 2, gray) and palbociclib‐treated cells (gold) from a separate experiment, plotted with unperturbed (control 1: light blue, from original experiment), serum‐starved (blue) etoposide‐ (etop, green) and H2O2‐treated (magenta) cells from initial experiment. Data integration is described in Materials and Methods.
- B–F
(B) p27, (C) phospho‐p65, (D) phospho‐AKT, (E) phospho‐BCL2 and (F) SMAD2 are plotted on the map. Median nuclear values are shown. Dotted area indicates senescent region.
- A, B
Summary map of cell cycle arrest. Unperturbed (yellow), serum‐starved (blue), etoposide‐ (green) and H2O2‐treated (pink) cells are plotted on a (A) single map. (B) Each condition is shown individually on the map (other conditions are shown in lighter gray). Inferred trajectories of the proliferative cell cycle and all arrest trajectories are shown.
- C
Diffusion pseudotime is plotted onto the map of each condition.
References
-
- Binné UK, Classon MK, Dick FA, Wei W, Rape M, Kaelin WG Jr, Näär AM, Dyson NJ (2007) Retinoblastoma protein and anaphase‐promoting complex physically interact and functionally cooperate during cell‐cycle exit. Nat Cell Biol 9: 225–232 - PubMed
-
- Choi M, Shi J, Jung SH, Chen X, Cho K‐H (2012) Attractor landscape analysis reveals feedback loops in the p53 network that control the cellular response to DNA damage. Sci Signal 5: ra83 - PubMed
Publication types
MeSH terms
Substances
Grants and funding
LinkOut - more resources
Full Text Sources
