

Segregation, integration and balance in resting-state brain functional networks associated with bipolar disorder symptoms
- PMID: 36161679
- PMCID: PMC9842930
- DOI: 10.1002/hbm.26087
Segregation, integration and balance in resting-state brain functional networks associated with bipolar disorder symptoms
Abstract
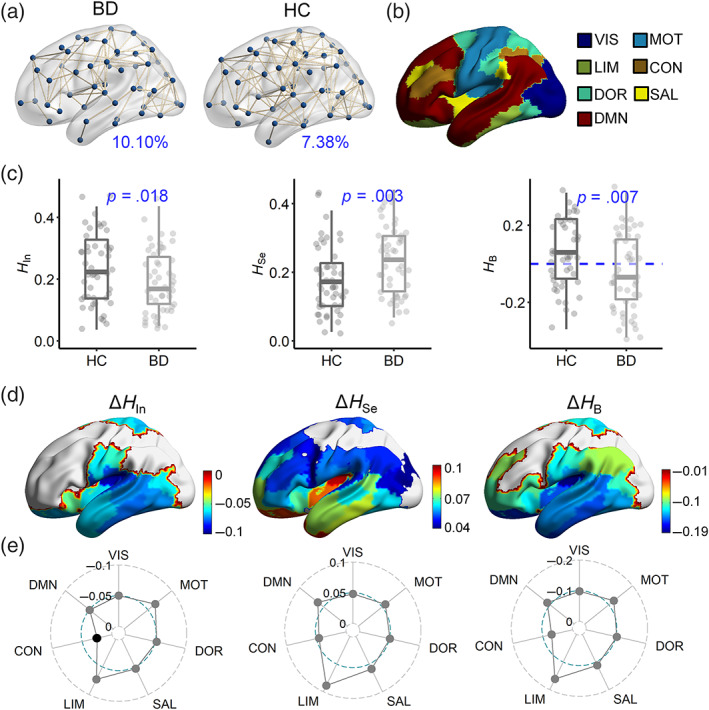
Bipolar disorder (BD) is a serious mental disorder involving widespread abnormal interactions between brain regions, and it is believed to be associated with imbalanced functions in the brain. However, how this brain imbalance underlies distinct BD symptoms remains poorly understood. Here, we used a nested-spectral partition (NSP) method to study the segregation, integration, and balance in resting-state brain functional networks in BD patients and healthy controls (HCs). We first confirmed that there was a high deviation in the brain functional network toward more segregation in BD patients than in HCs and that the limbic system had the largest alteration. Second, we demonstrated a network balance of segregation and integration that corresponded to lower anxiety in BD patients but was not related to other symptoms. Subsequently, based on a machine-learning approach, we identified different system-level mechanisms underlying distinct BD symptoms and found that the features related to the brain network balance could predict BD symptoms better than graph theory analyses. Finally, we studied attention-deficit/hyperactivity disorder (ADHD) symptoms in BD patients and identified specific patterns that distinctly predicted ADHD and BD scores, as well as their shared common domains. Our findings supported an association of brain imbalance with anxiety symptom in BD patients and provided a potential network signature for diagnosing BD. These results contribute to further understanding the neuropathology of BD and to screening ADHD in BD patients.
Keywords: bipolar disorder; calibrated; fMRI; functional balance; functional connectivity; nested-spectral partition.
© 2022 The Authors. Human Brain Mapping published by Wiley Periodicals LLC.
Figures


References
-
- Ahrendts, J. , Rüsch, N. , Wilke, M. , Philipsen, A. , Eickhoff, S. B. , Glauche, V. , Perlov, E. , Ebert, D. , Hennig, J. , & Tebartz van Elst, L. (2011). Visual cortex abnormalities in adults with ADHD: A structural MRI study. The World Journal of Biological Psychiatry, 12, 260–270. - PubMed
-
- Akiskal, H. S. , Maser, J. D. , Zeller, P. J. , Endicott, J. , Coryell, W. , Keller, M. , Warshaw, M. , Clayton, P. , & Goodwin, F. (1995). Switching from'unipolar' to bipolar ii: An 11‐year prospective study of clinical and temperamental predictors in 559 patients. Archives of General Psychiatry, 52, 114–123. - PubMed
-
- Association, A.P . (2013). Diagnostic and statistical manual of mental disorders: DSM‐5 (5th ed.). American Psychiatric Association.
-
- Bell, C. C. (1994). DSM‐IV: Diagnostic and statistical manual of mental disorders. JAMA, 272, 828–829.
-
- Biederman, J. , Makris, N. , Valera, E. , Monuteaux, M. , Goldstein, J. , Buka, S. , Boriel, D. , Bandyopadhyay, S. , Kennedy, D. , & Caviness, V. (2008). Towards further understanding of the co‐morbidity between attention deficit hyperactivity disorder and bipolar disorder: A MRI study of brain volumes. Psychological Medicine, 38, 1045–1056. - PubMed
