. 2022 Nov;30(11):2294-2306.
doi: 10.1002/oby.23549. Epub 2022 Sep 25.

Plasma metabolomic signatures of obesity and risk of type 2 diabetes

Affiliations

Plasma metabolomic signatures of obesity and risk of type 2 diabetes

Xiong-Fei Pan et al. Obesity (Silver Spring). 2022 Nov.

Abstract

Objective: The mechanisms linking obesity to type 2 diabetes (T2D) are not fully understood. This study aimed to identify obesity-related metabolomic signatures (MESs) and evaluated their relationships with incident T2D.

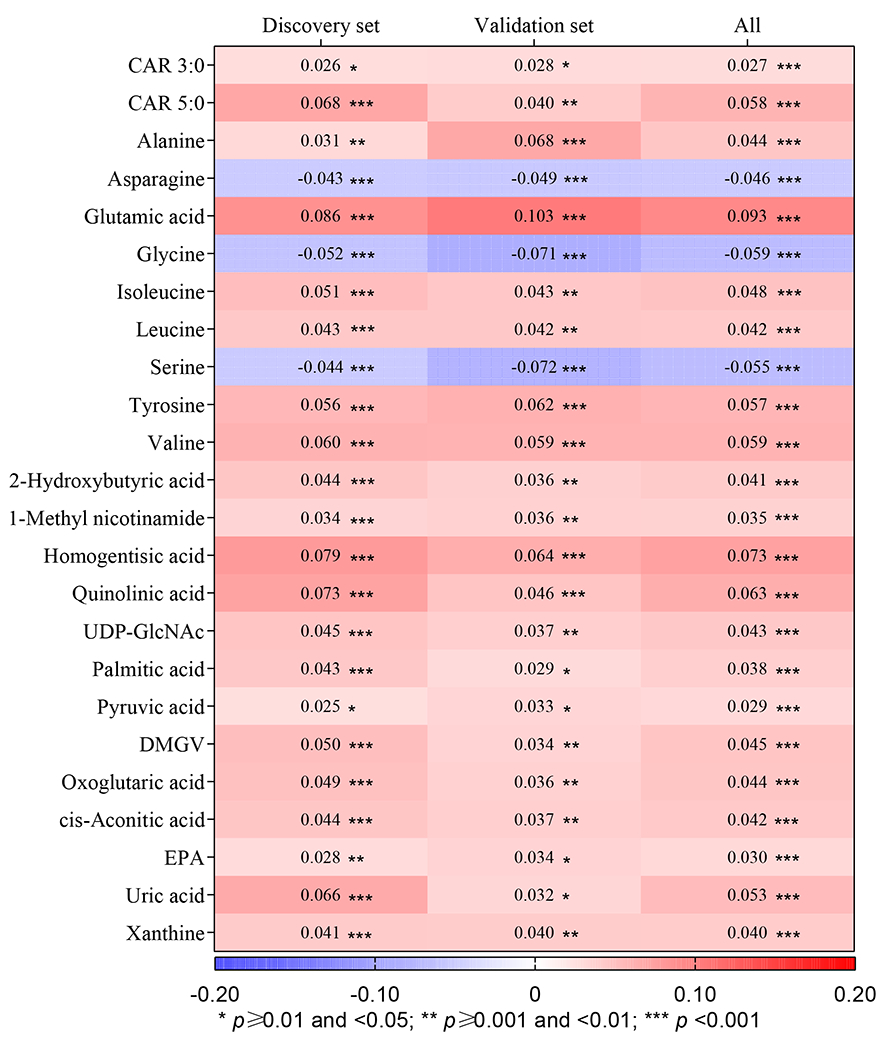
Methods: In a nested case-control study of 2076 Chinese adults, 140 plasma metabolites were measured at baseline, linear regression was applied with the least absolute shrinkage and selection operator to identify MESs for BMI and waist circumference (WC), and conditional logistic regression was applied to examine their associations with T2D risk.

Results: A total of 32 metabolites associated with BMI or WC were identified and validated, among which 14 showed positive associations and 3 showed inverse associations with T2D; 8 and 18 metabolites were selected to build MESs for BMI and WC, respectively. Both MESs showed strong linear associations with T2D: odds ratio (95% CI) comparing extreme quartiles was 4.26 (2.00-9.06) for BMI MES and 9.60 (4.22-21.88) for WC MES (both p-trend < 0.001). The MES-T2D associations were particularly evident among individuals with normal WC: odds ratio (95% CI) reached 6.41 (4.11-9.98) for BMI MES and 10.38 (6.36-16.94) for WC MES. Adding MESs to traditional risk factors and plasma glucose improved C statistics from 0.79 to 0.83 (p < 0.001).

Conclusions: Multiple obesity-related metabolites and MESs strongly associated with T2D in Chinese adults were identified.


Conflict of interest statement

Disclosure

No potential conflicts of interest relevant to this article were reported.

Figures

Figure 1
Figure 1. Flowchart of study procedures.
Abbreviations: BMI, body mass index; MES, metabolomic signature; T2D, type 2 diabetes; WC, waist circumference
Figure 2.
Figure 2.. Change in the metabolite z-score for each 1-kg/m2 increase of body mass index.
Abbreviations: CAR, carnitine; CNY, Chinese Yuan; DMGV, dimethylguanidino valeric acid; EPA, eicosapentaenoic acid; FDR, false discovery rate; MET, metabolic equivalent of task; T2D, type 2 diabetes; UDP-GlcNAc, uridine diphosphate N-acetylglucosamine. The associations of body mass index with individual plasma metabolites were assessed using generalized linear models, with adjustment for study batch (only in the pooled sample), sex, age (years, continuous), total energy intake (kcal/day, continuous), incident T2D case-control status (yes and no), fasting hours (continuous), income [annual household income <10,000 CNY, ≥10,000 to <20,000 CNY, ≥20,000 to <30,000 CNY, and ≥30,000 CNY in the SWHS; annual personal income <6,000 CNY, ≥6,000 to <12,000 CNY, ≥12,000 to <24,000 CNY, and ≥24,000 CNY in the SMHS], cigarette smoking (never, former, and current), pack-years among smokers (continuous), alcohol drinking [none, moderate (>0 to ≤2 drinks per day in men or >0 to ≤1 drink per day in women), and heavy drinking (>2 drinks per day in men or >1 drink per day in women); 1 drink = 14 g ethanol], physical activity (continuous, MET-hours/week), diet quality (as measured by a healthy diet index), menopause status (yes and no, for women only), and hypertension status (yes and no). βs with FDR-adjusted p values are presented in the figure.
Figure 3.
Figure 3.. Change in the metabolite z-score for each 1-cm increase of waist circumference.
Abbreviations: CAR, carnitine; DMGV, dimethylguanidino valeric acid; EPA, eicosapentaenoic acid; FDR, false discovery rate; T2D, type 2 diabetes; UDP-GlcNAc, uridine diphosphate N-acetylglucosamine. The associations of waist circumference with individual plasma metabolites were assessed using generalized linear models, with adjustment for study batch (only in the pooled sample), sex, age, total energy intake, incident T2D case-control status, fasting hours, income, cigarette smoking, pack-years among ever smokers, alcohol drinking, physical activity, diet quality, menopause status (for women only), and hypertension status. βs with FDR-adjusted p values are presented in the figure.
Figure 4.
Figure 4.. Association between individual obesity-related metabolites and risk of type 2 diabetes.
Abbreviations: BMI, body mass index; CAR, carnitine; CI, confidence interval; DMGV, dimethylguanidino valeric acid; EPA, eicosapentaenoic acid; FA, fatty acid; FDR, false discovery rate; OR, odds ratio; rNDP, ribonucleotide diphosphate reductase; TCA, tricarboxylic acid; UDP-GlcNAc, uridine diphosphate N-acetylglucosamine. The associations of individual plasma metabolites with type 2 diabetes were assessed using conditional logistic regression, adjusting for study batch, sex, age, total energy intake, fasting hours, income, cigarette smoking, pack-years among ever smokers, alcohol drinking, physical activity, diet quality, BMI, menopause status, hypertension status, and family history of diabetes.
Figure 5.
Figure 5.. Predictive performance of obesity metabolomic signatures for risk of type 2 diabetes.
Abbreviations: BMI, body mass index; MES, metabolomic signature; ROC, receiver operating characteristic; WC, waist circumference. Traditional risk factors included age, sex, smoking, pack-years among ever smokers, alcohol drinking, diet quality, physical activity, family history of diabetes, BMI, and WC. Plasma glucose was represented by a composite glucose/fructose/galactose level in the metabolomics data. The prediction performance of obesity MESs alone and in addition to traditional T2D risk factors was assessed by computing the C-statistics (i.e., area under the ROC curve). p≥0.12 for pairwise comparisons in Figure 5A, and p=0.22 for comparison between the first two models, and ≤0.003 for other pairwise comparisons in Figure 5B.

References

    1. International Diabetes Federation. IDF Diabetes Atlas 10th Edition 2021. [cited 2022 May 25]. Available from: https://www.diabetesatlas.org/en/.
    1. Li Y, Teng D, Shi X, Qin G, Qin Y, Quan H, et al. Prevalence of diabetes recorded in mainland China using 2018 diagnostic criteria from the American Diabetes Association: national cross sectional study. BMJ 2020;369: m997. - PMC - PubMed
    1. Rosenthal AD, Jin F, Shu XO, Yang G, Elasy TA, Chow WH, et al. Body fat distribution and risk of diabetes among Chinese women. Int J Obes Relat Metab Disord 2004;28: 594–599. - PubMed
    1. Bragg F, Tang K, Guo Y, Iona A, Du H, Holmes MV, et al. Associations of general and central adiposity with incident diabetes in Chinese men and women. Diabetes Care 2018;41: 494–502. - PMC - PubMed
    1. Pan XF, Wang L, Pan A. Epidemiology and determinants of obesity in China. Lancet Diabetes Endocrinol 2021;9: 373–392. - PubMed

Publication types