Dissection of the long-range projections of specific neurons at the synaptic level in the whole mouse brain
- PMID: 36161898
- PMCID: PMC9546530
- DOI: 10.1073/pnas.2202536119
Dissection of the long-range projections of specific neurons at the synaptic level in the whole mouse brain
Abstract
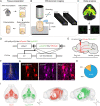
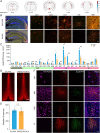
Through synaptic connections, long-range circuits transmit information among neurons and connect different brain regions to form functional motifs and execute specific functions. Tracing the synaptic distribution of specific neurons requires submicron-level resolution information. However, it is a great challenge to map the synaptic terminals completely because these fine structures span multiple regions, even in the whole brain. Here, we develop a pipeline including viral tracing, sample embedding, fluorescent micro-optical sectional tomography, and big data processing. We mapped the whole-brain distribution and architecture of long projections of the parvalbumin neurons in the basal forebrain at the synaptic level. These neurons send massive projections to multiple downstream regions with subregional preference. With three-dimensional reconstruction in the targeted areas, we found that synaptic degeneration was inconsistent with the accumulation of amyloid-β plaques but was preferred in memory-related circuits, such as hippocampal formation and thalamus, but not in most hypothalamic nuclei in 8-month-old mice with five familial Alzheimer's disease mutations. Our pipeline provides a platform for generating a whole-brain atlas of cell-type-specific synaptic terminals in the physiological and pathological brain, which can provide an important resource for the study of the organizational logic of specific neural circuits and the circuitry changes in pathological conditions.
Keywords: Alzheimer's disease; basal forebrain; synapse; synaptophysin; whole brain.
Conflict of interest statement
The authors declare no competing interest.
Figures


Similar articles
-
Long-range inputome of prefrontal GABAergic interneurons in the Alzheimer's disease mouse.Alzheimers Dement. 2025 Feb;21(2):e14552. doi: 10.1002/alz.14552. Epub 2025 Jan 17. Alzheimers Dement. 2025. PMID: 39823141 Free PMC article.
-
Mapping brain-wide excitatory projectome of primate prefrontal cortex at submicron resolution and comparison with diffusion tractography.Elife. 2022 May 20;11:e72534. doi: 10.7554/eLife.72534. Elife. 2022. PMID: 35593765 Free PMC article.
-
Hippocampal Mossy Fibers Synapses in CA3 Pyramidal Cells Are Altered at an Early Stage in a Mouse Model of Alzheimer's Disease.J Neurosci. 2019 May 22;39(21):4193-4205. doi: 10.1523/JNEUROSCI.2868-18.2019. Epub 2019 Mar 18. J Neurosci. 2019. PMID: 30886015 Free PMC article.
-
Synaptic pathology of Alzheimer's disease.Ann N Y Acad Sci. 1993 Sep 24;695:59-64. doi: 10.1111/j.1749-6632.1993.tb23028.x. Ann N Y Acad Sci. 1993. PMID: 8239314 Review.
-
Synaptic Mitochondria: An Early Target of Amyloid-β and Tau in Alzheimer's Disease.J Alzheimers Dis. 2021;84(4):1391-1414. doi: 10.3233/JAD-215139. J Alzheimers Dis. 2021. PMID: 34719499 Review.
Cited by
-
Cross-scale tracing of nanoparticles and tumors at the single-cell level using the whole-lung atlas.Sci Adv. 2023 Aug 2;9(31):eadh7779. doi: 10.1126/sciadv.adh7779. Epub 2023 Aug 2. Sci Adv. 2023. PMID: 37531437 Free PMC article.
-
Dissection of the long-range circuit of the mouse intermediate retrosplenial cortex.Commun Biol. 2025 Jan 15;8(1):56. doi: 10.1038/s42003-025-07463-8. Commun Biol. 2025. PMID: 39814996 Free PMC article.
-
Parvalbumin Neurons in the Basal Forebrain Projecting to the Mammillary Nucleus Ameliorate Age-Related Cognitive Decline.Int J Mol Sci. 2025 Jun 20;26(13):5934. doi: 10.3390/ijms26135934. Int J Mol Sci. 2025. PMID: 40649714 Free PMC article.
-
A dorsal subiculum-medial mammillary body pathway for spatial memory.Mol Psychiatry. 2025 Jun 27. doi: 10.1038/s41380-025-03087-w. Online ahead of print. Mol Psychiatry. 2025. PMID: 40579424
-
From Individual to Population: Circuit Organization of Pyramidal Tract and Intratelencephalic Neurons in Mouse Sensorimotor Cortex.Research (Wash D C). 2024 Oct 7;7:0470. doi: 10.34133/research.0470. eCollection 2024. Research (Wash D C). 2024. PMID: 39376961 Free PMC article.
References
-
- Nusser Z., Hájos N., Somogyi P., Mody I., Increased number of synaptic GABA(A) receptors underlies potentiation at hippocampal inhibitory synapses. Nature 395, 172–177 (1998). - PubMed
-
- Holler S., Köstinger G., Martin K. A. C., Schuhknecht G. F. P., Stratford K. J., Structure and function of a neocortical synapse. Nature 591, 111–116 (2021). - PubMed
Publication types
MeSH terms
Substances
LinkOut - more resources
Full Text Sources
Medical
Molecular Biology Databases

