. 2022 Oct 4;119(40):e2212134119.
doi: 10.1073/pnas.2212134119. Epub 2022 Sep 26.

Rpd3 regulates single-copy origins independently of the rDNA array by opposing Fkh1-mediated origin stimulation

Affiliations

Rpd3 regulates single-copy origins independently of the rDNA array by opposing Fkh1-mediated origin stimulation

Yiwei He et al. Proc Natl Acad Sci U S A. .

Abstract

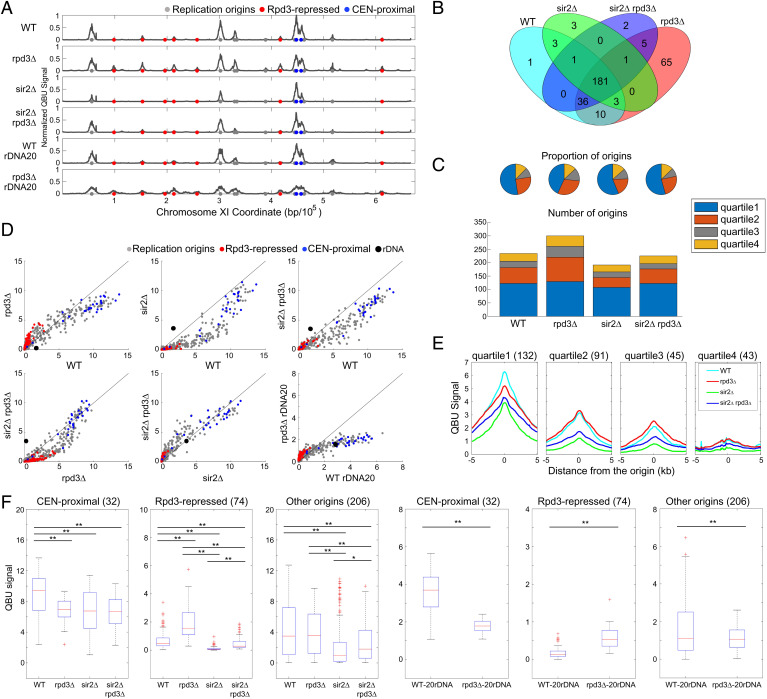
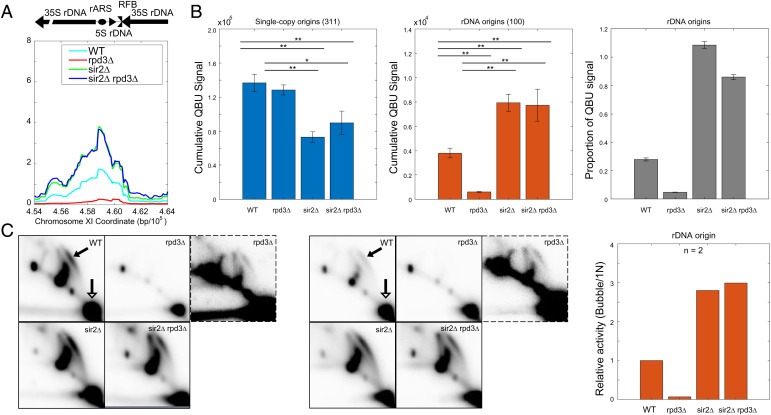
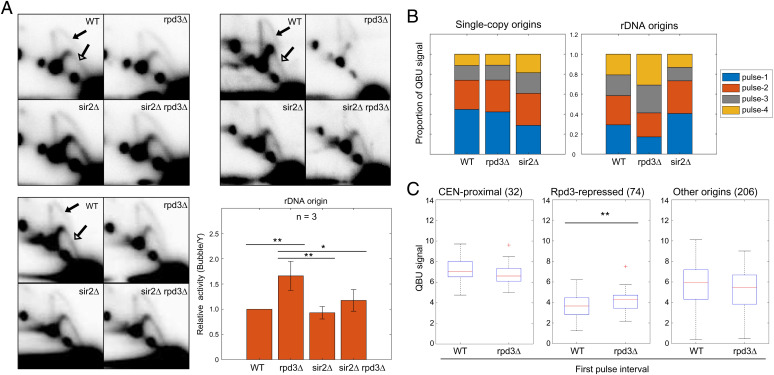
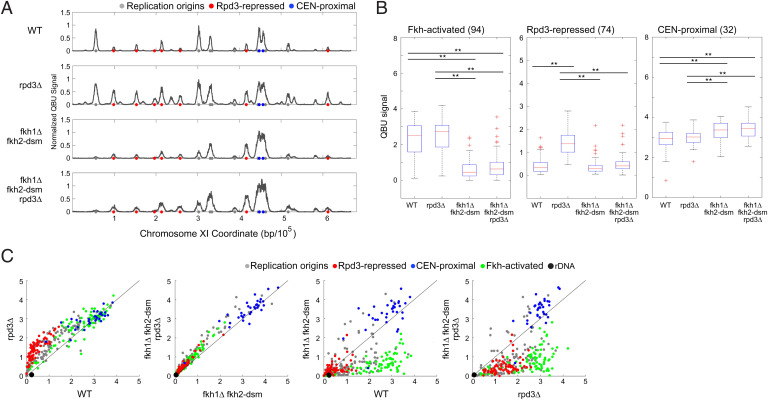
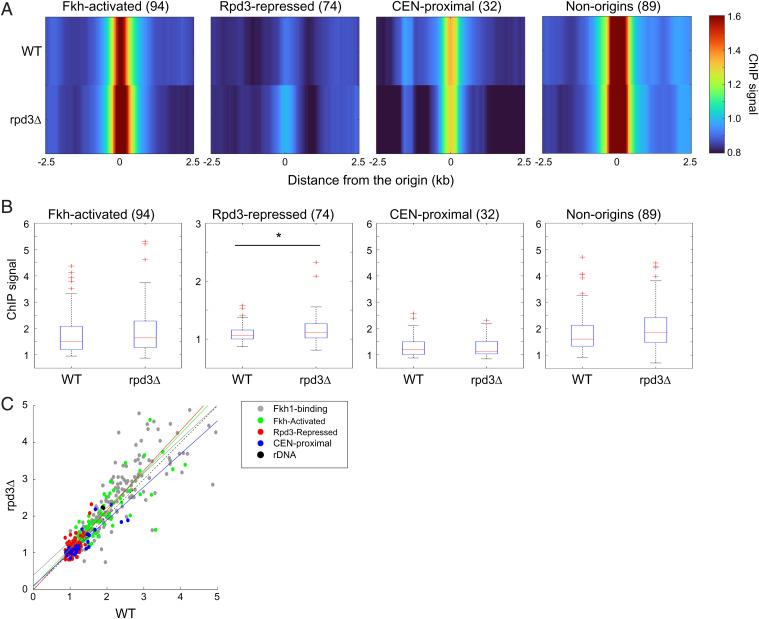
Eukaryotic chromosomes are organized into structural and functional domains with characteristic replication timings, which are thought to contribute to epigenetic programming and genome stability. Differential replication timing results from epigenetic mechanisms that positively and negatively regulate the competition for limiting replication initiation factors. Histone deacetylase Sir2 negatively regulates initiation of the multicopy (∼150) rDNA origins, while Rpd3 histone deacetylase negatively regulates firing of single-copy origins. However, Rpd3's effect on single-copy origins might derive indirectly from a positive function for Rpd3 in rDNA origin firing shifting the competitive balance. Our quantitative experiments support the idea that origins compete for limiting factors; however, our results show that Rpd3's effect on single-copy origin is independent of rDNA copy-number and of Sir2's effects on rDNA origin firing. Whereas RPD3 deletion and SIR2 deletion alter the early S phase dynamics of single-copy and rDNA origin firings in opposite fashion, unexpectedly only RPD3 deletion suppresses overall rDNA origin efficiency across S phase. Increased origin activation in rpd3Δ requires Fkh1/2, suggesting that Rpd3 opposes Fkh1/2-origin stimulation, which involves recruitment of Dbf4-dependent kinase (DDK). Indeed, Fkh1 binding increases at Rpd3-regulated origins in rpd3Δ cells in G1, supporting a mechanism whereby Rpd3 influences initiation timing of single-copy origins directly through modulation of Fkh1-origin binding. Genetic suppression of a DBF4 hypomorphic mutation by RPD3 deletion further supports the conclusion that Rpd3 impedes DDK recruitment by Fkh1, revealing a mechanism of Rpd3 in origin regulation.

Keywords: Chromatin domains; Genome instability; Histone deacetylase; Repetitive DNA; Replication origin.


Conflict of interest statement

The authors declare no competing interest.

Figures

Fig. 1.
Fig. 1.
Rpd3 and Sir2 have different effects on single-copy origins. Strains CVy43 (WT), CVy44 (rpd3Δ), YHy3 (sir2Δ), and YHy6 (sir2Δ rpd3Δ) were synchronized in G1 phase and released into S phase without HU for DNA content analysis (SI Appendix, Fig. S1A) or with HU for 60 min for QBU analysis. Strains with reduced rDNA copies PP1758 (WT rDNA20) and JPy115 (rpd3Δ rDNA20) were synchronized in G1 phase and released into S phase for 120 min in the presence of HU for QBU analysis. (A) QBU values averaged for three replicates and scale normalized across strains are shown for representative chromosome XI; origins and origin subgroups are indicated with color-coded circles below the x axis. (B) Venn diagrams depicting overlaps between origins identified as active in each strain; the union of 311 origins detected was used in subsequent analyses. (C) Origin distributions according to TRep quartiles shown as pie charts with proportions of identified origins in each strain and as stack graphs showing total counts of origins identified in each TRep quartile. (D) 2D scatter plots comparing QBU signals for 500-bp regions centered on 311 individual origins plus the rDNA origins, which are represented by two (overlapping) data points; origins and subgroups are color coded as indicated. (E) Average QBU signals for 311 origins according to their TRep quartile assignments. (F) Box plot distributions of QBU counts for 500-bp regions aligned on origins of the indicated subgroups; n of origins in each group is indicated within parentheses; two-sided t tests were performed on all pairs of strains, and significant results are indicated as *P < 0.05 and **P < 0.01.
Fig. 2.
Fig. 2.
SIR2 deletion is epistatic to RPD3 deletion for rDNA origin firing. See Fig. 1 legend for strains and experimental description. (A) Average QBU signal for the rDNA depicted as a single locus. (B) Cumulative (+/−SD) QBU signal (500-bp windows) for 311 single-copy origins (Left panel) and 100 rDNA origins (Center panel) was determined and plotted; two-sided t tests were performed on all pairs of strains, and significant results are indicated as *P < 0.05 and **P < 0.01. Total QBU signal associated with rDNA origins was divided by total QBU signal associated with 311 single-copy origins plus the rDNA origins (Right panel). (C) 2D gel electrophoresis analysis probing for the rDNA was performed on the strains as described above. Two replicate sets are shown; the images framed with broken lines are darker images of the corresponding rpd3Δ image in each set. The arrows in the WT panels indicate the bubble arcs (filled arrowhead) and 1N spots (unfilled arrowhead) that are used for quantification (see SI Appendix, Fig. S2B for images with exact areas measured for quantification). The graph indicates quantification of the 2D gels by measuring intensity of “bubble arcs” in relation to the corresponding 1N spots; values are relative to WT arbitrarily set to 1.
Fig. 3.
Fig. 3.
Rpd3 suppresses rDNA origin firing. (A) Strains described in Fig. 1 legend were grown logarithmically and harvested for 2D gel analysis and probing for the rDNA. Three replicate sets are shown. The arrows in the WT panels indicate the bubble arcs (filled arrowhead) and early Y-arcs (unfilled arrowhead) that are used for quantification (see SI Appendix, Fig. S3A for images with exact areas measured for quantification). The graph shows quantification of the 2D gels by measuring intensity of bubble arcs in relation to the corresponding Y-arcs (replication fork structures); values are relative to WT arbitrarily set to 1; two-sided t tests were performed on all pairs of strains, and results are indicated as *P < 0.05 and **P < 0.01. (B) WT, rpd3Δ, and sir2 strains described above were synchronized in G1 phase, released into S phase, and incubated with BrdU for the following time intervals for QBU analysis: pulse 1 = 15–30 min, pulse 2 = 25–40 min, pulse 3 = 35–50 min, and pulse 4 = 45–60 min; 5-min overlap is included to account for lag time in BrdU entry to cells and incorporation into DNA. The stack graphs show total QBU signal for 625 potential single-copy origins (Left) and total QBU signal for all rDNA origins during each time interval. (C) Box plot distributions of QBU signals (500-bp regions) in the first pulse interval of the time course for the indicated origin groups.
Fig. 4.
Fig. 4.
Origin derepression in rpd3Δ cells requires Fkh1/2. Strains CVy43 (WT), CVy44 (rpd3Δ), OAy1114 (fkh1Δ fkh2-dsm), and YHy13 (fkh1Δ fkh2-dsm rpd3Δ) were synchronized in G1 phase and released into S phase with HU for 90 min for QBU analysis. (A) Average QBU values are shown for representative chromosome XI; origins and origin subgroups are indicated with color-coded circles below the x axis. (B) Box plot distributions of QBU counts for 500-bp regions aligned on origins of the indicated subgroups; n of origins in each group is indicated within parentheses; two-sided t tests were performed on all pairs of strains, and results are indicated as *P < 0.05 and **P < 0.01. (C) 2D scatter plots comparing QBU signals centered on 311 individual origins plus the rDNA origins represented by two (overlapping) data points; origins and subgroups are color coded as indicated.
Fig. 5.
Fig. 5.
Rpd3 modulates Fkh1 binding to origins. Strains OAy1112 (FKH1-3xFLAG) and YHy17 (rpd3Δ, FKH1-3xFLAG) were synchronized in G1 phase and subjected to ChIP-seq. (A) Heatmaps of ChIP-seq enrichment at selected origin and Fkh1 binding loci; n of each group is indicated within parentheses. The “non-origins” group refers to Fkh1-binding sites called as peaks by MACS in the Fkh1 ChIP-seq dataset that do not overlap with a replication origin. (B) Box plots distributions of ChIP-seq enrichments for 500-bp regions aligned on origins of the indicated subgroups; n of origins or Fkh1 binding loci in each group is indicated within parentheses. Two-sided t tests were performed on all pairs of strains, and results are indicated as *P < 0.05 and **P < 0.01. (C) 2D scatter plots of ChIP-seq signals (500-bp regions) for 174 Fkh1-binding sites (called as peaks by MACS as described above but including origins) plus the indicated origin subgroups, color coded as indicated. A linear regression deriving the best-fit line is shown for each origin group.
Fig. 6.
Fig. 6.
RPD3 deletion suppresses DBF4 deficiency. (A) Diploid strain YHy38 (FKH1/fkh1Δ DBF4/dbf4ΔC) was induced into meiosis and sporulation. Tetrads were dissected onto rich medium and incubated at 23 °C and imaged after 3 days and genotyped. Tetrads are arranged in columns; determined haploid genotypes are indicated on the panel to the right as F/f for FKH1/fkh1Δ and D/d for DBF4/dbf4ΔC; FKH1 and DBF4 are unlinked. Genotypes in red for inviable spores were inferred based on assumption of 2:2 segregation of alleles. The “fd” hypotheticals are circled. (B) Diploid strain OAy1188 (RPD3/rpd3Δ DBF4/dbf4ΔC) was induced into meiosis and sporulation. Tetrads were dissected onto rich medium and incubated at 30 °C and imaged and genotyped after 3 days. Tetrads are arranged in columns; determined haploid genotypes are indicated on the panel to the right as R/r for RPD3/rpd3Δ and D/d for DBF4/dbf4ΔC; RPD3 and DBF4 are unlinked. Genotypes in red for inviable spores were inferred based on assumption of 2:2 segregation of alleles. The “rd” isolates and hypotheticals are circled; the “Rd” hypotheticals are boxed.

References

    1. Tsang E., Carr A. M., Replication fork arrest, recombination and the maintenance of ribosomal DNA stability. DNA Repair (Amst.) 7, 1613–1623 (2008). - PubMed
    1. Nomura M., Ribosomal RNA genes, RNA polymerases, nucleolar structures, and synthesis of rRNA in the yeast Saccharomyces cerevisiae. Cold Spring Harb. Symp. Quant. Biol. 66, 555–565 (2001). - PubMed
    1. MacAlpine D. M., Bell S. P., A genomic view of eukaryotic DNA replication. Chromosome Res. 13, 309–326 (2005). - PubMed
    1. Aparicio O. M., Location, location, location: It’s all in the timing for replication origins. Genes Dev. 27, 117–128 (2013). - PMC - PubMed
    1. Fangman W. L., Brewer B. J., Activation of replication origins within yeast chromosomes. Annu. Rev. Cell Biol. 7, 375–402 (1991). - PubMed

Publication types

MeSH terms