. 2022 Oct 4;119(40):e2204828119.
doi: 10.1073/pnas.2204828119. Epub 2022 Sep 26.

G protein-biased GPR3 signaling ameliorates amyloid pathology in a preclinical Alzheimer's disease mouse model

Affiliations

G protein-biased GPR3 signaling ameliorates amyloid pathology in a preclinical Alzheimer's disease mouse model

Yunhong Huang et al. Proc Natl Acad Sci U S A. .

Abstract

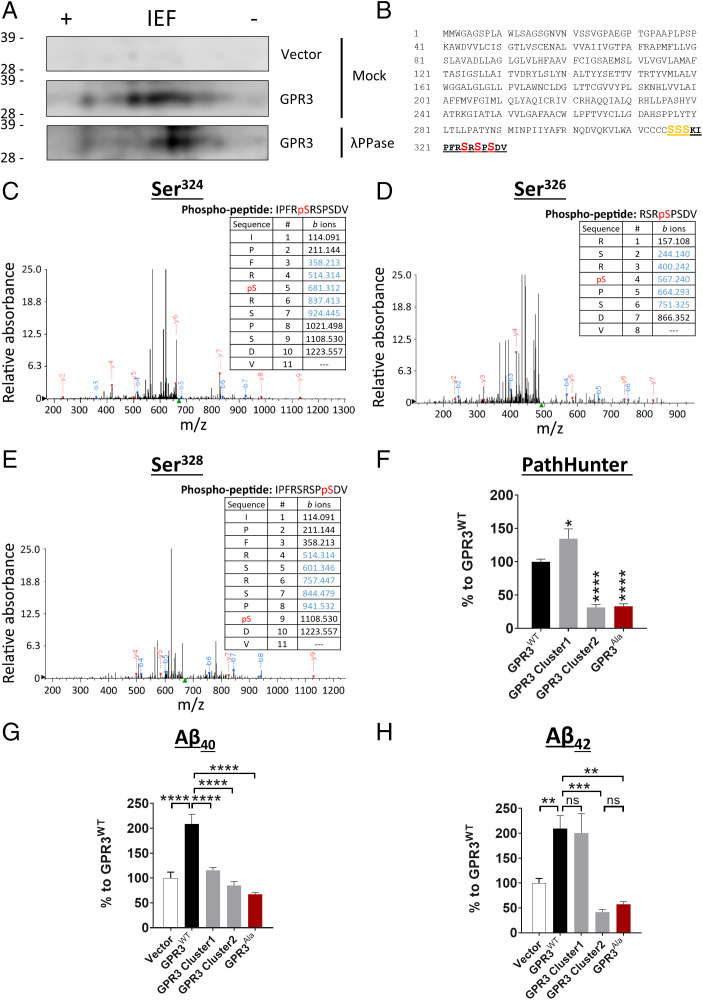
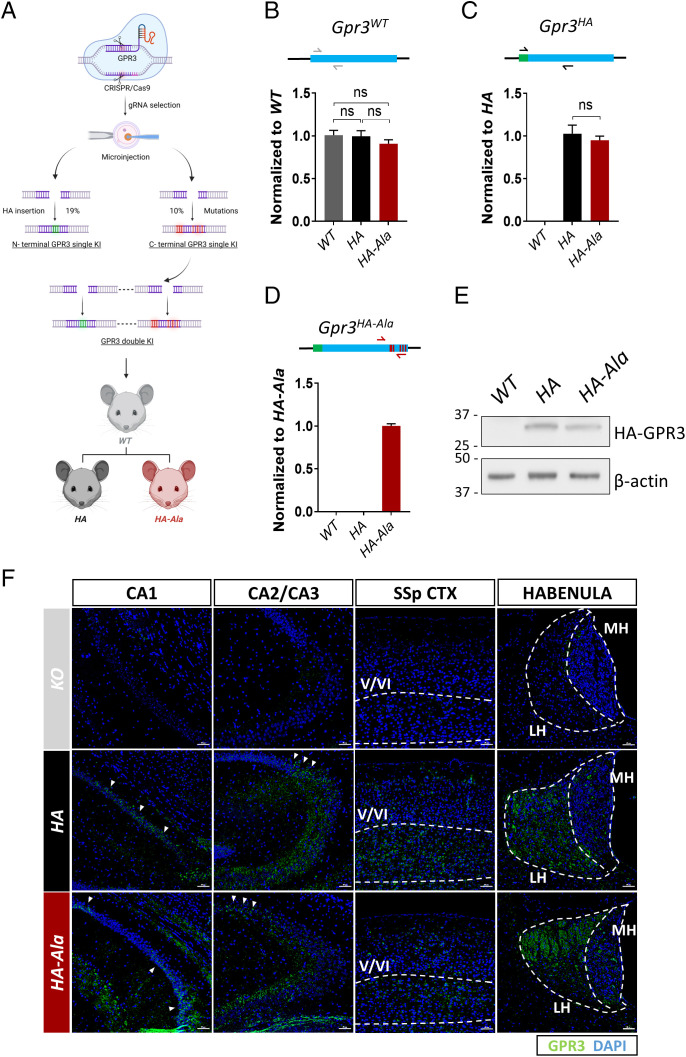
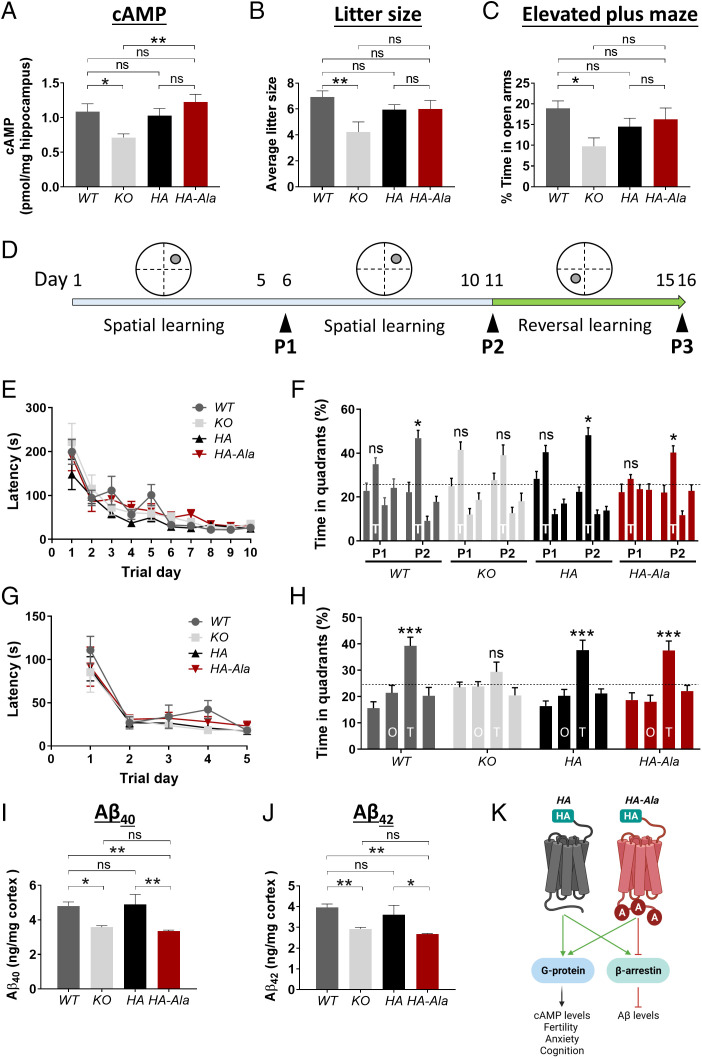
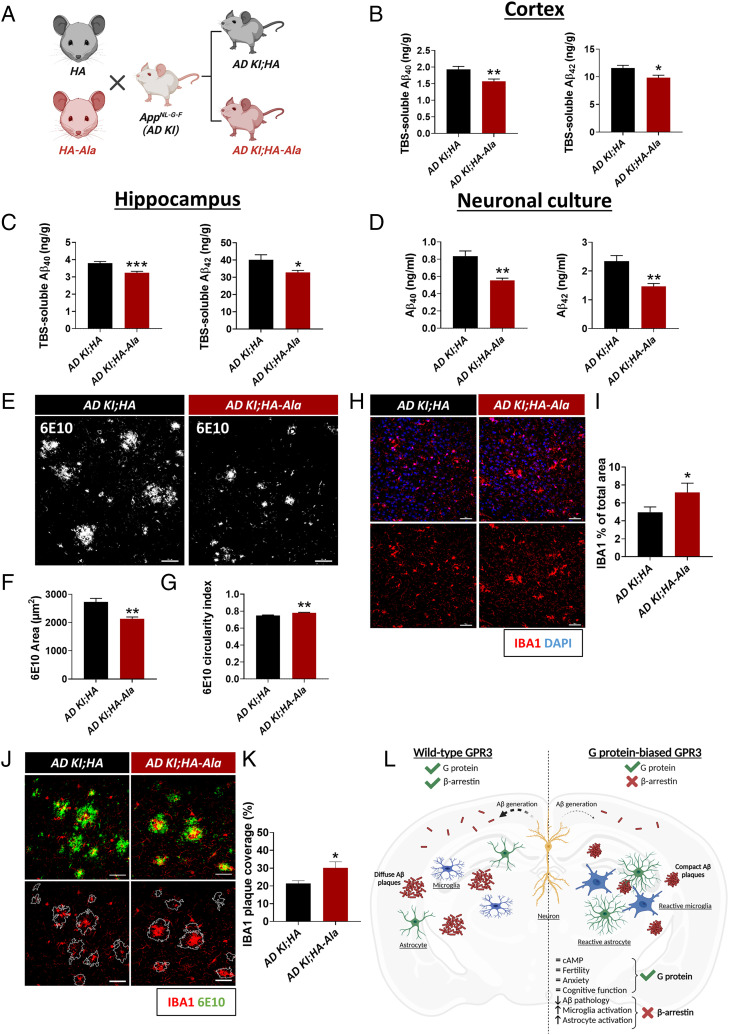
Biased G protein-coupled receptor (GPCR) ligands, which preferentially activate G protein or β-arrestin signaling pathways, are leading to the development of drugs with superior efficacy and reduced side effects in heart disease, pain management, and neuropsychiatric disorders. Although GPCRs are implicated in the pathophysiology of Alzheimer's disease (AD), biased GPCR signaling is a largely unexplored area of investigation in AD. Our previous work demonstrated that GPR3-mediated β-arrestin signaling modulates amyloid-β (Aβ) generation in vitro and that Gpr3 deficiency ameliorates Aβ pathology in vivo. However, Gpr3-deficient mice display several adverse phenotypes, including elevated anxiety-like behavior, reduced fertility, and memory impairment, which are potentially associated with impaired G protein signaling. Here, we generated a G protein-biased GPR3 mouse model to investigate the physiological and pathophysiological consequences of selective elimination of GPR3-mediated β-arrestin signaling in vivo. In contrast to Gpr3-deficient mice, G protein-biased GPR3 mice do not display elevated anxiety levels, reduced fertility, or cognitive impairment. We further determined that G protein-biased signaling reduces soluble Aβ levels and leads to a decrease in the area and compaction of amyloid plaques in the preclinical AppNL-G-F AD mouse model. The changes in amyloid pathology are accompanied by robust microglial and astrocytic hypertrophy, which suggest a protective glial response that may limit amyloid plaque development in G protein-biased GPR3 AD mice. Collectively, these studies indicate that GPR3-mediated G protein and β-arrestin signaling produce discrete and separable effects and provide proof of concept for the development of safer GPCR-targeting therapeutics with more directed pharmacological action for AD.

Keywords: Alzheimer’s disease; G protein–coupled receptor; amyloid plaques; arrestin; biased signaling.


Conflict of interest statement

The authors declare no competing interest.

Figures

Fig. 1.
Fig. 1.
The phosphorylation status of the GPR3 C terminus dictates βarr2 recruitment and Aβ generation. (A) Cell lysates from HEK293 cells, overexpressing empty vector or HA-tagged human GPR3, were immunoprecipitated with an HA antibody and subjected to mock or λ phosphatase (λPPase) treatment. Two-dimensional electrophoresis analysis with an isoelectric focusing (IEF) strip and sodium dodecyl sulfate–polyacrylamide gel electrophoresis (indicates that GPR3 is phosphorylated on C-terminal serine residues. (B) Schematic representation of the protein sequence of human GPR3 indicates the potential C-terminal phosphorylation sites. The peptide sequence identified by mass spectrometry analysis is highlighted in bold and underlined. The consistently identified phosphorylated residues Ser324, Ser326, and Ser328 are highlighted in red. The putative phosphorylated residues Ser316, Ser317, and Ser318 are highlighted in orange. n = 3 independent experiments. (CE) Representative mass spectra and fragmentation tables show the three phosphorylated residues; detected b and y ions are indicated in blue and red, respectively. (FH) Alanine mutagenesis of both cluster 1 and 2 serine residues shows a robust reduction in βarr2 recruitment to GPR3 (F) and Aβ levels (G and H). Vector condition refers to cells transfected with an empty control plasmid without GPR3. (F-H) P < 0.0001 by one-way ANOVA. Data are presented as mean ± SEM. ns, not significant; *P < 0.05, **P < 0.01, ***P < 0.001, and ****P < 0.0001 by one-way ANOVA with Tukey’s post hoc test.
Fig. 2.
Fig. 2.
An in vivo CRISPR/Cas9 gene-editing strategy was used to generate the G protein–biased GPR3 mouse model. (A) The schematic diagram shows the workflow to generate the two mouse models. The single KI HA contains 2xHA insertions in the N terminus of Gpr3. The double KI HA-Ala mouse contains 2xHA insertions at the N terminus of Gpr3 and serine–alanine mutations (S316A, T317A, S318A, S324A, S326A, S328A) in the C terminus of Gpr3. The double KI mouse model was generated from the embryos from F2 C terminus single KI mice. The success rates to obtain single KI mice are indicated in the graph. (BD) The mRNA levels of Gpr3 in WT, HA, and HA-Ala male mice (n = 6 mice/genotype) at 4 mo of age were analyzed by quantitative PCR with three different sets of primers. (B) Gray arrows indicate endogenous Gpr3-specific primers, (C) black arrows indicate HA-GPR3-specific primers, and (D) red arrows indicate HA-GPR3 with the alanine mutation–specific primers. The results indicate that HA and HA-Ala mice express physiological levels of Gpr3. As a control, WT Gpr3 expression is undetectable with the HA- and HA-Ala-specific primers (C and D). HA-GPR3 is undetectable with HA-Ala-specific primers (D). Data were analyzed via one-way ANOVA (P = 0.42 [B], P < 0.0001 [C and D]) and are presented as mean ± SEM. ns, not significant. (E) Representative immunoblot analysis using an antibody to HA indicates that HA-GPR3 is expressed in the mouse cortex of HA and HA-Ala. (F) Representative images from the somatosensory parietal (SSp) cortex (CTX), hippocampal regions (CA1, CA2, and CA3), and habenula of KO (Top Panels), HA (Middle Panels), and HA-Ala (Bottom Panels) mice brains stained with anti-HA (GPR3, green) and DAPI (nuclei, blue). Dashed lines indicate layers V/VI of the cortex and medial (MH) and lateral (LH) habenula. Arrows indicate regions of the CA rich in GPR3 expression. Detection of GPR3 through HA-specific antibodies confirms localization of GPR3 in the cortex and hippocampus, with no region-specific differences between GPR3 WT and Ala mutant. Scale bars = 50 µm. Schematic (A) created with BioRender.com.
Fig. 3.
Fig. 3.
G protein–biased GPR3 mice display reduced Aβ levels and intact cognitive function. (A) cAMP levels were assessed by ELISA in male WT, KO, HA, and HA-Ala mice at 4 mo of age. cAMP levels are reduced in KO mice and unaffected in HA-Ala mice (n = 7–9 mice/genotype; P = 0.0041). (B) Average litter size is reduced in KO (mice relative to WT, HA, and HA-Ala mice at 3–6 mo of age; n = 7–15 mice/genotype; P = 0.0137). (C) Anxiety levels were assessed by the elevated plus maze behavioral paradigm in WT, KO, HA, and HA-Ala at 4 mo of age. The results indicate that KO mice display elevated anxiety (n = 14–21 male and female mice/genotype; P = 0.0445). (D) Schematic of the MWM behavioral paradigm illustrates the study design. P1, P2, and P3 indicate the probe trials. (EH) Spatial learning and reference memory (E), spatial memory and retrieval (F), reversal learning (G), and reversal memory (H) were determined in WT, KO, HA, and HA-Ala mice (n = 10 male and female mice/genotype). T in (F) represents the target quadrant; O and T in (H) represent the opposite quadrant and new target quadrant, respectively. The establishment of spatial memory, reversal memory, and memory retrieval were detected in WT, HA, HA-Ala, but not in KO mice. (I and J) Endogenous Aβ40 (I) and Aβ42 (J) are reduced in male KO and HA-Ala mice relative to control WT and HA mice at 4 mo of age (n = 8–10 mice/genotype; Aβ40, P = 0.0004; Aβ42, P = 0.0006). For all datasets, data are presented as mean ± SEM. ns, not significant; *P < 0.05, **P < 0.01, and ***P < 0.001 are determined by one-way ANOVA with a Tukey’s post hoc test. (K) The schematic diagram summarizes the physiological function of G protein–biased GPR3-mediated signaling in the HA and HA-Ala mouse models. Schematic created with BioRender.com.
Fig. 4.
Fig. 4.
G protein–biased GPR3 AD mice display reduced Aβ pathology and increased microglial and astrocytic activation. (A) AD KI mice were crossed with the HA (AD KI;HA) and HA-Ala (AD KI;HA-Ala) mice. (B and C) TBS-soluble Aβ40 and Aβ42 are reduced in cortex and hippocampus of AD KI;HA-Ala mice relative to AD KI;HA mice at 6 mo of age (n = 12–16 male and female mice/genotype; Aβ40, P = 0.004; Aβ42, P = 0.013) (B) and hippocampus (Aβ40, P = 0.0004; Aβ42, P = 0.018) (C). (D) Aβ40 and Aβ42 levels are reduced in AD KI;HA-Ala relative to AD KI;HA neuronal cultures (n = 6 P0 mice/genotype; Aβ40, P = 0.0014; Aβ42, P = 0.0028). (E) Representative confocal immunofluorescence images show the cortex of AD KI;HA (Left Panel) and AD KI; HA-Ala (Right Panel) mice immunolabeled for Aβ plaques with an anti-APP antibody (6E10; white). (F) Aβ plaque area (in µm2) is reduced in AD KI;HA-Ala relative to AD KI;HA mice (P = 0.0027). (G) Amyloid plaque circularity index (scale of 0–1, with 1 being the most circular), as a measure of amyloid plaque compaction, indicates increased circularity of amyloid plaques in AD KI;HA-Ala relative to AD KI;HA mice (n = 6 male and female mice/genotype; P = 0.0027). (H) Representative confocal immunofluorescence images from the cortex indicate an increase in the percentage area occupied by IBA1+ cells in AD KI; HA-Ala (I) relative to AD KI;HA mice (n = 6 male and female mice/genotype). (J) Representative confocal immunofluorescence images show the cortex of AD KI;HA (Left Panel) and AD KI;HA-Ala (Right Panel) mice immunolabeled for microglia (IBA1; red) and Aβ plaques (6E10; green). (K) The amyloid plaque area covered by IBA1+ cells is increased in AD KI;HA-Ala relative to AD KI;HA mice. Data are presented as mean ± SEM, ns, not significant; *P < 0.05, **P < 0.01, and **P < 0.001 by unpaired Student’s t test. Scale bars = 10 µm. (L) Schematic diagram depicts the physiological and pathophysiological phenotypes of wild-type GPR3 and G protein–biased GPR3 mice in AD. Schematics (A and L) created with BioRender.com.

References

    1. Hauser A. S., Attwood M. M., Rask-Andersen M., Schiöth H. B., Gloriam D. E., Trends in GPCR drug discovery: New agents, targets and indications. Nat. Rev. Drug Discov. 16, 829–842 (2017). - PMC - PubMed
    1. Dowden H., Munro J., Trends in clinical success rates and therapeutic focus. Nat. Rev. Drug Discov. 18, 495–496 (2019). - PubMed
    1. DeWire S. M., Ahn S., Lefkowitz R. J., Shenoy S. K., β-arrestins and cell signaling. Annu. Rev. Physiol. 69, 483–510 (2007). - PubMed
    1. Wisler J. W., Rockman H. A., Lefkowitz R. J., Biased G protein-coupled receptor signaling: Changing the paradigm of drug discovery. Circulation 137, 2315–2317 (2018). - PMC - PubMed
    1. Slosky L. M., Caron M. G., Barak L. S., Biased allosteric modulators: New frontiers in GPCR drug discovery. Trends Pharmacol. Sci. 42, 283–299 (2021). - PMC - PubMed

MeSH terms