. 2022 Oct 4;119(40):e2210649119.
doi: 10.1073/pnas.2210649119. Epub 2022 Sep 26.

TFG regulates secretory and endosomal sorting pathways in neurons to promote their activity and maintenance

Affiliations

TFG regulates secretory and endosomal sorting pathways in neurons to promote their activity and maintenance

Jennifer L Peotter et al. Proc Natl Acad Sci U S A. .

Abstract

Molecular pathways that intrinsically regulate neuronal maintenance are poorly understood, but rare pathogenic mutations that underlie neurodegenerative disease can offer important insights into the mechanisms that facilitate lifelong neuronal function. Here, we leverage a rat model to demonstrate directly that the TFG p.R106C variant implicated previously in complicated forms of hereditary spastic paraplegia (HSP) underlies progressive spastic paraparesis with accompanying ventriculomegaly and thinning of the corpus callosum, consistent with disease phenotypes identified in adolescent patients. Analyses of primary cortical neurons obtained from CRISPR-Cas9-edited animals reveal a kinetic delay in biosynthetic secretory protein transport from the endoplasmic reticulum (ER), in agreement with prior induced pluripotent stem cell-based studies. Moreover, we identify an unexpected role for TFG in the trafficking of Rab4A-positive recycling endosomes specifically within axons and dendrites. Impaired TFG function compromises the transport of at least a subset of endosomal cargoes, which we show results in down-regulated inhibitory receptor signaling that may contribute to excitation-inhibition imbalances. In contrast, the morphology and trafficking of other organelles, including mitochondria and lysosomes, are unaffected by the TFG p.R106C mutation. Our findings demonstrate a multifaceted role for TFG in secretory and endosomal protein sorting that is unique to cells of the central nervous system and highlight the importance of these pathways to maintenance of corticospinal tract motor neurons.

Keywords: COPII; L1CAM; gephyrin; neurodegeneration.


Conflict of interest statement

The authors declare no competing interest.

Figures

Fig. 1.
Fig. 1.
Homozygous TFG p.R106C mutant animals exhibit progressive motor deficits. (A) Schematic illustrating the editing approach used to incorporate the TFG p.R106C mutation into the genome of Sprague–Dawley rats is shown (Top), as well as a chromatogram obtained following Sanger sequencing of a homozygous mutant animal (Bottom). (B) Representative image of a marked animal traversing the MotoRater platform (Top). Schematics illustrate the manner by which hind body sway, tail tip height, and step cycle duration were quantified (Bottom). (C, E, and F) Measurements of hind body sway (C), step cycle duration (E), and tail tip height (F) of control, heterozygous TFG p.R106C, and homozygous TFG p.R106C mutant animals at different ages indicated (n, number of animals assayed; M, male; F, female). Error bars represent mean ± SEM. *P < 0.05, **P < 0.01, and ***P < 0.001, as calculated using an ANOVA test. (D) Representative traces of the tail base point of 25-wk-old animals (control and homozygous TFG p.R106C) as they traverse the platform. WT, wild-type; HDR, Homology-Directed Repair; gRNA, guide Ribonucleic acid; PAM, protospacer adjacent motif.
Fig. 2.
Fig. 2.
Homozygous TFG p.R106C mutant animals exhibit spontaneous electrical activity in hind limb skeletal muscles. (A) Representative electromyograms recorded from 25-wk-old male animals (control and homozygous TFG p.R106C). (B) Quantification of the average number of spikes greater than 20 μV over a 40-s recording period in control, heterozygous TFG p.R106C, and homozygous TFG p.R106C mutant animals (n, number of animals assayed; M, male; F, female). Box and whisker plots show data in the 10th to 90th percentile. *P < 0.05 as calculated by a Dunn’s multiple comparisons test following a Kruskal-Wallis test. WT, wild-type.
Fig. 3.
Fig. 3.
Homozygous TFG p.R106C mutant animals exhibit progressive CNS pathology that is consistent with HSP. (A) Representative images of coronal brain sections from 25-wk-old animals (control and homozygous TFG p.R106C) stained with LFB. Scale bar, 1 mm. (B, C, E, and F) Quantification of the surface area of the corpus callosum (B), the surface area of the ventricles based on H&E staining (C), microglia density based on the presence of Iba1-positive cells in the primary motor cortex (E), and astrocyte density based on the presence of S100beta-positive cells in the primary motor cortex (F) in control, heterozygous TFG p.R106C, and homozygous TFG p.R106C mutant animals (n, number of animals assayed; M, male; F, female). Error bars represent mean ± SEM. **P < 0.01 and ***P < 0.001, as calculated using an ANOVA test. (D) Representative electron micrographs of the CST (lumbar region of the spinal cord) from 25-wk-old animals (Left; control and homozygous TFG p.R106C). Scale bar, 2 μm. Quantification of myelin sheath thickness based on the G-ratio is also shown (Right). Error bars represent mean ± SEM. ***P < 0.001, as calculated using an unpaired t test. WT, wild-type.
Fig. 4.
Fig. 4.
The TFG p.R106C mutation reduces the kinetics of secretory protein transport. (A) Representative images of primary rat cortical neurons from control and homozygous TFG p.R106C mutant animals grown in vitro for 10 d and stained using antibodies accessible only to cell surface L1CAM (Top). Scale bar, 10 μm. Quantification of the relative levels of surface L1CAM intensity as determined for neurons grown in vitro for 10 d that are heterozygous or homozygous for the TFG p.R106C mutation compared to control neurons (Bottom; three biological replicates each). Error bars represent mean ± SEM. ***P < 0.001, as calculated using an ANOVA test. (B) Representative immunoblot analysis of control, heterozygous TFG p.R106C, and homozygous TFG p.R106C mutant neurons grown for 10 d in vitro using antibodies directed against L1CAM (Top, Left) and beta-actin (Bottom, Left). Quantification of the relative levels of L1CAM in neurons grown in vitro for 10 d that are heterozygous or homozygous for the TFG p.R106C mutation compared to control neurons (Right; four biological replicates). No statistically significant differences were found. (C) Representative images of control and homozygous TFG p.R106C neurons grown for 14 d in vitro that were transiently transfected with a releasable form of HaloTag-L1CAM following dye-labeling with the JFX650-HaloTag ligand (Left). Neurons were fixed and stained using antibodies directed against GM130 before and after the addition of DDS. Scale bar, 10 μm. Quantification of Golgi-localized HaloTag-L1CAM intensity at various time points after release from the ER in control, heterozygous TFG p.R106C, and homozygous TFG p.R106C mutant neurons (Right; three biological replicates each). Error bars represent mean ± SEM. ***P < 0.001, as calculated using an ANOVA test. (D and E) Representative images of control and homozygous TFG p.R106C mutant neurons grown 14 d in vitro and immunostained using antibodies directed against TFG (Left). Scale bars, 10 μm (D) and 2 μm (E). Quantification shows the relative number of high-intensity TFG structures in the soma of heterozygous and homozygous TFG p.R106C mutant neurons grown in vitro for 7 d compared to control neurons in the soma (D, Right) and in neurites (E, Right; at least 30 μm of neurite length examined per sample), where values are shown as a percentage of the total number of TFG structures analyzed (Right; three biological replicates each). Error bars represent mean ± SEM. ***P < 0.001 and *P < 0.05, as calculated using an ANOVA test. (F) Representative images of control iPSC-derived neurons immunostained using antibodies directed against TFG (red; Left) and TRIM46 (green; Left). Scale bars, 10 μm and 5 μm (zoomed panel). Quantification of the number of TFG structures present in axons and dendrites is also shown (Right; three biological replicates each). Error bars represent mean ± SEM. No statistically significant differences were identified. WT, wild-type; DIV10, 10 days in vitroh; IPSC, human induced pluripotent stem cell; AIS, axon initial segment.
Fig. 5.
Fig. 5.
TFG regulates the dynamics of Rab4A-positive endosomes. (A) Representative images of control iPSC-derived neurons immunostained using antibodies directed against Sec31A (green; Left) and TFG (red; Left). Scale bar, 10 μm. Quantification of the percentage of TFG that colocalizes with Sec31A in the soma and in neuronal processes is also shown (Right; three biological replicates with more than 3,500 structures analyzed). Arrows highlight a structure where Sec31A and TFG are both present. Arrowheads highlight a structure which harbors TFG but not Sec31A. Error bars represent mean ± SEM. (B) Representative images of control iPSC-derived neurons expressing a GFP fusion to TFG (red) from its endogenous locus and mScarlet-Rab4A (green) transduced following lentiviral infection in different locations along neurites (soma proximal, within 70 µm of the soma; medial, >100 µm from the soma and >150 µm from the growth cone; distal, within 150 µm of the growth cone). Arrows highlight sites of colocalization. Scale bar, 10 μm. (C) Quantification of the percentage of Rab4A that colocalizes with TFG (Top) and the percentage of TFG that colocalizes with Rab4A (Bottom) in different regions of neuronal processes is shown (three biological replicates). Error bars represent mean ± SEM. ***P < 0.001 and *P < 0.05, as calculated using an ANOVA test. (D) Representative images of control and homozygous TFG p.R106C mutant iPSC-derived neurons transduced with lentivirus to express mScarlet-Rab4A. Arrowheads highlight Rab4A-positive structures. Scale bar, 10 μm. (E and F) Quantification of the density (E) and velocity (F) of Rab4A-positive structures in control and TFG p.R106C mutant neurons (three biological replicates each). Error bars represent mean ± SEM. ***P < 0.001 and *P < 0.05, as calculated using an ANOVA test. WT, wild-type; hiPSC, human induced pluripotent stem cell.
Fig. 6.
Fig. 6.
TFG regulates the endosomal trafficking of gephyrin in neurons. (A) Representative Coomassie-stained SDS-PAGE gel shows proteins recovered and identified using mass spectrometry following TFG immunoprecipitation from rat brain extracts (Left; three biological replicates performed). The distribution of peptides identified by mass spectrometry together with the percentage sequence coverage for gephyrin and TFG is also shown (red; Right). (B) Representative images of a Coomassie-stained gel (Top) and immunoblot (Bottom) are shown following a GST pull-down experiment from extracts coexpressing His-SUMO-TFG and either GST or a GST fusion to gephyrin (three biological replicates performed). (C) Representative images of control primary cortical rat neurons grown in culture for 14 d, coexpressing an mScarlet fusion to Rab4A (red; transduced following lentiviral infection) and probe for gephyrin fused to GFP (green; following transfection). Arrowheads highlight sites where Rab4A and gephyrin are transported together within neurites. Scale bar, 10 μm. (D) Quantification of the percentage of Rab4A that colocalizes with a probe for PI3P (2xFYVE) and gephyrin in different regions of neuronal processes is shown (three biological replicates; neurons grown 14 d in vitro). Error bars represent mean ± SEM. (E and F) Quantification of the relative intensities of gephyrin (E) and the GABAA receptor (GABAAR; F) that were directly juxtaposed to VGAT staining in control and TFG p.R106C mutant primary rat cortical neurons grown in culture for 21 d (three biological replicates each). Error bars represent mean ± SEM. *P < 0.05, as calculated using an ANOVA test. (G) Schematic showing whole-cell patch-clamp measurement of GABAergic currents in culture cortical neurons. (H) Representative traces of mIPSC recordings obtained from control, heterozygous TFG p.R106C, and homozygous TFG p.R106C mutant neurons. (I) Violin plot of mIPSCs recorded from control, heterozygous TFG p.R106C, and homozygous TFG p.R106C mutant neurons (700 to 1,100 events per genotype). Horizontal black bars demarcate quartiles. The plot was truncated at −120 pA for clarity of display. ***P < 0.001, as calculated using a Kruskal-Wallis test. WT, wild-type; MWM, Molecular Weight Marker; IP, immunoprecipitation.
Fig. 7.
Fig. 7.
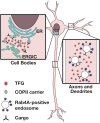
Model for TFG function in neurons. TFG distributed throughout neurons functions distinctly in the soma (regulation of cargo transport from the ER to the ERGIC via COPII-coated transport carriers) compared to axons and dendrites (regulates transport of Rab4A-positive recycling endosomes).

References

    1. Olivares-Moreno R., et al. , Corticospinal vs rubrospinal revisited: An evolutionary perspective for sensorimotor integration. Front. Neurosci. 15, 686481 (2021). - PMC - PubMed
    1. Welniarz Q., Dusart I., Roze E., The corticospinal tract: Evolution, development, and human disorders. Dev. Neurobiol. 77, 810–829 (2017). - PubMed
    1. Chaudhary R., Agarwal V., Rehman M., Kaushik A. S., Mishra V., Genetic architecture of motor neuron diseases. J. Neurol. Sci. 434, 120099 (2022). - PubMed
    1. Sangari S., Perez M. A., Imbalanced corticospinal and reticulospinal contributions to spasticity in humans with spinal cord injury. J. Neurosci. 39, 7872–7881 (2019). - PMC - PubMed
    1. Blackstone C., Converging cellular themes for the hereditary spastic paraplegias. Curr. Opin. Neurobiol. 51, 139–146 (2018). - PMC - PubMed

Publication types

LinkOut - more resources