. 2022 Oct 4;119(40):e2209139119.
doi: 10.1073/pnas.2209139119. Epub 2022 Sep 26.

Evolution of the ancestral mammalian karyotype and syntenic regions

Affiliations

Evolution of the ancestral mammalian karyotype and syntenic regions

Joana Damas et al. Proc Natl Acad Sci U S A. .

Abstract

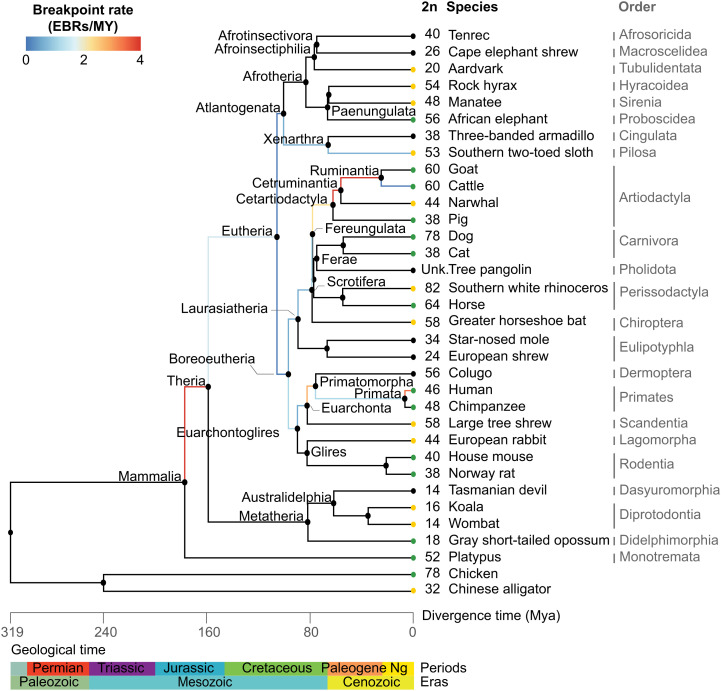
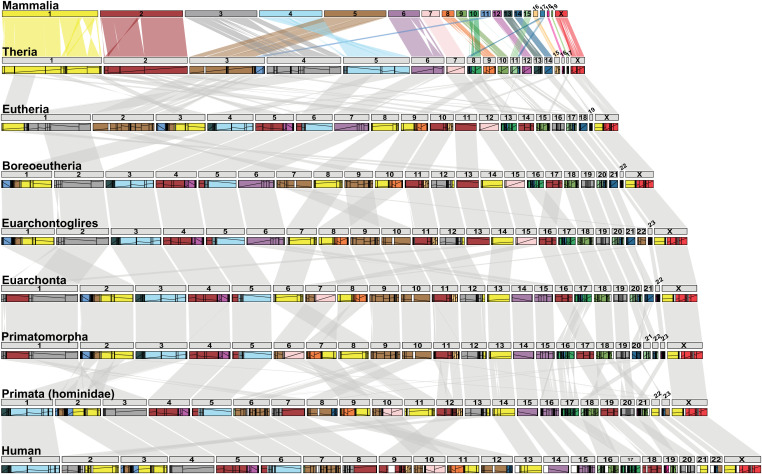
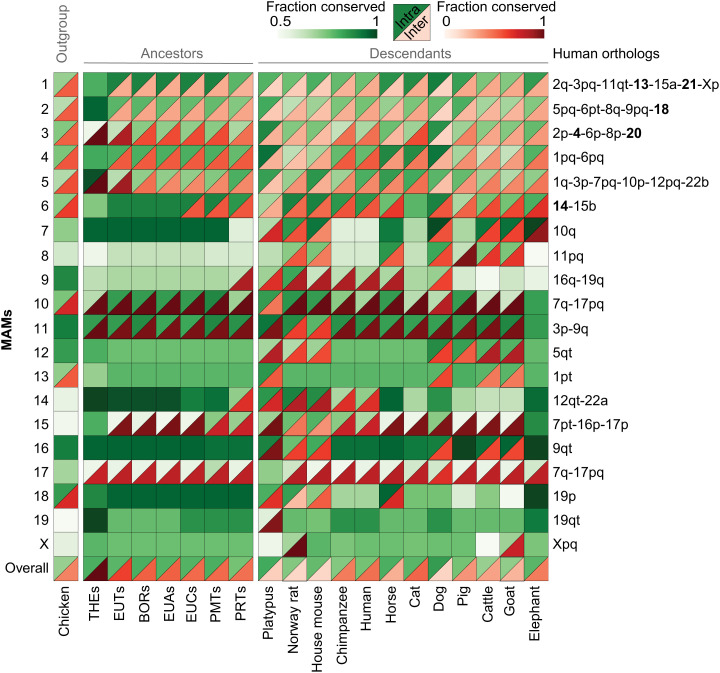
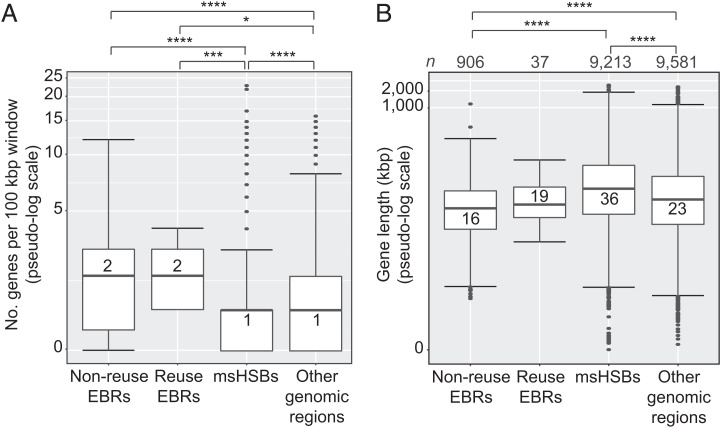
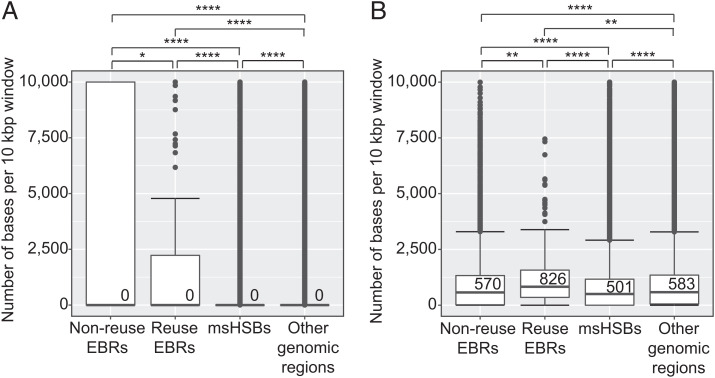
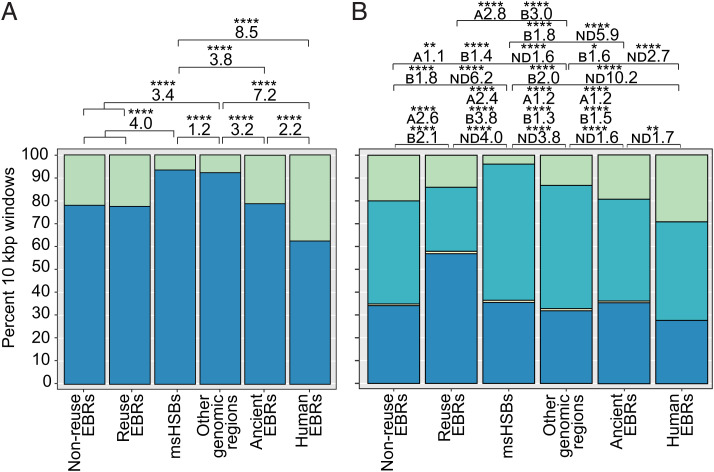
Decrypting the rearrangements that drive mammalian chromosome evolution is critical to understanding the molecular bases of speciation, adaptation, and disease susceptibility. Using 8 scaffolded and 26 chromosome-scale genome assemblies representing 23/26 mammal orders, we computationally reconstructed ancestral karyotypes and syntenic relationships at 16 nodes along the mammalian phylogeny. Three different reference genomes (human, sloth, and cattle) representing phylogenetically distinct mammalian superorders were used to assess reference bias in the reconstructed ancestral karyotypes and to expand the number of clades with reconstructed genomes. The mammalian ancestor likely had 19 pairs of autosomes, with nine of the smallest chromosomes shared with the common ancestor of all amniotes (three still conserved in extant mammals), demonstrating a striking conservation of synteny for ∼320 My of vertebrate evolution. The numbers and types of chromosome rearrangements were classified for transitions between the ancestral mammalian karyotype, descendent ancestors, and extant species. For example, 94 inversions, 16 fissions, and 14 fusions that occurred over 53 My differentiated the therian from the descendent eutherian ancestor. The highest breakpoint rate was observed between the mammalian and therian ancestors (3.9 breakpoints/My). Reconstructed mammalian ancestor chromosomes were found to have distinct evolutionary histories reflected in their rates and types of rearrangements. The distributions of genes, repetitive elements, topologically associating domains, and actively transcribed regions in multispecies homologous synteny blocks and evolutionary breakpoint regions indicate that purifying selection acted over millions of years of vertebrate evolution to maintain syntenic relationships of developmentally important genes and regulatory landscapes of gene-dense chromosomes.

Keywords: ancestral genome reconstruction; chromosome evolution; mammals; synteny conservation; topologically associating domains.


Conflict of interest statement

The authors declare no competing interest.

Figures

Fig. 1.
Fig. 1.
Phylogenetic tree of descendant species and reconstructed ancestors. The branch color represents breakpoint rates in RACFs (breakpoints per million years). Black branches represent nondetermined breakpoint rates. Tip colors depict assembly contiguity: black, scaffold-level genome assembly; green, chromosome-level genome assembly; yellow, chromosome-scale scaffold-level genome assembly. Numbers next to species names indicate diploid chromosome number (if known).
Fig. 2.
Fig. 2.
Evolution of MAMs in the lineage leading to humans. MAMs are distinguished by the colors at the top of the diagram. Colored blocks for every other ancestor and human depict the orthology to MAMs. Lines within colored blocks represent block orientation compared with the MAMs, with positive and negative slopes portraying the same or different orientations, respectively. Gray ribbons depict the orthology of each ancestor to its phylogenetically closest ancestors or species. An orthology map for each pairwise comparison is presented in Dataset S12.
Fig. 3.
Fig. 3.
Visualization of the evolutionary history of reconstructed mammalian chromosomes based on the human lineage. Solid green squares indicate mammalian chromosomes maintained as a single synteny block (either as a single chromosome or fused with another MAM), with shades of the color indicating the fraction of the chromosome affected by intrachromosomal rearrangements (the lightest shade is most affected). Split blocks demarcate mammalian chromosomes affected by interchromosomal rearrangements. Upper (green) triangles show the fraction of the chromosome affected by intrachromosomal rearrangements, and lower (red) triangles show the fraction affected by interchromosomal rearrangements. Syntenic relationships of each MAM to the human genome are given at the right of the diagram. MAMX appears split in goat because its X chromosome is assembled as two separate fragments. BOR, boreoeutherian ancestor chromosome; EUA, Euarchontoglires ancestor chromosome; EUC, Euarchonta ancestor chromosome; EUT, eutherian ancestor chromosome; PMT; Primatomorpha ancestor chromosome; PRT, primates (Hominidae) ancestor chromosome; THE, therian ancestor chromosome.
Fig. 4.
Fig. 4.
Distribution of human protein-coding genes within EBRs, msHSBs, and other regions of the human genome. (A) Number of human protein-coding genes in 100-kbp windows. (B) Length distribution of complete human protein-coding genes within nonreuse EBRs, reuse EBRs, msHSBs, and other regions of the human genome. Numbers of complete human protein-coding genes in each category are given at the top of the diagram. (B) Numbers within the box plots are group medians. Asterisks depict Bonferroni-corrected P values. Only significant comparisons are shown. *P < 0.05; ***P ≤ 0.001; ****P ≤ 0.0001.
Fig. 5.
Fig. 5.
Distribution of repetitive sequences within EBRs, msHSBs, and other regions of the human genome. (A) Number of bases within segmental duplications in 10-kbp windows. (B) Number of bases within LTRs in 10-kbp windows. Numbers within the box plots are group medians. Asterisks depict Bonferroni-corrected P values. Only significant comparisons are shown. Results for other repeat classes and subclasses are shown in SI Appendix, Figs. S13 and S14, respectively. *P < 0.05; **P ≤ 0.01; ****P ≤ 0.0001.
Fig. 6.
Fig. 6.
Distribution of TADs and chromatin compartments within EBRs, msHSBs, and other regions of the human genome. (A) Percentage of 10-kbp windows with (1+; blue) or without (0; green) defined TADs. (B) Percentage of 10-kbp windows in A (blue) or B (turquoise) compartments containing compartment switches (A/B; yellow) or without defined compartments (ND; green). ORs for pairwise comparisons are given above the bars. Asterisks depict Bonferroni-corrected P values. Only significant comparisons are shown. Total numbers of windows were 6,224 for nonreuse EBRs, 285 for reuse EBRs, 253 for human-specific EBRs (“human EBRs”; i.e., those EBRs that distinguish the human genome from the primate ancestor), 6,256 for more ancient human lineage-specific EBRs (“ancient EBRs”; EBRs identified in the branches from the mammalian ancestor until the primate ancestor), 168,649 for msHSBs, and 106,272 for the remaining human genome (“other genomic regions”). The y-axis scale is the same for A and B. *P < 0.05; **P ≤ 0.01; ****P ≤ 0.0001.

References

    1. Damas J., Corbo M., Lewin H. A., Vertebrate chromosome evolution. Annu. Rev. Anim. Biosci. 9, 1–27 (2021). - PubMed
    1. Bourque G., Zdobnov E. M., Bork P., Pevzner P. A., Tesler G., Comparative architectures of mammalian and chicken genomes reveal highly variable rates of genomic rearrangements across different lineages. Genome Res. 15, 98–110 (2005). - PMC - PubMed
    1. Kim J., et al. , Reconstruction and evolutionary history of eutherian chromosomes. Proc. Natl. Acad. Sci. U.S.A. 114, E5379–E5388 (2017). - PMC - PubMed
    1. Ma J., et al. , Reconstructing contiguous regions of an ancestral genome. Genome Res. 16, 1557–1565 (2006). - PMC - PubMed
    1. Murphy W. J., et al. , Dynamics of mammalian chromosome evolution inferred from multispecies comparative maps. Science 309, 613–617 (2005). - PubMed

Publication types