Meta-Analysis
. 2022 Nov 1;45(11):2718-2728.
doi: 10.2337/dc22-0323.

SGLT2 Inhibition, Choline Metabolites, and Cardiometabolic Diseases: A Mediation Mendelian Randomization Study

Affiliations
Meta-Analysis

SGLT2 Inhibition, Choline Metabolites, and Cardiometabolic Diseases: A Mediation Mendelian Randomization Study

Min Xu et al. Diabetes Care. .

Abstract

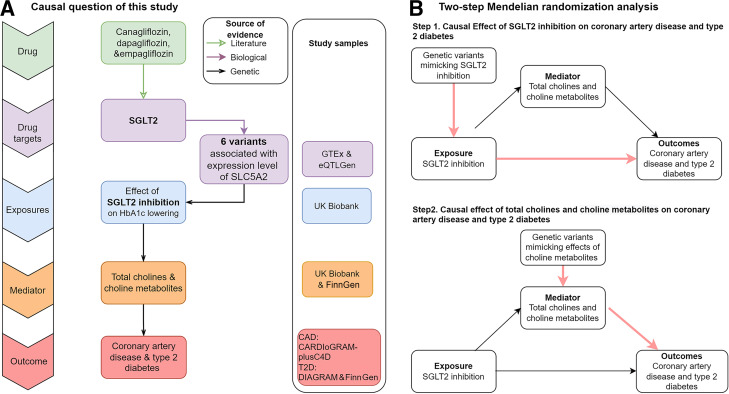
Objective: To investigate the causal role of choline metabolites mediating sodium-glucose cotransporter 2 (SGLT2) inhibition in coronary artery disease (CAD) and type 2 diabetes (T2D) using Mendelian randomization (MR).

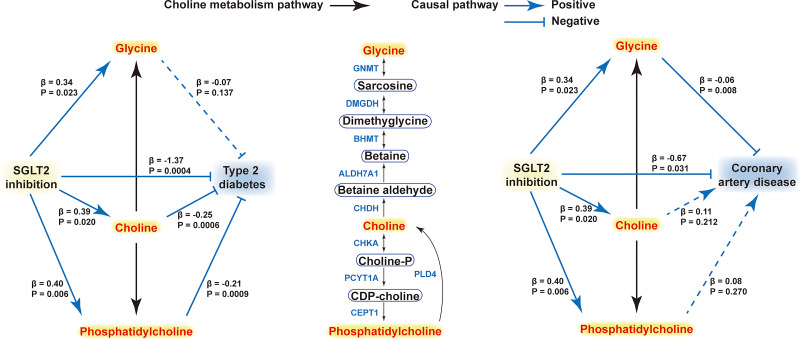
Research design and methods: A two-sample two-step MR was used to determine 1) causal effects of SGLT2 inhibition on CAD and T2D; 2) causal effects of three choline metabolites, total choline, phosphatidylcholine, and glycine, on CAD and T2D; and 3) mediation effects of these metabolites. Genetic proxies for SGLT2 inhibition were identified as variants in the SLC5A2 gene that were associated with both levels of gene expression and hemoglobin A1c. Summary statistics for metabolites were from UK Biobank, CAD from CARDIoGRAMplusC4D (Coronary ARtery DIsease Genome wide Replication and Meta-analysis [CARDIoGRAM] plus The Coronary Artery Disease [C4D] Genetics) consortium, and T2D from DIAbetes Genetics Replication And Meta-analysis (DIAGRAM) and the FinnGen study.

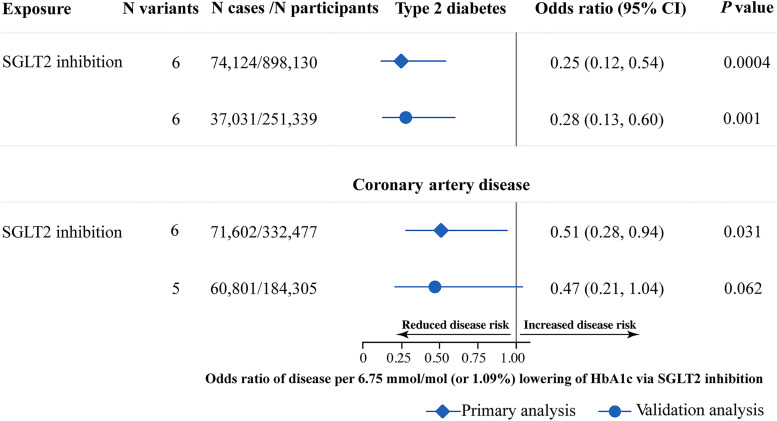
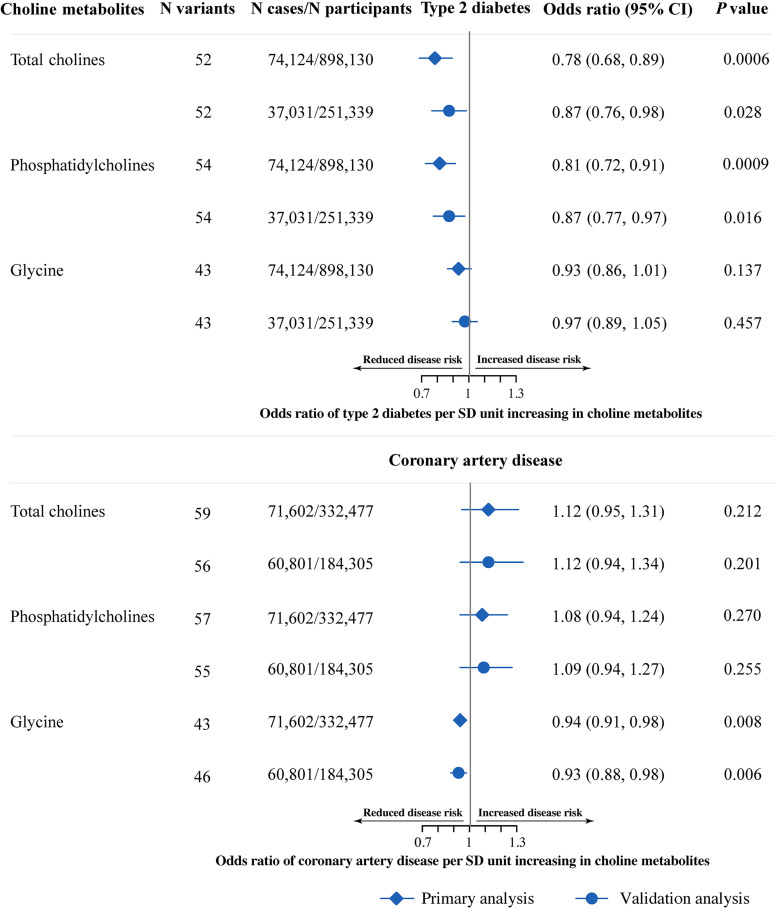
Results: SGLT2 inhibition (per 1 SD, 6.75 mmol/mol [1.09%] lowering of HbA1c) was associated with lower risk of T2D and CAD (odds ratio [OR] 0.25 [95% CI 0.12, 0.54], and 0.51 [0.28, 0.94], respectively) and positively with total choline (β 0.39 [95% CI 0.06, 0.72]), phosphatidylcholine (0.40 [0.13, 0.67]), and glycine (0.34 [0.05, 0.63]). Total choline (OR 0.78 [95% CI 0.68, 0.89]) and phosphatidylcholine (OR 0.81 [0.72, 0.91]) were associated with T2D but not with CAD, while glycine was associated with CAD (0.94 [0.91, 0.98]) but not with T2D. Mediation analysis showed evidence of indirect effect of SGLT2 inhibition on T2D through total choline (0.91 [0.83, 0.99]) and phosphatidylcholine (0.93 [0.87, 0.99]) with a mediated proportion of 8% and 5% of the total effect, respectively, and on CAD through glycine (0.98 [0.96, 1.00]) with a mediated proportion of 2%. The results were well validated in at least one independent data set.

Conclusions: Our study identified the causal roles of SGLT2 inhibition in choline metabolites. SGLT2 inhibition may influence T2D and CAD through different choline metabolites.


Figures

Figure 1
Figure 1
Study design. A: The study question is whether there is a causal role of choline metabolites (mediators) in mediating the effect of SGLT2 inhibition (exposures) on CAD and T2D (outcomes). The green modules and arrow show the selected drugs and their targets, which come from the literature evidence. The purple modules and arrow show the process of looking up genetic variants associated with the expression level of SLC5A2 gene (using data from GTEx and eQTLGen Consortium), the functional gene of SGLT2 inhibitors, which means a biological link. The blue modules and black arrows indicate the MR estimates of effects of the variants on HbA1c level using data from the UK Biobank. The orange modules indicate the selected metabolites from the UK Biobank, and data are from the population-based GWAS. The red modules represent selected cardiometabolic outcomes, T2D, and CAD. B: Diagram of the two steps of MR models: step 1, to establish the causal effect of SGLT2 inhibition on CAD and T2D, and step 2, to establish the causal effect of the choline metabolites on CAD and T2D.
Figure 2
Figure 2
Causal effect of SGLT2 inhibition on T2D and CAD. The OR and 95% CI indicate the effect estimates of decrease in T2D and CAD per SD unit (6.75 mmol/mol or 1.09%) lowering of HbA1c via SGLT2 inhibition with use of the IVW method. The T2D data were from the DIAGRAM consortium in the primary analysis (the diamonds) and FinnGen study in the validation analysis (dots). The CAD data were from a meta-GWAS of CARDIoGRAMplusC4D and UK Biobank in the primary analysis (diamonds) and CARDIoGRAMplusC4D only in the validation analysis (dots).
Figure 3
Figure 3
Causal effect of choline metabolites on T2D and CAD. The OR and 95% CI indicate the effect estimates of decrease in T2D and CAD risk per SD unit of each choline metabolite with use of the IVW method. The T2D data were from the DIAGRAM consortium in the primary analysis (diamonds) and FinnGen study in the validation analysis (dots). The CAD data were from a meta-GWAS of CARDIoGRAMplusC4D and UK Biobank in the primary analysis (diamonds), and CARDIoGRAMplusC4D only in the validation analysis (dots).
Figure 4
Figure 4
Integration of causal and choline metabolism evidence. Proteins in the PPI network including 1 drug target (SLC5A2) (red node), 21 glycine-choline pathway-related proteins (5 enzymes in choline-glycine biosynthesis pathway and 16 glycine-associated SNP corresponding proteins) (yellow nodes), and 35 choline-phosphatidylcholine pathway–related proteins (4 enzymes in choline-phosphatidylcholine biosynthesis pathway and 31 choline and phosphatidylcholine-associated SNP corresponding proteins) (blue nodes). Parameters: network type = full STRING network, confidence score ≥0.4. After removal of isolated nodes, the PPI network with 57 nodes (proteins) and 191 edges (interactions) was generated. These proteins/genes were clustered into three groups, proteins related to lipids metabolism, choline metabolism, and glycine metabolism. The PPI network was built with stringApp in Cytoscape with the following parameters: data source = protein query, species = H. sapiens, network type = full STRING network, confidence score ≥0.4, layout = yFiles Organic layout. The edge thickness represents the confidence score of each interaction from evidence channel in STRING. The distance of each edge was automatically generated with Organic layout algorithm, which rearranges the positions of the nodes to reach well-balanced distribution of nodes, few edge crossings, and a minimal sum of distance between nodes and edges. Organic layout is well suited for the visualization of highly connected backbone regions, and different modules of a network can be easily identified with proteins containing more interactions as hub nodes placing in the core of the network and proteins containing less interactions as outliers.
Figure 5
Figure 5
Summary integrating the causal evidence from MR with the biological evidence from the pathway and PPI analysis. The diagram includes the choline metabolism pathway (middle) and causal pathways of SGLT2 inhibition–metabolites–diseases. In choline metabolism pathway, single-side arrows indicate nonreversible reactions and double-side arrows indicate reversible reactions. In causal pathways, the arrows and T-shaped lines labeled with corresponding enzymes beside signify positive and negative associations, respectively, in which the solid lines indicate significant causality and dotted lines nonsignificant. The β-values are the MR estimates. GNMT, glycine N-methyltransferase; BHMT, betaine-homocysteine S-methyltransferase; CEPT1, choline/ethanolamine phosphotransferase 1; CHDH, choline dehydrogenase; CHKA, choline kinase α; DMGDH, dimethylglycine dehydrogenase; ALDH7A1, aldehyde dehydrogenase 7 family member A1; PCYT1A, phosphate cytidylyltransferase 1A; PLD4, phospholipase D family member 4.

References

    1. Heerspink HJ, Perkins BA, Fitchett DH, Husain M, Cherney DZ. Sodium glucose cotransporter 2 inhibitors in the treatment of diabetes mellitus: cardiovascular and kidney effects, potential mechanisms, and clinical applications. Circulation 2016;134:752–772 - PubMed
    1. Zinman B, Wanner C, Lachin JM, et al. .; EMPA-REG OUTCOME Investigators . Empagliflozin, cardiovascular outcomes, and mortality in type 2 diabetes. N Engl J Med 2015;373:2117–2128 - PubMed
    1. Neal B, Perkovic V, Mahaffey KW, et al. .; CANVAS Program Collaborative Group . Canagliflozin and cardiovascular and renal events in type 2 diabetes. N Engl J Med 2017;377:644–657 - PubMed
    1. Wiviott SD, Raz I, Bonaca MP, et al. .; DECLARE–TIMI 58 Investigators . Dapagliflozin and cardiovascular outcomes in type 2 diabetes. N Engl J Med 2019;380:347–357 - PubMed
    1. Cannon CP, Pratley R, Dagogo-Jack S, et al. .; VERTIS CV Investigators . Cardiovascular outcomes with ertugliflozin in type 2 diabetes. N Engl J Med 2020;383:1425–1435 - PubMed

Publication types

MeSH terms